
 ?Mathematical formulae have been encoded as MathML and are displayed in this HTML version using MathJax in order to improve their display. Uncheck the box to turn MathJax off. This feature requires Javascript. Click on a formula to zoom.
Abstract
We conducted a scientific quantitative analysis of the spatiotemporal evolution and driving factors of land use in Henan Province using a spatial zoning approach. The province was divided into five distinctive regions. Employing methods, such as information mapping, we analyzed land use data for 1990, 2000, 2010, and 2020, investigating spatiotemporal evolution and differences. Additionally, we employed a geographic detector model to explore the dominant factors behind land use changes in 2010 and 2020. Primary land classes in Henan Province included cultivated land, forests, and construction, with cultivated land transitioning mainly to forests and construction. However, regional analyses revealed diverse outcomes. In the Yudong area, cultivated land dominated with an 80% area proportion, shifting mostly to construction. In the Yubei area, grassland transformed into cultivated land and forests, with escalating grassland loss. The Yuxi area exhibited a 40% forest area proportion, with frequent mutual conversions between forests, cultivated land, and grassland. Spatiotemporal evolution indicated active changes in cultivated land. The geographic detector revealed a shift in influential factors from natural to economic drivers for cultivated land changes in Henan Province between 2010 and 2020. By uncovering land use disparities across regions, we contribute suggestions for sustainable development decisions regarding land use in Henan.
1. Introduction
Since the 1990s, the International Geosphere-Biosphere Programme (IGBP) and the International Human Dimensions Programme on Global Environmental Change (IHDP) have spearheaded research on land use and cover change (LUCC) at the forefront of global change studies (Zhang et al. Citation2010). The ongoing processes of industrialization and urbanization have accelerated land use changes, leading to issues, such as climate change and ecological imbalances (Chapman et al. Citation2018; Fan et al. Citation2022; Hu and Du Citation2022). Before formulating land use plans, it is essential to understand the current status and historical changes in land use while analyzing the influences of various factors, including natural, social, and economic aspects (Zhang and Zang Citation2019; Zhang et al. Citation2020). It is worth noting that administrative divisions in China are influenced by multiple factors, particularly at larger scales, such as river basins, urban clusters, and provincial levels, where land use change exhibits noticeable spatial heterogeneity (Xu and Zhu Citation2009; Fang Citation2014). By studying the differences in various subspaces within a region, a deeper understanding of local land use characteristics and driving mechanisms can be gained. This is crucial for delineating functional zones, formulating national land planning, optimizing land allocation, and achieving sustainable development decision-making (Zhao et al. Citation2010).
Scholars have conducted extensive research on land use change and its driving factors using various research methods. These studies encompass different geographical locations and spatial scales, delving into the complexity of land use change. At the national scale, Hasan et al. (Citation2023) extensively explored the drivers of land use change in Bangladesh, concluding that natural disasters, profit-seeking, and industrial progress were among the key factors driving land use change. Song and Xin (Citation2021) studied the characteristics of land use intensity differentiation in Chinese farmland, revealing a nationwide and regional expansion of land use intensity differentiation, with the exception of the central region. Pjanovic et al. (Citation2022) assessed the importance of two biophysical and five socioeconomic drivers of LUCC for six LUCC processes during the 2000–2018 period in Serbia using mixed methods, GIS, and machine learning. At the basin and urban cluster scales, Yu et al. (Citation2019) utilized geospatial information mapping to construct land use transfer maps and rise–fall potential maps, analyzing the spatiotemporal changes and development processes of land use in the Yil River basin and providing a scientific basis for the sustainable utilization of land resources and ecological construction therein. Temesgen et al. (Citation2018) used geographic information technology and a cross-sectional survey design to study land use and cover in the coastal areas of Ethiopia, revealing the driving factors of change. Wiwoho et al. (Citation2023) conducted a quantitative analysis of land use change and potential driving factors in the Bali Island basin of Indonesia. At the provincial and municipal levels, Anwar et al. (Citation2023) used logistic regression to study the trends and driving factors of land use change in the Abbottabad region of Pakistan. Ahmad and Mustafa (Citation2019) examined the land use changes in Negeri Sembilan in terms of space and time between 1961 and 2014 and explored the driving factors of land use changes to assist in decision-making processes to control land use changes and land use planning in a more systematic way and ensure environmental sustainability in the future. Kamwi and Mbidzo (Citation2022) evaluated patterns of LUCC in the Zambezi Region, Namibia, between 1984 and 2010 using geospatial tools. Mashi et al. (Citation2022) examined how stakeholders in Abuja, Nigeria, perceive drivers of LUCC and concluded that urban residents emphasize social and economic factors, while rural residents give priority to environmental factors, and the consistency of these concepts is crucial to solve LUCC. Fan et al. Citation2022) studied the temporal changes in land use in Guangzhou and their influencing factors based on geographic detectors, providing suggestions for sustainable land use planning in Guangzhou. Among the various research methods, land use change diagrams can effectively reveal the spatial structural characteristics and spatiotemporal evolution patterns of land use through different changes in graphical features and lineage structures (Yu et al. Citation2019). When modeling and analyzing driving factors, geographic detectors fully demonstrate their advantages, such as wide applicability and immunity to multicollinearity among multiple independent variables (Wang and Xu Citation2017; Lai et al. Citation2021). Geographic detectors can also quantitatively identify the interactions between factors, detect the contributions of various factors to land use change, and extract important spatial association rules from the spatiotemporal land use database, thereby exploring the spatial heterogeneity characteristics of the region (Wang et al. Citation2010; Wang and Hu Citation2012).
A comparison of research conducted at various scales makes it evident that the provincial scale plays a crucial role in the study of land use. The provincial scale serves as a key link in both reflecting regional and national land use changes and facilitating the development of cities, counties, and lower-tier regions (Zhang et al. Citation2022). Additionally, it offers an opportunity for in-depth exploration of land use trends, change patterns, and driving factors, with research outcomes closely aligned with local needs. Consequently, these findings are more likely to be embraced by local governments, driving the implementation of land management policies tailored to local demands and challenges. Factors, such as terrain, climate, population, and economic conditions may vary significantly within the same province, and most recent studies fail to fully take into account the diversity within the region, resulting in the lack of universality of research results. We propose a provincial-level regionalization that better captures the diversity of different regions and can avoid generalizing results to entire regions. Provincial-level land use change studies are a way to help gain insight into regional differences and improve land management decisions. This approach can provide valuable insights to governments, research institutions, and society to better address the challenges of land use change.
Henan Province, located in the central region of China, possesses a substantial population, abundant resources, rich historical and cultural heritage, a solid industrial foundation, and government support, earning it a pivotal position and significant potential in China’s urban cluster development strategy. It is renowned as a breadbasket and is considered one of the regions for high-quality economic development. As an agricultural powerhouse, Henan faces challenges, such as land scarcity and conflicts between land use for construction and other purposes. The province’s diverse topography, including plains, hills, basins, and mountains, has a notable influence on land utilization. In the eastern plains of the province, crop cultivation predominates, while recent years have seen the establishment of new industrial enterprises. The western mountainous and southern basin areas prioritize tourism and the preservation of forest and grassland resources, with moderate development of animal husbandry and fisheries. The central hilly regions focus on adjusting the economic value of land and developing emerging industries and urban construction. These diverse regional characteristics manifest in varying land use emphases and patterns. However, current research on land use in Henan Province primarily concentrates on overall temporal changes and spatiotemporal evolution, lacking in-depth studies on spatial differentiation characteristics and scientifically quantified driving mechanisms (Zhang et al. Citation2015; Lv et al. Citation2017; Wang Citation2018; Huang et al. Citation2023).
Therefore, this study is based on land use data from 1990, 2000, 2010, and 2020. It employs methods, such as the land use dynamics index and spatial pattern analysis to analyze differences and spatiotemporal evolution at both the provincial and subregional levels. Additionally, using the geographic detector model, it investigates the primary driving factors behind land use changes in 2010 and 2020, compares the driving mechanisms in different subregions, and examines the spatial heterogeneity characteristics of Henan Province. This research aims to provide references for sustainable development decision-making.
2. Materials and methods
2.1. Study area and data sources
2.1.1. Study area
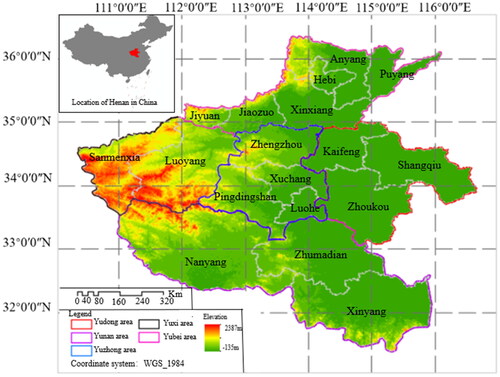
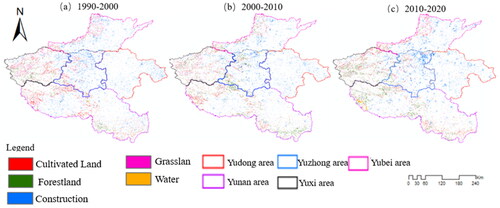
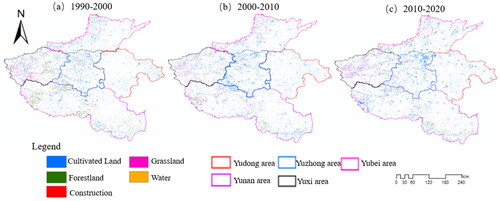
Henan Province, located in the central region of China, is bounded by latitude 31°23′–36°22′N and longitude 110°21′–116°39′E, with a total area of 1.67 × 10⁵ km2. It is situated mostly south of the Yellow River and serves as China’s transport hub connecting the east and west. In addition, Henan is the largest grain base in the country, alongside the three northeastern provinces. In 2022, Henan’s total grain production reached 135.7872 billion kg, ranking second in China. Its stable economic fundamentals have provided strong support for the protection of China’s food security, highlighting the essential role that Henan has played in ensuring the nation’s grain supply. According to the natural geographical conditions, historical evolution, level of economic and social development, and regional tourism development of Henan Province, it is divided into five subspaces: Yudong, Yuxi, Yunan, Yubei, and Yuzhong, Zhao and Zuo (Citation2018) which exhibit significant differences in terrain with a general feature of high in the west and low in the east. The western and southern areas are mostly hills and mountains, while the eastern, central, and northern areas are vast plains. These regions display significant differences in terms of land use, with cultivated land and forestland accounting for most of the province’s land use. However, since the end of the twentieth century, cultivated land has gradually transformed into construction land, exacerbating the already increasing problem of the contradictions between land supply and demand due to population growth. Therefore, this study aimed to investigate Henan Province’s unique resource conditions, current land use, economic and social development levels, and regional development strategies to understand the change patterns and characteristics of land use in the area. By conducting this research, relevant references for sustainable development decisions regarding regional land use can be provided. As of the end of 2020, Henan’s resident population reached 99.3703 million and had a gross domestic product of 549.9712 billion yuan ().
Figure 1. Geographical location and administrative division of the study area.
2.1.2. Data source and processing
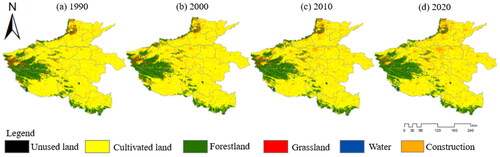
The land use data are derived from GlobeLand30, which utilizes 30-m multispectral imagery for classification. This imagery includes multispectral images from the U.S. Landsat TM5 and ETM + satellites, as well as China’s HJ-1 environmental disaster reduction satellite. In addition to multispectral imagery, a significant amount of auxiliary data and reference materials have been employed during development to support tasks, such as sample selection and classification assistance. The dataset includes nine major land cover types, namely, unused land, cultivated land, forestland, shrubland, grassland, water, wetland, glade, and impervious surface. In this study, we utilized a human–computer interactive visual interpretation method coupled with accuracy checks to extract and reclassify the land use data of Henan Province for 1990, 2000, 2010, and 2020 according to the national standard of Land Use Status Classification (GB/T21010-2007). The resulting six land use types were categorized as follows: unused land, cultivated land, forestland, grassland, water, and construction land, which were assigned codes 1–6, respectively. The digital elevation model (DEM) data were obtained from the geospatial data cloud,Footnote1 and the data product used was the ASTER GDEM V2 global digital elevation dataset officially released in 2015, with a spatial resolution of 30 m. Other data were obtained from the 2010–2021 Henan Provincial Statistical Yearbook, the statistical yearbooks of cities and towns, and national economic and social development bulletins of cities and towns, e.g. Social Development Bulletin ().
Figure 2. Land use/land cover changes in Henan Province in 1990, 2000, 2010, and 2020.
2.2. Methodology
2.2.1. Single land use dynamic attitude
Land-use dynamics refer to the alterations in the amount of a particular land-use category over a specified period within a defined geographical area and are commonly represented as follows (Liu et al. Citation2005):
(1)
(1)
where K is the dynamic attitude of a land-use type in the study period;
and
are the area of a land-use type at the beginning and end of the study period, respectively; and T denotes the time frame involved. When T is set to represent a year, K reflects the annual rate of change undergone by the land-use type under investigation.
2.2.2. Geological information mapping
Geological information mapping is a land-use mapping model based on geological analysis. This research model is capable of incorporating the spatial, process, and attribute features necessary for an in-depth understanding of land use. It not only includes information on the spatial variability of land-use status but also integrates the dynamic features of geographic processes, such as changes in land use over time. As such, it provides a comprehensive approach to studying the spatial and temporal dimensions of land-use change (Zhao and Zuo Citation2018). The construction of this mapping model is outlined below:
① Identifying the spatial units of the map. Combining the natural characteristics of the study area and the accessibility of remote sensing data, a spatial resolution of 30 × 30 m was selected as the basic spatial geographic unit for atlas analysis.
② Defining the temporal units of the map. The data from four years were selected and divided into three time periods: 1990–2000, 2000–2010, and 2010–2020.
③ Generate the land-use transfer map. ArcMap10.8 software was used to intersect the land-use data of the two periods and perform map algebraic operations with the following formula:
(2)
④ Constructing a fluctuation-based map of the main land cover types. Following the classification principle, the rising mapping was determined by identifying all areas transferred into a certain land cover type by other types, while the falling mapping corresponded to all areas transferred out of the type.
To indicate the extent of change of a particular land cover type relative to all land cover types undergoing change, we introduced the land-use change ratio as proposed by Yu et al. (Citation2019):
where is the area of the mapping unit in which the initial i land-use type changes to the final j land-use type; n is the number of land-use types; and p is the change ratio.
2.2.3. Sankey diagram visualization model
The Sankey diagram consists of node connections. Each node represents the source point of various information, and the information between nodes is represented by connecting lines. When all inflows, outflows, and stocks are accurately measured and fully considered, the balance of inflows, outflows, and stock changes at the nodes (Zhao and Zuo Citation2018) is as follows:
(4)
(4)
where
and
are node codifications, which represent the land classes in each year in this study;
and
are the areas of inflow and outflow and the stock change of the i-th node, respectively.
Numerous software and program packages are available for generating Sankey diagrams, greatly facilitating the mapping process. In this study, we employed the pyecharts function in the Python-based version of such software to depict our Sankey diagrams.
2.2.4. Geographic detector
Geographic detector, a novel statistical technique utilized for detecting spatial heterogeneity and uncovering the underlying factors responsible for it (Wang and Xu Citation2017), has been widely applied in analyzing the drivers behind land-use changes.
Factor detection
The spatial heterogeneity of the dependent variable land-use change Y was probed, as was the magnitude of the influence of driver X on the dependent variable land-use change Y (Wang and Xu Citation2017), measured by the q-value, and the expression was calculated as follows (Wang et al. Citation2010):
(5)
(5)
(6)
(6)
where q is the influence of a single factor on land-use change, q
[0, 1], and the larger the value of q is, the greater the influence of the driver on land-use change; h = 1, 2, 3 − L; L is the stratification of factor X;
and N are the sample size of a stratum and the whole region, respectively;
and
are the sum of variance of a stratum and the whole region, respectively. SSW and SST are the sum of variance within strata and total sum of squares, respectively.
2. Interaction detector
It was used to identify the interaction between different drivers and to assess the impact on Y’s explanatory power when two factors interact.
Land-use change is a complex process that results from the combined effect of the natural geographic environment, socioeconomic constraints, and human activities (Fan et al. Citation2022). Therefore, taking into account the integrated impact of both natural factors and human factors on land use, as well as the accessibility, scientific and quantitative nature of the indicators (Yang et al. Citation2022), 12 factors (refer to ) were selected for analysis from both social and natural perspectives, considering the actual situation in the study area.
Table 1. Land-use change impact factors and description.
In this study, the sampling grid size was 10 × 10 km, and the fishing net tool was used to sample the geometric center of the image element. A total of 16,759 uniformly collected sampling points were obtained. To meet the requirements of geographic detector, the data for each factor needed to be discrete. Therefore, the natural intermittent point grading method was used to classify the data into five classes. After sampling, raster data were generated based on the above indices. The raster image element values were extracted from the sampled point elements and recorded in the attribute table of the output element class. Then, geographic detector was used to calculate the analysis results of each factor on arable land and construction land in Henan Province. The impact intensity and interaction of each factor on cultivated land in Henan Province was obtained through this analysis.
3. Results
3.1. Land use dynamic characteristics
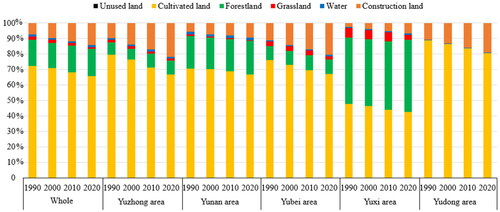
Through the analysis of land use changes in recent years in Henan Province, we found that although there was an overall reduction in cultivated land, the dynamic change rate of cultivated land remained relatively stable, with changes within the study period all being <0.4%. This is because agriculture is the dominant industry in Henan Province, and its cultivated land resources are abundant. Furthermore, the impact of agricultural demand on the changes in the area and quantity of cultivated land is relatively moderate. Therefore, even if there is a certain degree of land conversion, the utilization dynamics of cultivated land in Henan Province remain relatively stable overall, with minor changes. At the same time, Henan Province had strengthened the protection and management of land resources, taking effective measures, such as the Regulations on the Protection of Cultivated Land in Henan Province and the Work Plan for Implementing Total Grain Production Control in Henan Province to maintain the quantity and quality of cultivated land, promote ‘green development’, and prevent imbalanced and excessive development of land use ().
Figure 3. Percentage of land use types by subspace in Henan Province, 1990–2020.
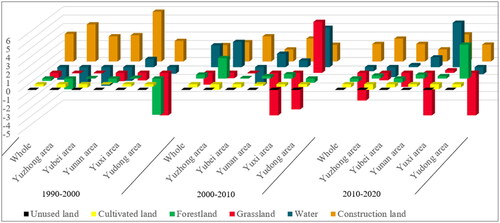
From the perspective of different subregions, the changes in construction land in the Yuxi and Yuzhong areas have relatively larger amplitudes, with a dynamics of 2.5%. Especially from 1990 to 2000, the changes in construction land in these two areas reached 4.5%. These results were linked with the progress of urbanization, an increase in economic standards, surging population concentrations, and higher demand for construction land, ultimately leading to a dramatic surge in construction land area. Unlike other regions, the Yudong area had a larger change rate in grassland and forestland, reaching 5.0%. This is because the basic areas of grassland and forestland in the Yudong region are relatively small, so even small changes can cause a relatively larger dynamic change in land use. It is worth noting that the forestland change in the Yuzhong area differed from that in the other regions, showing a trend that was first negative, then positive, and finally stabilized. This is because the Yuzhong area actively responded to the Ecological Corridor Policy. In the construction of the ecological corridor, the Yuzhong area strengthened the restoration and protection of ecosystems, such as forests and wetlands, promoted the increase in forest coverage, effectively curbed phenomena, such as deforestation and illegal occupation of forestland, and prevented the destruction of the original forestland area ().
Figure 4. Dynamic attitude of land use in Henan Province and its subspaces from 1990 to 2020.
Examining the Sankey diagram for land use type (), it was observed that the outflow of cultivated land from 1990 to 2020 was mainly directed toward construction land and forestland. This trend was largely influenced by local policies promoting forest ecosystem conservation and the restoration of farmland to forests, both aimed at enhancing the ecological environment in Henan Province in recent years. With the accelerating urbanization process, the value of land interests has consequently become more prominent, leading some farmers to transform cultivated land into real estate development land for better economic benefits. As rural populations continue to decrease and agricultural methods shift, some cultivated land may be left idle or repurposed for farming and industrialization.
Figure 5. Sankey map of land-use types in Henan Province and subspaces from 1990 to 2000.
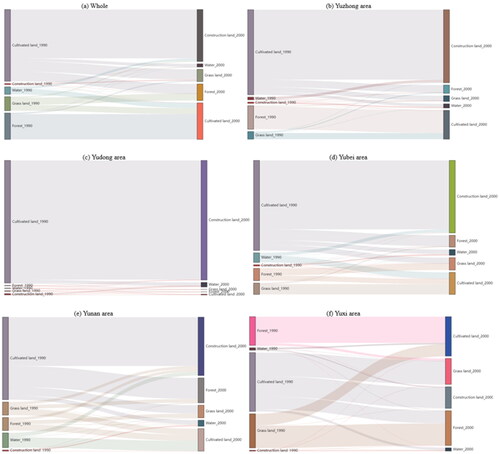
Figure 6. Sankey map of land use types in Henan Province and subspaces from 2000 to 2010.
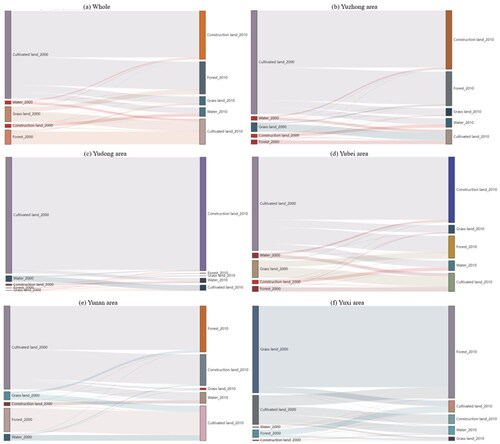
Figure 7. Sankey map of land use types in Henan Province and subspaces from 2010 to 2020.
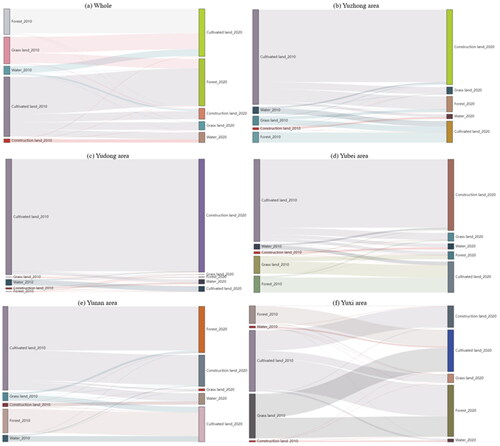
There were significant differences in the inflow and outflow of different types of land in each subspace: the main outflow of land in the Yuzhong, Yudong, and Yubei areas of Henan was farmland, while in the Yuxi and Yunan areas, the outflow of forestland accounted for a larger proportion. This is because the Yuxi and Yunan areas are also important grain-producing areas, but compared with farmland, the proportion of green land is too small, resulting in some unscientific use of land resources. For a long time, farmers used barren land and valuable forests in the mountains for economic activities, such as cultivation and crop planting. This increased the possibility of forest resource loss. At the same time, stimulated by market prices, some places engaged in illegal logging, overlogging, and illegal occupation of forestland, which also lowered the level of forest protection in the Yuxi and Yunan areas.
3.2. Rise and fall mapping analysis
3.2.1. Rise mapping analysis
In examining the mapping of the rise of Henan Province from 1990 to 2020 (), it was observed that there were differences in the changes in each subspatial land category. The Yunan area reported a larger increase in new areas of cultivated land, largely due to undulating terrain that hampers construction expansion, thereby reducing the occupation of cultivated land; moreover, the Yunan area promoted the development of ‘beautiful towns’ and has carried out land remediation and reclamation activities, which have contributed to supplementing cultivated lands to a certain extent. The Yudong area exhibited weaker increases in forestland and grassland categories, owing to its location on the North China Plain, where natural grasslands and forest constraints exist. The new construction land area in Yuzhong was larger than that of other areas because it is one of the economic centers of Henan Province, attracting a growing population influx and leading to stronger land demand. Located in the central region of China, which serves as a transportation hub for the country, its strategic location attracts more investment and construction projects, resulting in significant increases in construction land area.
Figure 8. Mapping of the rise in Henan Province, 1990–2020.
3.2.2. Fall mapping analysis
The mapping of the fall in Henan Province from 1990 to 2020 () also exhibited certain spatial heterogeneity, particularly in the shrinking water areas of the Yuzhong and Yunan regions, suggesting a complex interplay between river channel modifications and dredging and landfilling activities. However, the exacerbating factor responsible for this phenomenon was the overexploitation of groundwater resources in Yuzhong caused by resident and industrial dependence on these resources over an extended period, leading to diminished surface water resources due to falling groundwater levels. Similarly, agrochemicals, such as pesticides and chemical fertilizers continue to pollute Yunan’s water environment through backflow, negatively impacting water quality and aquatic populations while reducing watershed areas. Nevertheless, the implementation of specific policies in conjunction with the passage of time has facilitated conservation efforts aimed at preserving these critical water resources to some extent. As such, the shrinking areas reflect a downward trend, which is indicative of progress toward sustainable water use practices.
Figure 9. Mapping of the fall in Henan Province, 1990–2020.
3.3. Analysis of causal factors
Henan Province is one of China’s important grain production areas. In response to the demand for food security, both government departments and farmers naturally prioritize land utilization. The geographic detector can help us determine the degree of influence of different factors on cultivated land in Henan Province. Consequently, this study utilized a geographic detector to conduct both factor detection and interaction analysis with respect to cultivated land ().
Figure 10. Mapping of factor detection results in Henan Province in 2010 and 2020.
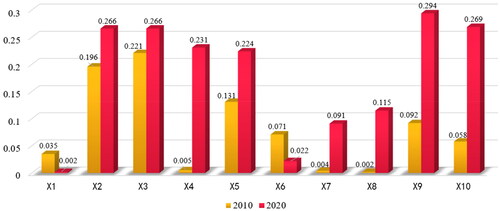
The results of factor detection analysis showed that in 2010, factors X3 (elevation), X2 (slope), and X5 (primary industry) had strong explanatory power for cultivated land in Henan Province. Slope and elevation can reflect the topography of the region, and the height difference in topography will affect the utilization and yield of cultivated land. The magnitude of the slope has a significant impact on soil erosion, where excessively steep slopes can cause severe soil loss. Primary industry can reflect the development level of agriculture, forestry, animal husbandry, and fishery, among which agriculture is the most important component, and cultivated land is the foundation of agricultural production. In 2010, the area of cultivated land in Henan Province was mainly influenced by topographical factors, agricultural, forestry, fishery factors, and economic factors. According to the factor detection analysis in 2020, factors X9 (night lighting), X10 (population density), X3 (slope), and X2 (elevation) had strong explanatory power for land use in the region, with q values exceeding 0.25. Compared with the previous time series, the explanatory power of population density was significantly stronger. Population density can reflect the population distribution and population concentration drives demand for various aspects, such as production and living, leading to increased demand for land in general.
The detected factors for changes in cultivated land exhibited spatial heterogeneity across the study area, as depicted in . Specifically, natural factors, such as X2 (elevation), X3 (slope), and X1 (precipitation) predominantly influenced cultivated land in the Yudong and Yunan areas. This was related to the geographical location of these two areas. The Funiu Mountains are located in the northwestern part of the Yunan area, while the southern part is home to the Tongbai and Dabie Mountains, which have undulating terrain. Additionally, the southern Henan region is located in an area with relatively high precipitation, which to a certain extent affects the expansion of cultivated land. The Yuzhong and Yubei areas are impacted by X5 (primary industry), exhibiting a positive response to forestland conservation policies. The Yuxi area, which is focused on central cities, such as Luoyang for tertiary industry development following the Central Plains Urban Agglomeration Development Plan, is influenced by X7 (tertiary industry), X8 (GDP per capita), and X11 (night lighting). However, the demand for construction land exacerbates the contradiction between the supply and demand of cultivated land in this region.
Figure 11. 2010 Henan Province and each subspace cultivated land factor detection q-value.
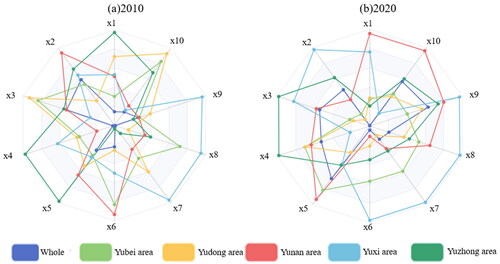
Compared with 2010, the differentiation characteristics of the driving forces in each subspace in 2020 are more considerable. Natural factors, such as X2 (elevation), X3 (slope), and X4 (slope direction) dominated the cultivated land area in the Yuzhong area. Economic factors X8 (GDP per capita) and X10 (population density) had a greater influence on cultivated land expansion in the Yunan area, and the ‘double transfer’ trend, characterized by the return of the labor force and the transfer of industries, has emerged as a new development path in China’s medium-speed economic growth context. This has led to the strengthening of the protection and development of Yunan’s historical and cultural towns, ancient towns, folk characteristic towns, and intangible cultural heritage sites, which encourages the return of the migrant labor force to start businesses and purchase houses, which will have a certain impact on the expansion of cultivated land. In the Yubei area, X8 (GDP per capita) and X5 (primary industry) were the dominant factors. From a production standpoint, the primary industry and GDP per capita represent economic development, promoting the expansion of cultivated land through the modernization of agriculture. The Yubei area established the Central Plains Agricultural Valley with the Xinxiang Plain Demonstration Zone as the center and the accelerated construction of the National Agricultural Equipment Innovation Center. This will also have a certain impact on the area of cultivated land. The explanatory power of X12 (population density), X6 (secondary industry), and X7 (tertiary industry) increased in the Yuxi and Yuzhong areas. This is attributed to the active response of the central and western regions of Henan Province to the policy of the Central Plains Urban Agglomeration Development Plan, which has formed a development pattern from the ‘Zhengzhou metropolis’ to the ‘Zhengzhou metropolitan area’. This has played a leading role in driving the development of surrounding cities. With the expansion of urban scale and rapid economic development, there is an increasing demand for land due to the growth of the population and the attraction of returning migrant workers for entrepreneurship. As a result, the area of cultivated land may undergo certain changes.
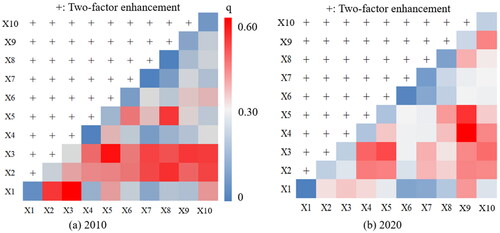
After performing interaction detection analysis on the cultivated area in Henan Province in 2010 (), it was observed that all factor combinations exhibited two-factor enhancement effects. Notably, the combination of X2 (elevation) and X3 (slope) demonstrated a higher degree of interaction than other factor combinations, with each of their q values being >0.3. This result is because the southwestern part of the study area has a higher altitude than the eastern part, leading to other factors being affected by the elevation difference. After interacting X4 (slope direction) and X8 (GDP per capita) with other factors, their q values increased from the original 0.0059 and 0.0022 to above 0.1, indicating a significant enhancement in explanatory power. This suggests that during this period, both social and natural factors affected the area of cultivated land in Henan Province. During this period, the q values of the interaction between X4 (aspect) and X8 (GDP per capita) and other factors significantly increased from the original 0.0059 and 0.0022 to above 0.1, indicating that both social and natural factors affected the cultivated land area in Henan Province. In 2020, although the interaction results of each factor showed a dual-factor enhancement effect, compared with 2010, the interaction between X2 (elevation) and X3 (slope) and other factors after being affected by human activities had weakened. This is because natural factors, such as elevation and slope have changed relatively less, while the utilization and development of cultivated land caused by other human activities may gradually change. The impact of these activities may weaken or enhance the role of factors, such as elevation and slope, and change their interactive effects with other factors, indirectly indicating that human activities in 2020 are also an important factor affecting cultivated land.
Figure 12. Interaction detection results of cultivated land area factors in Henan Province.
4. Conclusion and discussion
In this study, we investigated the spatiotemporal changes and temporal evolution of land use in Henan Province. We used geological information mapping to determine the spatiotemporal evolution of land use in various subspaces, analyzed its spatial heterogeneity, and studied the scientific and quantitative driving mechanisms of cultivated land in Henan Province using a geographic detector. The following are our main conclusions:
The main land use types in the study area were cultivated land and forests, accounting for over 85% of the total area. This was followed by construction land, water, and grassland. Grassland and forestland were more stable, with only a 1% change. Although cultivated land in Henan Province showed a shrinking trend, its large base area and enhanced land resource protection and management led to relatively stable dynamics. The change rate within the study period was <0.4%, aligning with the analysis of land use patterns in Henan Province by Wang Xiaofang. However, this author overlooked the heterogeneity of land use across different regions in Henan Province. Our study revealed that the dynamic change rate of forests and grasslands in the Yudong area reached 5.0%, driven by the smaller areas of these land types, causing even minor changes to result in relatively significant fluctuations. Construction land changes in the Yuxi and Yuzhong areas reached 4.5%. The change in forests in the Yuzhong area differed from the overall trend in the province due to its response to ecological corridor policies, displaying an initial negative trend followed by stabilization.
The primary land class transitions in the study area were mutual conversions between cultivated land and forests, as well as the conversion of cultivated land to construction land. This aligns with the analysis results of land use type shifts in Henan Province by Lv Hui. However, our subregional analysis revealed that land class conversions in the Yudong area were primarily dominated by the transformation of cultivated land to construction land. In the Yuxi area, mutual conversions between forests, cultivated land, and grassland were more frequent, with the loss of cultivated land being the smallest across all regions, indicating active responses to cultivated land protection policies. The primary land class transitions in northern Henan were the conversion of grassland to cultivated land and forests, with increasing severity of grassland loss. It is important to focus on protecting grasslands in policy formulation for the northern region.
The rise and fall maps for the three periods exhibited certain similarities, with newly added land classes mainly consisting of cultivated land, forests, and construction land, while shrinking land classes primarily included cultivated land, forests, and grassland. Comparisons highlighted significant spatial differentiation among subspaces. Regarding the rise maps, the area of newly added cultivated land in the Yunan area during 1990–2020 exceeded 1050 km2, surpassing other subspaces during the same period. This was attributed to land reclamation and rehabilitation activities in Yunan, resulting in substantial cultivated land supplementation. The upward trend in forests and grasslands in the Yudong area was relatively weak, with values smaller than those of other regions in all three periods. This was due to the location of the Yudong area in the North China Plain, which lacked favorable conditions for natural grassland and forest growth.
A geographic detector model was established to analyze the cultivated land area in Henan Province. In 2010, the influential factors for cultivated land in Henan Province were elevation, slope, and primary industry, with q-values of 0.2211, 0.1969, and 0.1314, respectively. In 2020, night lighting, population density, slope, and elevation had significant effects, all with q-values exceeding 0.25. The main influencing factors on cultivated land varied across subspaces. The Yuzhong area was affected by primary industry and slope, with q-values exceeding 0.5. The Yuxi area was primarily influenced by per capita GDP, tertiary industry, and night lighting, with significantly higher q-values compared to other regions. Interactive detection analysis of cultivated land area in Henan Province revealed a dual-factor enhancement effect at two time points.
Through comparative analysis of subspaces in Henan Province, we gained deeper insights into the local spatial characteristics and mechanisms of land use evolution, enabling targeted regional management. For regions with significant changes in construction land, such as the Yuzhong and Yuxi areas, sustainable utilization of land resources should be prioritized to prevent irreversible damage to the ecological environment caused by growth in construction land. For the Yubei area, where grassland loss is severe, grassland protection or restoration plans should be implemented, taking measures to strengthen grassland preservation and curb further losses. In the Yuxi area, where frequent conversions between forest and cultivated land occur, consideration should be given to potential changes in soil quality resulting from these conversions, which could lead to soil degradation or impoverishment.
The current study focused solely on analyzing the driving factors of the primary land category, cultivated land, in Henan Province. In the next steps, we intend to delve into the driving factors of other major land categories within Henan Province. Furthermore, we plan to extend the spatial zoning methodology that we have developed to encompass other provinces and regions, aiming to propagate this effective research approach. This expansion will aid in achieving a more comprehensive understanding of the underlying causes of land use changes in different regions. It will also provide additional insights and tools for sustainable land management and planning.
Disclosure statement
No potential conflict of interest was reported by the author(s).
Additional information
Funding
Notes
References
- Ahmad NSBN, Mustafa FB. 2019. Analysis of land use changes of Negeri Sembilan using Geographic Information System (GIS). Geogr Malay J Soc Space. 15(1):113–131.
- Anwar Z, Alam A, Elahi N, et al. 2023. Assessing the trends and drivers of land use land cover change in district Abbottabad lower Himalayan Region Pakistan. Geocarto Int. 37(25):10855–10870.
- Chapman MG, Underwood AJ, Browne MA. 2018. An assessment of the current usage of ecological engineering and reconciliation ecology in managing alterations to habitats in urban estuaries. Ecol Eng. 120(1):560–573. doi: 10.1016/j.ecoleng.2017.06.050.
- Fan S, Liu Z, Zhu B, Zhang M. 2022. Time series change and influencing factors of land use in Guangzhou city based on geodetector. Southw China J Agric Sci. 35(10):2276–2289.
- Fang C. 2014. A review of Chinese urban development policy, emerging patterns and future adjustments. Geogr Res. 33(4):674–686.
- Hasan MH, Newton IH, Chowdhury MA, Esha AA, Razzaque S, Hossain MJ. 2023. Land use land cover change and related drivers have livelihood consequences in coastal Bangladesh. Earth Syst Environ. 7(2):541–559. doi: 10.1007/s41748-023-00339-z.
- Hu M, Du S. 2022. Forty years’ progress and challenges of remote sensing in national land survey. J Geo-Inf Sci. 24(4):597–616.
- Huang J, Hua X, Jia M, Yue S. 2023. Temporal and spatial characteristics of dominant transformation of cultivated land use in Henan Province from 2000 to 2020. Bull Soil Water Conserv. 43(1):1–8.
- Kamwi JM, Mbidzo M. 2022. Impact of land use and land cover changes on landscape structure in the dry lands of Southern Africa: a case of the Zambezi Region, Namibia. GeoJournal. 2022(1):87.
- Lai G, Hu B, Li M, Lin S, Deng Y. 2021. Dynamic changes of ecological-living-production land and geographical detect of their driving forces in southwest Guangxi-Beibu Gulf Zone. Res Soil Water Conserv. 28(4):236–243.
- Liu J, Liu M, Tian H, Zhuang D, Zhang Z, Zhang W, Tang X, Deng X. 2005. Spatial and temporal patterns of China’s cropland during 1990–2000: analysis based on Landsat TM data. Rem Sens Environ. 98(4):442–456. doi: 10.1016/j.rse.2005.08.012.
- Lv H, Guo X, Zhao W. 2017. Characteristics and spatial pattern of land use change in Henan province. Chinese J Agric Resour Reg Plan. 38(7):142–145.
- Mashi SA, Inkani AI, Sani S. 2022. Assessment of stakeholders’ perceptions of landuse/landcover change drivers in Abuja, Nigeria. Geogr Res. 5(2):44–50.
- Pjanovic B, Dabovic T, Dordevic T, Djordjevic D. 2022. Assessment of the importance of the importance of the drivers of land-use/land-cover changes on the national level: the case of Serbia. Fresenius Environ Bull. 31(9):9741–9754.
- Song H, Xin L. 2021. Differentiation characteristics and influencing factors of cultivated land use intensity in China. Trans Chinese Soc Agric Eng. 37(16):212–222.
- Temesgen H, Wu W, Legesse A, Yirsaw E, Bekele B. 2018. Landscape-based upstream-downstream prevalence of land-use/cover change drivers in southeastern rift escarpment of Ethiopia. Environ Monit Assess. 190(3):166.
- Wang F. 2018. Study on land use change characteristics in Hennan Province based on ArcGIS software. Chinese J Agric Resour Reg Plan. 39(1):92–98.
- Wang J, Hu Y. 2012. Environmental health risk detection with GeogDetector. Environ Modell Softw. 33:114–115. doi: 10.1016/j.envsoft.2012.01.015.
- Wang J, Xu C. 2017. Geodetector: principle and prospective. Acta Geogr Sin. 72(1):116–134.
- Wang J‐F, Li X‐H, Christakos G, Liao Y‐L, Zhang T, Gu X, Zheng X‐Y. 2010. Geographical detectors-based health risk assessment and its application in the neural tube defects study of the Heshun region, China. Int J Geogr Inform Sci. 24(1):107–127. doi: 10.1080/13658810802443457.
- Wiwoho BS, Phinn S, McIntyre N. 2023. Two decades of land-use dynamics in an urbanizing tropical watershed: understanding the patterns and drivers. ISPRS Int J Geo-Inf. 12(3):92. doi: 10.3390/ijgi12030092.
- Xu Z, Zhu N. 2009. City size distribution in China: are large cities dominant. Urb Stud. 46(10):2159–2185.
- Yang L, Zhang J, Gong E. 2022. Analysis of spatio-temporal land-use patterns and the driving forces in Xi’an City using GEE and multi-source data. Trans Chinese Soc Agric Eng. 38(2):279–288.
- Yu Y, Li Z, Lin J, Liu J, Wang S. 2019. TUPU characteristics of spatiotemporal variation for land use in the Yihe River Basin. J Nat Resour. 34(5):975–988. doi: 10.31497/zrzyxb.20190506.
- Zhang J, Zang C. 2019. Spatial and temporal variability characteristics and driving mechanisms of land use in the Southeastern Ricer Basin from 1990 to 2015. Acta Ecol Sin. 39(24):9339–9350.
- Zhang Q, Luo B, Huang J. 2022. Exploring strategies for improving quality in small city road system planning and design: a case study of Yinan County. Small Town Constr. 40(6):39–48.
- Zhang X, Kang T, Wang H, Sun Y. 2010. Analysis on spatial structure of landuse change based on remote sensing and geographical information system. Int J Appl Earth Obs Geoinf. 12(2):S145–S150. doi: 10.1016/j.jag.2010.04.011.
- Zhang X, Li A, Nan X, Lei G, Wang C. 2020. Multi-scenario simulation of land use change along China-Pakistan Economic Corridor through coupling FLUS model with SD model. J Geo-Inf Sci. 22(12):2393–2409.
- Zhang Y, Cheng W, Liu H, Cao Y. 2015. Analysis on changes in land use structure in Henan Province from 2005 to 2010. Res Soil Water Conserv. 22(2):258–263.
- Zhao J, Zuo S. 2018. Study on spatial distribution characteristics and mechanism of tourist attractions above 4A grade in Henan Province. West Forum Econ Manag. 29(5):58–65.
- Zhao R, Huang X, Zhong T, Xu H. 2010. Application of clustering analysis to land use zoning of coastal region in Jiangsu Province. Trans CSAE. 26(6):310–314.