
Abstract
Groundwater contamination is a serious health problem affected by land use/land cover (LULC) changes. Therefore, this study aims to investigate the impacts of LULC on groundwater levels and quality in the Emirate of Abu Dhabi over the past two decades. Two sets of Landsat images were used to classify LULC using the random forest (RF) classifier, while an image-different tool was used to monitor changes in LULC from 2000 to 2020. After that, a spatial analysis was performed by comparing LULC maps against the hydrological maps. The results show a rapid increase in all LULC classes, whereas the groundwater level has depleted by 40 m. The results also show that the area of high-water quality across the study area was reduced by 479 km2 (0.79%). The results reveal significant hydrological changes in response to rapid urbanization.
1. Introduction
Land use Land cover classes (LULC) represent the artificially and naturally distributed features on the earth’s surface. These include farmlands, built-up and water bodies. Rapid changes in land use/land cover (LULC) are the most important anthropologic interventions and affect groundwater quantity and quality as well as recharge and runoff (Wang et al. Citation2019). Intensive expansion of agricultural and industrial activities has a direct impact on groundwater quantity and quality. Additionally, intensive urbanization which creates impervious surfaces such as roads and roofs can decrease the infiltration rate and, thus, the volume of groundwater recharge (Mojid et al. Citation2019). Studying this spatial relationship using geophysical and field observation is timely and economically consuming, especially when applied on a regional scale. However, remote sensing data have been approved to be an excellent tool for monitoring land use land cover changes and mapping sources of groundwater contamination over a regional scale with low-cost and time-consuming manners.
Several studies have illustrated how intensive urbanization has led to a sharp decline in groundwater level and quality in space and time (Adhikari et al. Citation2020; Ghimire et al. Citation2021; Elmahdy et al. Citation2021). In turn, the sharp depletion in groundwater level has led to seawater intrusion, especially in the coastal areas (Elmahdy and Mohamed Citation2014). Such type of diverse behaviours makes investigating the impact of rapid LULC changes on groundwater level and quality as well as the hydrological process in an arid region challenging. Hence, studying and investigating the response of groundwater to the rapid change in LULC is needed to properly manage this resource. Some seasonal LULC changes are mostly related to the spatial changes in vegetation and water body as a response to the annual cycle of climate and associated characteristics (Vogelmann et al. Citation2016; Elmahdy and Mohamed Citation2016). Seasonal changes have been observed to be affected on groundwater infiltration processes and groundwater level fluctuates (Kirimi et al. Citation2018).
Groundwater quality in the Emirate of Abu Dhabi is mainly determined by both natural processes dissolution and precipitation of minerals, groundwater velocity, quality of recharge waters and interaction with other types of water aquifers) and anthropogenic activities (Al Asam Citation1996; Mohamed et al. Citation2010).
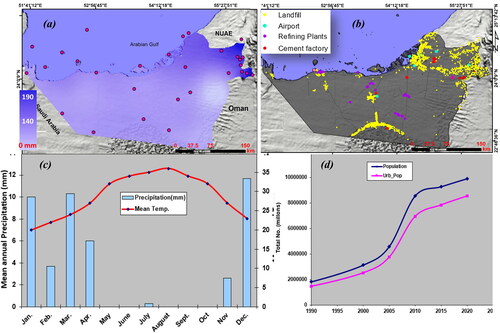
Waste from human activities in residential, commercial, industrial and agricultural areas can seriously affect groundwater quality (Brook and Dawoud Citation2005) (). These contaminants may influence groundwater from land surface activities such as industrial waste storage or spills, from subsurface sources, but above the water table, such as septic tanks and from structures beneath the water table, such as wells, or from contaminated recharge from the shallow aquifers (Alsharhan et al. Citation2002). There are estimated to be over 15 thousand septic tanks, oil pipelines and storage buried in the United Arab Emirates (UAE).
Table 1. Sources of groundwater contamination in the study area (Brook and Dawoud Citation2005).
The scarcity of rainfall and high evaporation rate have led to dramatic depletion in groundwater in the UAE, including the Emirate of Abu Dhabi (Al Nuaimi Citation2003; Al-Hogaraty et al. Citation2008; Elmahdy and Mohamed Citation2014). Furthermore, the Emirate of Abu Dhabi has intensive urbanization and agricultural activity and population growth that impose a negative impact on groundwater quantity and quality. Studying this spatial relationship using geophysical and field observation is timely and economically consuming, especially when applied on a regional scale. However, integration of remote sensing hydrological data has been approved to be an excellent tool for the investigating the impact of land use land cover changes on groundwater table and quality over a regional scale with low-cost and time-consuming manners.
Although several attempts around the world have been made previously to monitor LULC changes and investigate their impact on groundwater quantity and quality, limited numbers of studies have been applied to this issue over a regional scale. In fields such as water resources management and hydrohazard in arid regions, as results are urgently required, especially when insufficient data and funds availability. Hence, more research is needed to investigate the impacts of LULC on groundwater level and quality. The main aim of this study it to monitor LULC changes and investigate their impacts on groundwater level and quality over a regional scale in the Emirate of Abu Dhabi, UAE between 2000 to 2020. To achieve this aim, an integrated approach was modified to index the irrigation water quality across the study area. In doing this, the specific aims are to (i) map, classify and monitor LULC changes using Landsat images with a spatial resolution of 30 m and random forest (RF) classifier, (ii) analyze the spatial relationship between built-up and vegetation areas and groundwater level and quality over space and time, (iii) investigate the impacts of LULC changes on groundwater level and quality, and (iv) assess the irrigation water quality across the study area. The main findings of this study will be of great help and useful for urban planners, hydrologists and agricultural engineers
2. Study area
2.1. Geography and geomorphology
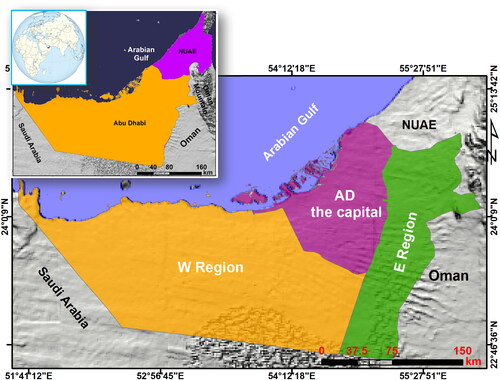
The study area is stretched from E 51° 40′ 09″ and E 55° 33′ 51″ to N 22° 45′ 36″ N 25° 14′ 42″. The Emirate is bound to the east by the Sultanate of Oman and to the south by Saudi Arabia, extends from the Oman Mountains in the east and Arabian Gulf in the west and occupies an area of about 59,863.253 km2 (82%) (). Geomorphologically, the region is characterized by four geomorphological features: (1) mountains of exposed bedrock; (2) piedmonts, alluvial plains and piedmonts related to ephemeral streams on the western flank of the Oman Mountains; (3) a wide alluvial plain and valley near Al-Ain urban area and (4) a nearly continuous expanse of aeolian sand and associated dune landforms divided into northern and southern dunes area (). The terrain slopes gently with elevation ranging from 1,200 to 200 m above sea level and is covered by a gravel plain of Al Jaww plain in the east and Sabkha in the west. Between them, the sand dune that is interrupted by isolated hills of carbonate rocks in the middle, north and east.
Figure 1. The main divisions and regions of the United Arab Emirates(a) and the Emirate of Abu Dhabi.
2.2. Climatology and hydrology
Rainfall is highly variable in time and space (). Most of the rainfall in winter occurs as a result of convergence zones caused by an upper level through to the west of the Gulf area. Short, heavy rainfall produces the best opportunities for aquifer recharge. The total annual rainfall in the UAE ranges from 700 to 1480 mm3 () and the total surface water is estimated to be about 39.6 billion gallons/year and annual recharge ranges from 21.8 to 32.7 mm3 (Khalifa 1995; Al-Rashed and Sherif Citation2000). Runoff occurs in the non-vegetated Oman Mountains and collects in wadis which drain into the U.A.E, eventually recharging the shallow alluvial gravel aquifers (Al-Rashed and Sherif Citation2000; Brook and Dawoud Citation2005).
Figure 2. Maps of the spatial distribution of precipitation (a), sources of groundwater contamination (b), graphs of monthly temperature and precipitation (c), and population growth (d) over the Emirate of Abu Dhabi.
The hydrological framework in Abu Dhabi comprises four hydrological units (UAEU 1998): (1) the carbonate aquifer in the east, (2) the sand dune aquifer in the middle, (3) the western gravel aquifer in the east, and (4) the coastal aquifer in the west. Each aquifer has its own hydrologic and physical characteristics. They are characterized by heterogeneity in porosity, thickness and groundwater quality (Khalifa 1995). For example, the thickness of the aquifers varies from 5 m near the shoreline to 38 m at Liwa Oasis under the influence of fault displacements and folding (Khalifa 1995; Brook and Dawoud Citation2005). Hydrologically, the region is drained by westward dry valleys (Wadi courses) onto the adjacent piedmonts (Huang et al. 2010).
The water-bearing formations of the study area are mainly composed of alluvial deposits in the uppermost part, underlain by clay, gypsum, limestone and marl lithofacies (Khalifa 1995). The groundwater level in the study area varies from 5.71 to 60.94 m below ground level (Elmahdy and Mohamed Citation2014a). The shallow aquifer of the Emirate of Abu Dhabi and its adjoining areas is unconsolidated and is susceptible to contamination from surface rocks and land development (Al Asam Citation1996).
In the capital of Abu Dhabi and the eastern regions of the Emirate of Abu Dhabi, the shallow aquifer is recharged from the mountainous areas and hills, by the infiltration of the precipitation in the gravel plain and sand dune (Al Nuaimi Citation2003), and by upward vertical recharge from deeper rocks and infiltration of water lost from the leaky water transmission lines (Elmahdy and Mohamed Citation2014).
The use of groundwater in the eastern region is higher compared to other regions of the Emirate of Abu Dhabi (Mohamed et al. Citation2010; Elmahdy and Mohamed Citation2015; Elmahday et al. Citation2022). However, this valuable resource has experienced overexploitation and pollution in the entire region. Particularly during the last decades, the United Arab Emirates including the study area have a sharp decline in the groundwater table in most of the groundwater wells in the study area showing depletion trends, and threatening the sustainability of irrigation use (Brook and Dawoud Citation2005).
Recently, (Al Tenaiji et al. Citation2021) reported that the groundwater level in the study area dropped down by almost 5-7 m between 1998 and 2016 and inferred those intensive agricultural activities were a significant factor in the groundwater table depletion. Elmahdy et al. (Citation2021) examined the impact of land use land cover changes on groundwater level and quality between 1990 to 2018 in the Northern Emirates, UAE. They found that the impact was significant at regional and local scales. They identified land use land cover changes due to rapid urbanization and population growth are the most influencing factors for groundwater table depletion (). Various activities connected to urbanization and industrial development result in effluent disposal, which introduce into groundwater system high concentrations of trace metals (Brook and Dawoud Citation2005). The concentrations of nitrate and sulfate increase notably as a result of the vast amount of chemical fertilizers used in agriculture (Al Nuaimi Citation2003; Murad et al. 2012). Average groundwater salinity and electrical conductivity are generally increased from the east to the west.
3. Datasets and pre-processing
3.1. Datasets
Three different datasets () were used in this study: (i) The Shuttle Radar Topography Mission (SRTM) with a spatial resolution of (30 m), (ii) a set of multitemporal Landsat images with a spatial resolution of 30 m (iii) a single of QuickBird image with a spatial resolution of 0.6 m, and (v) a set of spatiotemporal hydrological information (2000 and 2020) collected from groundwater wells. The Shuttle Radar Topography Mission (SRTM) obtained elevation data on a near-global scale to generate the most complete high-resolution digital topographic database of Earth. SRTM consisted of a specially modified radar system that flew onboard the Space Shuttle Endeavour during an 11-day mission in February of 2000 (www2.jpl.nasa.gov/srtm).
Table 2. Data layers and data type used in groundwater potential index.
The new version of SRTM DEMs with a spatial resolution of 30 m (version3 http://srtm.csi.cgiar.org/Index.asp) is the result of interpolation efforts of the un-edited SRTM DEM version 2. The SRTM DEM indicates slope gradient, terrain configuration, and the drainage pattern. The second dataset was the Landsat Enhanced Thematic Mapper (ETM+) acquired on 23th August 2000 and the Operational Landsat Imager (OLI) Landsat 8 acquired on 15th August 2020 (Path 160, rows 42 and 43). All Landsat images were downloaded for the same month with less than 5% cloud coverage for reducing errors and ensuring a better classification accuracy (Foody Citation2002; Foody and Mathur Citation2006; Elmahdy and Mohamed Citation2018). We used Landsat images from 2000 to 2020 because of the bad quality, low coverage, coarse spatial resolution, and poor availability during the period from 1972 to 1989 (Holben, 1986; Wulder et al. Citation2008; Kesgin, and Nurlu Citation2009; Vogelmann et al. Citation2016; Elmahdy and Mohamed Citation2018; Elmahdy et al. Citation2020a; Elmahdy et al. Citation2022). These datasets were the most appropriate remote sensing data to map and monitor changes in LULC and were used widely in the literature (Holben, 1986; Wulder et al. Citation2008; Kesgin, and Nurlu Citation2009; Vogelmann et al. Citation2016; Elmahdy and Mohamed Citation2018; Elmahdy et al. Citation2020a). The third dataset was a single of QuickBird image with a spatial resolution of 0.6 m acquired on 21th August 2020 (). The latter dataset was employed to collect the training datasets or regions of interest (ROIs). The third dataset was hydrological information collected from 54 groundwater wells distributed across the study area.
3.2. Data preprocessing
As a first step of preprocessing, all layers were stacked, and the images were re-projected to UTM datum WGS zone N 40 and registered as an image to image with an RMSE of less than 0.6 followed by an atmospheric correction (Holben 1986). For ensuring better classification accuracy, atmospheric correction was performed. The atmospheric correction was performed by Fast Line-of-sight Atmospheric Analysis of Hypercubes (FLAASH) implemented in Envi v. 4.6 software. This process consists of radiometric calibration and dark subtraction. In radiometric calibration, beta nought calibration, all DN values were converted into the top of atmosphere (TOA), reflectance.
TOA was performed using four parameters, namely calibration type (reflectance), output interleave (BSQ), output data type (float), and scale factor value of 1. In dark object subtraction, TOA was converted into surface reflectance (SR) using band minimum.
4. Methods
The methods of this study can be summarized in the following steps: (i) image classification, (ii) monitoring LULC changes, (iii) spatial analysis, and (iv) investigate the impacts of LULC change on groundwater level and quality.
4.1. Image classification
4.1.1. Training and sampling
The training sampling is a very important step in producing a higher-quality of classification, especially when the classifiers are trained using training datasets with higher spatial resolutions (Elmahdy and Mohamed Citation2018). To identify the endmembers of pure LULC classes in the training samples, the hourglass analysis method was performed. The training datasets were collected from QuickBird images with a spatial resolution of 0.6 m (August 2020) using a straight random sampling or proportional method, which reduces error and bias. This method divides the population into homogenous groups and produces training sample sizes that are directly related to the size of the classes. We used this method due to its ability to reduce bias and errors (Van Niel et 207 al., 2005; Elmahdy and Mohamed Citation2018).
Random sampling collection was performed using Envi v. 4.5 software. The frequency of collected samples was related to the 30 m pixel size of Landsat images and varied according to the spatial distribution of built-up area vegetation areas. The number of collected samples was 5-7 per pixel for a total of 3 land cover classes, built-up area, vegetation and bare land. The collected samples were reviewed using visual inspection and field observation where the authors live.
4.1.2. LULC classification
To precisely map and monitor changes in LULC, it is important to employ a precise classifier. Among several classifiers (e.g. decision tree-based classifiers comprising of gradient tree boosting (GTB), support vector machine (SVM), logistic model tree (LMT), the classification and regression tree (CART) and Support Vector Machine (SVM) and multilayer perceptron neural networks (MLP-ANN)), random forest (RF) has shown to be the best classifier with an overall average accuracy of 92.8% with more than 2% comparing the other classifiers (Chen et al. Citation2017; Ouma et al. Citation2023). Interestingly, they have been applied to the Landsat data from 1984 to 2020 at 5-year intervals.
The random forest (RF) classifier is a supervised ensemble machine learning algorithm that can be employed for both classification and regression tasks producing an accurate result most of the time because of its simplicity (Breiman Citation2001). It is a modified version of bagging that creates a large collection of decorrelated trees before calculating the average. It averages several noisy and therefore minimizes the variance. The algorithm creates a forest and makes it randomly, then uses random binary trees which exploit a subset of the observations via bootstrapping methods. Through bootstrapping, random samples of the training data are selected and utilized to build the model as the following steps:
Draw a bootstrap sample Z∗ of size N from the training data.
Grow the random-forest tree Tb from the bootstrapped data, by recursively repeating the following steps for each terminal node of the tree, until the minimum node size nmin is reached.
Select m variables at random from the p variables.
Pick the best variable/split-point among the m variables.
Split the node into two daughter nodes
In this study, two parameters are required to be adjusted. These are the number of variables (mtry) and the number of trees (ntree). The best values of mtry and ntree are obtained based on the lowest Out-of-Bag (OOB) errors. In this study, the RF package running in R (CRAN) proposed by Liaw and Wiener was used to classify LULC. During the classification process, the two parameters of ntree and mtry were evaluated their influence on classification performances using input spectral data bands within training samples. The ntree and mtry parameters by default of 500 trees and mtry of 2 respectively were put in the function plot(modelRF) to find the most suitable tree (ntree) based on OOB error rate (Liaw and Wiener Citation2002).
The built-up areas in the produced LULC maps were then sub-classified into residential and industrial areas, while the vegetation class was subclassified into farmland and garden/park. The subclassification was performed based on the field observation and knowledge of the authors. Finally, a statical analysis was perfumed to calculate the total areas (in km2) of each LULC class using zonal statistical tools implemented in ArcMap v. 9.2 software.
4.3. Accuracy assessment
The accuracy assessment of the produced LULC maps was performed based on three methods. First, the textural features from the Landsat image (23 August 2020) maps were compared against those from Sentinel-2 images (13th August 2020) with a spatial resolution of 10 m. Second, an accuracy assessment was performed using a confusion matrix implemented in Envi. v. 4.5 software. The confusion matrixes were built using regions of interest (ROIs) collected QuickBird images (23 August 2020). These training datasets were divided into three different training data by the subtracting training dataset of 2000 from 2020. After that, a kappa, user’s and producer’s accuracy were then calculated and kappa analysis was analyzed (Congalton and Mead, Citation1983; Congalton, Citation1991; Jensen et al. Citation1996; Foody Citation2002; Elmahdy and Mohamed Citation2023).
The Kappa index was employed to demonstrate the agreement level between the reference and the obtained LULC maps.
4.4. Monitoring LULC changes
To monitor LULC changes, the obtained LULC maps were used. Monitoring changes were performed using the change detection tool implemented in the Envi v. 4.5 software. The tool subtracts the initial state image (2000) from the final image (2020). The negative changes correspond to the last (n/2) classes, while the positive values correspond to the first (2/n) classes. The no-change class (n/2 + 1) corresponds to the middle class. Finally, the total area in km2 of each LULC class was calculated by converting the raster to vector tool implemented in the Envi. 4.5 software.
4.5. The impacts of LULC changes on groundwater level
As a first step, a set of multi-temporal maps (2000 and 2020) of groundwater table, nitrate (NO3), total dissolved salts (TDS), electrical conductivity (EC), and irrigation water quality index (IWQI) were constructed. These maps were constructed from hydrological information collected from groundwater wells using the inverse distance weighted (IDW) algorithm implemented in ArcGIS v. 10.5 software. The interpolator calculates the values of points based on a weighted combination of a group of the chosen points and considers the points closer to each other than those distant points. The IDW was chosen due to its simplicity, easiness to understand, intuition, and efficiency (Van Niel et al. Citation2005; Congalton Citation2004; Jensen et al. Citation1996; Lu et al. Citation2011; Setianto & Triandini Citation2015).
To spatially correlate and uncover the relationship between changes in LULC and groundwater level and quality, two methods were performed. In the first method, the maps of groundwater level and parameters (NO3 and TDS) were superimposed on the LULC maps and visual inspection was performed. In the second method, as an example, semivariogram models in four directions (NE-SW, NW-SE, N-S and E-W) were created from raster maps of 2020 LULC and TDS. After that, these various maps were imported into a GIS environment and semivariogram models were generated. Finally, the total area and its percentage for each hydrological class on the interpolated groundwater level, NO3, and TDS maps were calculated using the raster calculator tool implemented in ArcMap v.10 software.
5. Results and discussion
5.1. Accuracy assessment
Visual inspection shows that there is confusion between building shadows and wetlands and vegetation, as has been observed in the LULC maps. Building shadows and wetlands have similar spectral signatures. Another confusion was reported between the spectral signature of the built-up area and that of coastal sabkha. There are no artificial water bodies such as fountains and swimming pools within the residential areas, which were misclassified.
The maps of LULC produced from the Landsat images using the RF classifier and their accuracy are shown in . The maps show a significant change in LULC across the Emirate of Abu Dhabi during the period from 2000 to 2020. The Kappa coefficients of the produced 2000 and 2020 LULC maps were 0.812 and 0.916 and overall accuracy of 91.35% and 95.15%, respectively (). These values (over 0.8) are strongly reflecting adequality accuracy (Wen et al. Citation2019). It is noted that the LULC map of 2020 is much better and more accurate maps than in 2000 LULC map. This slight difference spears to be due to the technical differences such as sensitivity and lifetime and enhanced signal-to-noise of the sensor detectors of the sensors (Brook and Dawoud Citation2005; Elmahdy and Mohamed Citation2014a,b; Elmahdy and Mohamed Citation2018).
Table 3. Confusion matrix of the year 2000 and 2020 classification map.
5.2. Spatiotemporal monitoring and analyzing of LULC
The obtained LULC maps demonstrate that built-up and vegetation areas are concentrated in the island of Abu Dhabi and its adjoining coastal area, along main roads (Abu Dhabi-Al Ain highway), sand dune corridors and around the Oases such as Al Ain in the east (alluvial plain) and Liwa further south (sand dune corridors) (). In general, the built-up and vegetated areas clustered in the coastal and inland areas. The first spot occupies the island of Abu Dhabi and its adjoining coastal area. The second one occupies the alluvial plain of Al Ain at the foot of Oman and the Hafeet Mountains. Between them, there is a strip of small villages (e.g. Al Khazna, Abu Samrah and Remah) that distribute in farmland areas with a length of about 110 km. Other slight built-up and vegetated areas were also observed to be distributed in the inland sand dune and coastal areas. They were in Al Wagan (east), Liwa (south) and Al Rewies (west\) villages. However, some portions of small buildings and roads cannot be discriminated and were misclassified due to the pixel size, moderate spatial resolution, and intensive vegetation cover in a built-up area. Both sensors fail to discriminate building and vegetation types and revealed an increase in built-up and vegetation areas.
Figure 3. Spatiotemporal variation of built-up area (a), vegetation area (b) during 2000-2020, and types of buildings (c), and vegetations (d).
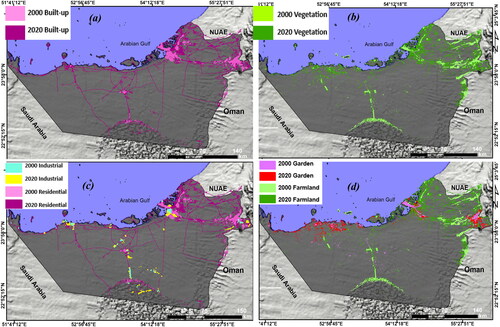
shows the changes in the area between LULC maps between 2000 and 2020. In 2000, the estimated built-up area covered 422.517 km2 (7%), while the vegetation area was 104.322 km2 (1.7%). In 2020, there is a sharp increase in the built-up and the vegetation areas. The estimated built-up area covered 865.755 km2 (14.46%), while the vegetation area covered 1,665.944 km2 (27.82%). shows the changes (km2) in LULC from 2000 to 2020 and it appears that there is a positive and rapid increase in all LULC classes ( and ). The highest changes were observed in built-up and vegetation areas in the capital of Abu Dhabi and the eastern regions compared to those in the western region. In total, the residential area increased from 304.83 km2 (0.50%) in 2000 to 683.702 km2 (1.14%), while the total area of industrial area increased from 86.342 km2 in 2000 to 150.586 km2 (0.25%) in 2020. The garden/park area increased from 106.645 km2 (0.17%) to 279.345 km2 (0.46%), while the farmland area increased from 418.39 km2 (0.69%) in 2000 to 1387.223 km2 (2.31%) ( and ).
Figure 4. The graphical representation of the total area in km2 of built-up and vegetated area changes from 2000 to 2020.
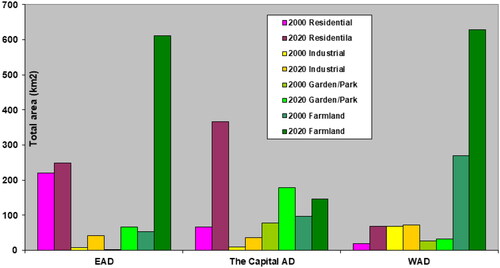
Table 4. LULC change detection analysis in Dubai for the years 2000–2020.
From 2000 to 2020, in the capital of Abu Dhabi, two expansions were observed in the adjoining small islands and coastal and inland sand dune areas (east). In the offshore area, Abu Dhabi Island, Yas Island, and Al Saadiyat Island, Al Reem Island were developed and constructed in the Capital of Abu Dhabi occupying an area of about 4549 km2. In the onshore area, two expansions in the residential and industrial areas were observed: the first one in the east and southwest directions, while the second one in the northeast direction. Over 20 years, the residential area increased by 378.87 km2 (0.63%), while the industrial area increased by 64.24 km2 (0.10%). Similarly, the garden/park area increased by 174.7 km2 (0.29%), while the farmland area increased by 968.83 km2 (1.61%).
The reason for the increase in the built-up areas and population could be a rapid commercial leap of the Emirate of Dubai, while the sharp increase in the vegetated areas may be due to an increase in the total areas of gardens and golf clubs, which are distributed in the Emirate of Abu Dhabi (Elmahdy and Mohmed 2022). From the above results, it is clear that rapid population growth and land development with a significant increase in gardens, and parks have led to the excessive use of groundwater, and caused extensive changes to groundwater conditions (Elmahdy and Mohamed Citation2014). Additionally, these changes have increased the probability of the occurrence of environmental issues in the next decades, which is consistent with Elmahdy and Mohamed (Citation2018). They concluded that agricultural cover decreased compared with parks and gardens from 2000 to 2020. This may be due to groundwater level depletion as a response to rainfall scarcity.
5.3. The impacts of LULC changes on groundwater level
The map of groundwater level constructed by interpolating hydrological information collected from groundwater wells across the study area are shown in . The maps show a spatial variation in groundwater level over space and time across the study area. The maps demonstrate that the groundwater level has sharply depleted over the 20 years and the depth to groundwater level ranges from −5 m in the coastal areas in the west to about 40 m in the city of Al Ain and its adjoining areas with an annual average of groundwater level decline of 1.5 m. The drop-down in groundwater level was high in the summer season (June, July, August and September), especially in the farmland areas such as Liwa, Al Khaznah, Remah and Abu Samra (). Within these areas, the groundwater level was depleted and some groundwater wells have gone dry in response to over-pumping (Brook and Dawoud Citation2005).
Figure 5. Regional spatial distribution of the groundwater level depletion (in m) (up), and nitrate concentration (mg/L) (down) in the Emirate of Abu Dhabi from 2000 to 2020.
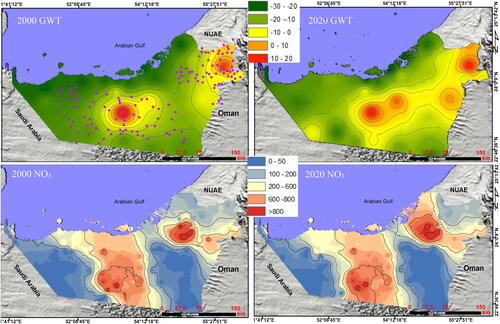
As shown in , some cones of depressions in groundwater level have been developed during the period from 2000 to 2020. This was caused by population growth, climate change and the scarcity of precipitation as well as LULC changes, especially the expansion of built-up area (). The rapid increase in building roofs (more than double) lowered the infiltration rate, increased runoff the water balance and, thus, groundwater level depletion. The areas affected by groundwater depletion increased from 13,067.79 km2 in 2000 to 25,254.712 km2 (70.41%) in 2020. Similarly, Elmahdy et al. (Citation2020) found a similar drop-down in groundwater level in the northern part of the United Arab Emirates. Contrarily, a significant rise in groundwater level was observed in the city of Al Ain city, even under the impacts of urbanization (). This anomaly appears to be due to quick rainwater infiltration in the surficial alluvial aquifer with a lower infiltration into the deep aquifer. Furthermore, there are several anthropogenic sources of groundwater recharge such as extensive irrigation and gardening activities (GTZ, estimate for 2008). The reported irrigation return flow is on average 25% of the total amount of groundwater application increasing the groundwater recharge and raising the groundwater level (Sherif and Singh Citation1999; Brook and Dawoud Citation2005; Elmahdy and Mohamed Citation2014a,b). Furthermore, irrigation practices using Falaj and flood irrigation are predominant at many of the date oases within the city.
5.4. The impact of LULC changes on groundwater quality
show spatiotemporal variation in NO3 consecration in groundwater across the entire area from 2000 to 2020. The area contaminated by NO3 increased from about 9,127.23 km2 (15.24%) in 2000 to 17,783.21 km2 (29.7%) in 2020 (). It is observed that there was a significant increase in NO3 concentration in groundwater over space and time from the Oman mountains to the coastal areas in the west and from Liwa Oasis in the south to the coastal area in the west. Large portions of the sand dunes and the alluvial aquifers were observed to be affected by NO3 contamination. The reason for that could be the intensive use of fertilization in farmland areas such as Al Kahznah, Remah, Abu Samrah and Liwa oasis (Qin et al. Citation2013). This indicates that nitrate contamination of groundwater in irrigated agricultural land is the main concern in arid and semi-arid regions (Elmahdy and Mohamed Citation2015; Elmahdy and Mohamed Citation2016).
illustrates an increase in groundwater salinity and TDS concentration in groundwater across the study area and ranging from 10000 at the foot of the mountainous areas in the east and Liwa Oasis in the south to more than 60,000 mg/l at the coastal areas. A higher concentration in salinity and TDS occur along the coastal area and the southeastern part of the study area. From 2000 to 2020, the total area influenced by TDS pollutants increased from 11,165.34 km2 (18.65%) in 2000 to 27,548.28 km2 (46%) in 2020.
Figure 6. Regional spatial distribution of groundwater salinity (mg/L) (up), and TDS concentration (mg/L) (down) in the Emirate of Abu Dhabi from 2000 to 2020.
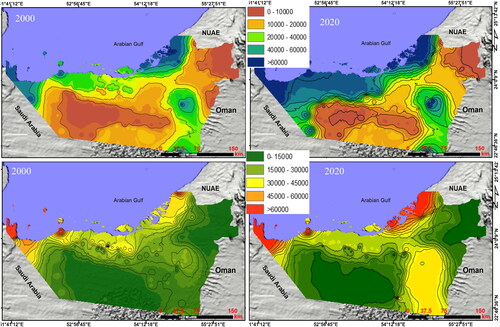
The sharp deletion in groundwater quality and increased NO3 and TDS concentration and water salinity is attributed to the dissolution and leaching of salts, intensive use of fertilizers, and irrigation water return flow from agricultural activity to the surficial aquifer (Saou et al. Citation2012; Shahin and Salem Citation2015). Several activities link to urbanization and land development result in sewage, which introduces into the groundwater system high concentrations of trace metals (Qin et al. Citation2013). There is a strong spatial association between septic tanks, sewage treatment plants, landfills, and TDS concentration in the groundwater (Elmahdy et al. Citation2020).
Towards the coastal areas, a sharp increase of salinity and TDS concentrations in groundwater were observed. These are attributed to population growth, agricultural and industrial activities, and the use of fertilizer and retreated water for gardening (Mahmood et al. Citation2010; Zhou et al. Citation2013). The gradual increase in TDS concentration is also attributed to seawater intrusion and the carriage of dissolved and non-dissolved solutes by groundwater flow along the palaeochannels (the wadi courses) during wet seasons (Elmahdy et al. Citation2020).
The use of unsystematic drainage and septic tanks in industrial and agricultural areas (e.g. labor camps) is also a significant factor in increasing the TDS concentration in the groundwater (Zhou et al. Citation2013). Hydrologically, groundwater seeps out of the mountainous areas (in the east), dissolves solutes in the soil, mixes dissolved salts with trace elements, and accumulates along coastal areas (Elmahdy et al. Citation2020). The dissolution of evaporates, leakage of saline water, and circulation of flow irrigation of the groundwater aquifer are also sources of salinity and TDS in groundwater (Appelo & Postma Citation1999; Qin et al. Citation2013). In general, with distance away from the mountainous areas, salinity and TDS concentration in groundwater increases and the groundwater becomes more saline ().
The map expresses the irrigation water quality index (IWQI) constructed from groundwater parameters (TDS and EC) is shown in . The map consists of different colour codes that represent the IWQI values. The IWQI values range from 10 (Low suitability) to more than > 50 (water is more suitable for agriculture. Most of the groundwater wells and agricultural areas are located within zones of high and severe restriction and low value of IWQI (<50), while 10 to 15% of the groundwater wells are located within the agricultural areas and zones with higher IWQI values (>50) covering an area of about 1326.12 km2 (2.21%) (). The area of IWQI across the study area reduced from 1805.45 km2 (3%) in 2000 to 1326.12 km2 (2.21%) in 2020.
Figure 7. Regional spatial distribution of electric conductivity of the groundwater (up), and IWQI (down) in the Emirate of Abu Dhabi from 2000 to 2020.
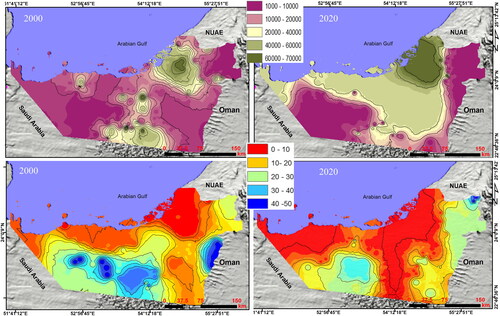
The reason for that was found to be due to over-pumping, rainfall scarcity and inventive farming during the period from 2000 to 2020. This deterioration is expected to continue during the next years.
5.5. Spatial analysis and correlation
The spatial relationship between LULC classes and the water level and quality parameters (NO3 and TDS) was explored and a relationship model based on further statistical analysis was performed. The results show that there is a negative relationship between vegetation density and groundwater level and the irrigated agricultural area () and the correlation between LULC and population and groundwater level is low. The result shows that the impervious surface (roads and building roofs) and farmland are the most important factors leading to sharp depletion in groundwater level and quality. Rapid population growth and intensive agricultural activities are the major water consumer, with an average of about 60% (JICA (Japanese International Cooperation Agency) Citation1996; Sherif and Singh Citation1999; Brook and Dawoud Citation2005).
Figure 8. Relationship between groundwater table and vegetation density(a), LULC density against nitrate concentration (b), groundwater salinity (c), TDS (d), SAR (e) and IWQI (f).
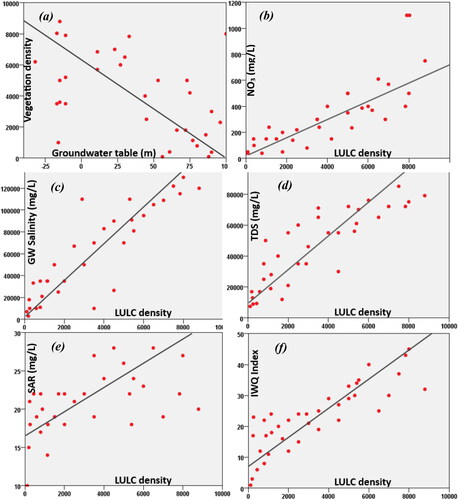
The increase in the built-up area can decrease rainwater infiltration due to their impervious surfaces (Elmahdy and Mohamed Citation2014; Shahin and Salem Citation2015; Elmahdy and Mohamed Citation2016). These results agree well with Scanlon and Andraski (Citation2002), Elmahdy and Mohamed (Citation2016), Elmahdy and Mohamed (Citation2012), Elmahdy et al. (Citation2016), Elmahdy et al. (Citation2022), and Sherif and Singh (Citation1999), who reported that rainfall scarcity, increase in temperature anomaly and rapid urbanisation, as well as intensive human activities are greatly impacting groundwater quality decline. On the other hand, the high density of LULC led to groundwater depletion and, thus, seawater intrusion toward aquifers and increase groundwater salinity (Al-Rashed and Sherif Citation2000; McMahon Citation2003; Al-Hogaraty et al. Citation2008; Gebru et al. Citation2019). In the UAE, including the study area, the population growth trends since 1990 were projected to 2050 to estimate water needs during the next 30 years and the estimated daily water consumption varies from 540 to 570 litres per person and total water usage from 100 mcm in 1990 to 3500 mcm in 2020.
shows an interconnection of LULC density with water quality and it is found linearly correlated. These correlations of LULC with groundwater quality parameters such as NO3, SAR and TDS are indicative that are directly proportional with EC. It is also found that the density of LULC is directly proportional to SAR and EC. As the LULC density increases, the TDS, EC and SAR values increase. This is because the high TDS concentration in the groundwater appears to be due to different salts such as sulphates, bicarbonate, carbonate, chloride, sodium, and nitrate, which may increase EC (Singh et al. Citation2020). The high concentration of salinity and TDS is also positively associated with SAR and intensive urbanization (). The spatial correlation between LULC density and IWQI and SAR is directly proportional ().
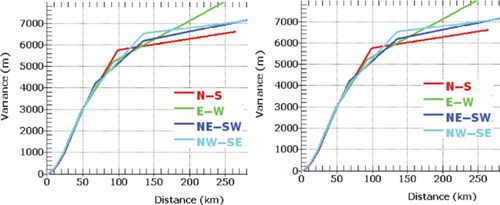
Semivariogram models, in conjunction with visual inspection, clearly indicate strong agreement between patterns and trends of LULC classes and groundwater quality parameters (). The four-directional semivariogram models for the different maps show reasonable consistency. Furthermore, sill values of semivariogram models did not change greatly between LULC and groundwater level and groundwater parameters. All directional semivariogram models rise from an original point and continue with an abrupt change at about 4 km, with little variation or dip in the curve with an increase, indicating that the relationship has a good fit and a positive impact of the rapid changes in LULC on groundwater level and quality. The results also indicate that the LULC classes and groundwater parameters have significant spatial correlation over space and time. Thus, this investigation allows a better understanding of the impact of the changes in LULC on groundwater level and quality.
Figure 9. Semivariogram models for four directions of the 2020 maps of LULC (a) and TDS (b). These are generated from 2020 raster maps of LULC and TDS.
6. Limitations and recommendations
Although the proposed approach offers a vast amount of information for urban planners and hydrologists and could elicit a novel spatial association between LULC changes and groundwater level and quality, further investigation of the impact of groundwater level depletion (influenced by rapid LULC changes) on land subsidence is suggested. Additionally, the use of Landsat images with a spatial resolution of 30 m may introduces a source of misclassification in the change detection process. In other talks, the Landsat sensors failed to distinguish between cropland in agricultural areas.
Future work should incorporate Sentinel data with a spatial resolution of 10 m (e.g. Sentinel-2), which could increase the overall accuracy, to monitor land subsidence over the study area and support the correlation of results with the rapid changes in LULC and groundwater level and quality. Further investigation of the role of terrain different parameters such as slope, micro-depressions, paleochannels and lithology types in groundwater quality are also recommended.
7. Conclusion
The current study investigates the impact of LULC changes on groundwater level and quality in space and time across the Emirate of Abu Dhabi, UAE. Two sets of Landsat images were used to classify LULC using random forest classifiers and monitor their changes using image different tool implemented in Envi software. All LULC change maps and hydrological information were converted into raster format and spatial analysis was performed. From 2000 to 2020, the UAE, including, the Emirate of Abu Dhabi had a rapid growth and massive increase in LULC, especially built-up and garden/park areas, covering almost double over the 20 years. The most notable LULC transformation was in the capital of Abu Dhabi and the city of Al Ain and their adjoining areas. Between them, there is an intensive region of farmland areas. Other portions of intensive agricultural activities were observed in Al Wagan (east) and Liwa (south). From 2000 to 2020, groundwater level and quality sharply deteriorated as a normal result by rapid population growth and intensive urbanization. In the study area, the groundwater levels depleted of about 40 m since 2000 and is expected to increase year after year. Contrarily, a significant rise in groundwater level even under the effects of intensive urbanization due to intensive recharge by irrigation and gardening. The results of the spatial analysis indicate that agricultural and human activities have a positive correlation with the NO3 concentration in the groundwater, while LULC density was negatively correlated with groundwater level. High concentration of salinity, TDS and SAR is normally caused by a higher density of LULC, seawater intrusion and over-pumping due to population growth and farmland increase. The IWQI value increases in groundwater wells across the areas of higher LULC changes, while the coastal area and inland Sabkha have a lower value of IWQI. Continued rapid population growth and change in LULC represent a serious threat to the hydrological resources of the Emirate of Abu Dhabi and further investigation is required.
Disclosure statement
No potential conflict of interest was reported by the author(s).
Additional information
Funding
References
- Al Asam MS. 1996. UAE water resources use in agriculture and conservation. International desalination association (IDA) conference of desalination. Abu Dhabi: IDA; p. 625–637.
- Al Nuaimi HS. 2003. [Hydrogeological and Geophysical Studies on Al Jaww plain, Al Ain Area, United Arab Emirates] [[MSc thesis]]. Al Ain: United Arab Emirates University.
- Alsharhan AS, Cohen A, Barth HJ, Böer B. 2002. The holocene tidal flat complex of the Arabian Gulf coast of Abu Dhabi. In: Bart HJ, Boer B, editors. Sabkha Ecosystems: volume I: the Arabian peninsula and adjacent countries. Vol. 1. Dordrecht: Springer; p. 21.
- Adhikari SP, Meng S, Wu Y-J, Mao Y-P, Ye R-X, Wang Q-Z, Sun C, Sylvia S, Rozelle S, Raat H, et al. 2020. Epidemiology, causes, clinical manifestation and diagnosis, prevention and control of coronavirus disease (COVID-19) during the early outbreak period: a scoping review. Infect Dis Poverty. 9(1):29. doi: 10.1186/s40249-020-00646-x.
- Al Tenaiji AK, Braimah N, Sgouridis S. 2021. Impacts of farming practices on water resources sustainability for arid lands: the case of Abu Dhabi. Int J Water Resour Dev. 37(4):584–602. doi: 10.1080/07900627.2019.1654440.
- Al-Hogaraty EA, Rizk ZS, Garamoon HK. 2008. Groundwater pollution of the quaternary aquifer in northern United Arab Emirates. Water Air Soil Pollut. 190(1-4):323–341. doi: 10.1007/s11270-007-9584-9.
- Al-Rashed M, Sherif MM. 2000. Water resources in the GCC countries: an overview. Water Resour. Manag. 14(1):59–75. doi: 10.1023/A:1008127027743.
- Appelo CAJ, Postma D. 1999. Geochemistry, groundwater and pollution; Rotterdam, The Netherlands: Balkema, p. 636.
- Breiman L. 2001. Random forests. Mach Learn. 45(1):5–32. doi: 10.1023/A:1010933404324.
- Brook M, Dawoud MA. 2005. Coastal water resources management in the United Arab Emirates. Abu Dhabi, United Arab Emirates (UAE): Integrated Coastal Zone Management in the United Arab Emirates, p. 1–12.
- Chen W, Xie X, Wang J, Pradhan B, Hong H, Bui DT, Duan Z, Ma J. 2017. A comparative study of logistic model tree, random forest, and classification and regression tree models for spatial prediction of landslide susceptibility. Catena. 151:147–160. doi: 10.1016/j.catena.2016.11.032.
- Congalton RG. 2004. Putting the map back in map accuracy assessment. Remote Sens. GIS Accuracy Assess. 5:1–11.
- Congalton RG, Mead RA. 1983. A quantitative method to test for consistency and correctness in photointerpretation. Photogramm Eng Remote Sens. 49(1):69–74.
- Congalton RG. 1991. A review of assessing the accuracy of classifications of remotely sensed data. Remote Sens Environ. 37(1):35–46. doi: 10.1016/0034-4257(91)90048-B.
- Elmahdy S, Ali T, Mohamed M. 2021. Regional mapping of groundwater potential in Ar Rub Al Khali, Arabian Peninsula using the classification and regression trees model. Remote Sens. 13(12):2300. doi: 10.3390/rs13122300.
- Elmahdy SI, Mohamed MM. 2014. Groundwater potential modelling using remote sensing and GIS: a case study of the Al Dhaid area, United Arab Emirates. Geocarto Int. 29(4):433–450. doi: 10.1080/10106049.2013.784366.
- Elmahdy SI, Mohamed MM. 2014. Relationship between geological structures and groundwater flow and groundwater salinity in Al Jaaw Plain, United Arab Emirates; mapping and analysis by means of remote sensing and GIS. Arab J Geosci. 7(3):1249–1259. doi: 10.1007/s12517-013-0895-4.
- Elmahdy SI, Mohamed MM. 2015. Remote sensing and geophysical survey applications for delineating near-surface palaeochannels and shallow aquifer in the United Arab Emirates. Geocarto Int. 30(7):723–736. doi: 10.1080/10106049.2014.997306.
- Elmahdy SI, Mohamed MM. 2016. Land use/land cover change impact on groundwater quantity and quality: a case study of Ajman Emirate, the United Arab Emirates, using remote sensing and GIS. Arab J Geosci. 9(19):722. doi: 10.1007/s12517-016-2725-y.
- Elmahdy SI, Mohamed MM. 2018. Monitoring and analysing the Emirate of Dubai’s land use/land cover changes: an integrated, low-cost remote sensing approach. Int J Digit Earth. 11(11):1132–1150. doi: 10.1080/17538947.2017.1379563.
- Elmahdy SI, Mohamed MM. 2023. Regional mapping and monitoring land use/land cover changes: a modified approach using an ensemble machine learning and multitemporal Landsat data. Geocarto Int. 38(1):2184500.
- Elmahdy S, Mohamed M, Ali T. 2020. Land use/land cover changes impact on groundwater level and quality in the northern part of the United Arab Emirates. Remote Sens. 12(11):1715. doi: 10.3390/rs12111715.
- Elmahdy S, Marghany M, Mohamed MM. 2016. Application of a weighted spatial probability model in GIS to analyse landslides in Penang Island, Malaysia. Geomatics, Nat Hazards Risk. 7(1):345–359.
- Elmahdy S, Mohamed MM. 2012. Topographic attributes control groundwater flow and groundwater salinity of Al Ain, UAE: a prediction method using remote sensing and GIS. J Environ Earth Sci. 2(8):1–13.
- Elmahdy S, Mohamed MM, Ali TA, Abdalla JED, Abouleish M. 2022. Land subsidence and sinkholes susceptibility mapping and analysis using random forest and frequency ratio models in Al Ain, UAE. Geocarto Int. 37(1):315–331.
- Foody GM. 2002. Status of land cover classification accuracy assessment. Remote Sens Environ. 80(1):185–201. doi: 10.1016/S0034-4257(01)00295-4.
- Foody GM, Mathur A. 2006. The use of small training sets containing mixed pixels for accurate hard image classification: training on mixed spectral responses for classification by a SVM. Remote Sens Environ. 103(2):179–189. doi: 10.1016/j.rse.2006.04.001.
- Gebru BM, Lee WK, Khamzina A, Lee SG, Negash E. 2019. Hydrological response of dry afromontane forest to changes in land use and land cover in Northern Ethiopia. Remote Sens. 11(16):1905. doi: 10.3390/rs11161905.
- Ghimire S, Yaseen ZM, Farooque AA, Deo RC, Zhang J, Tao X. 2021. Streamflow prediction using an integrated methodology based on convolutional neural network and long short-term memory networks. Sci Rep. 11(1):17497. doi: 10.1038/s41598-021-96751-4.
- Jensen JR, Cowen D, Huang X, Graves D, He K, Mackey HE. 1996. Remote sensing image browse and archival systems. Geocarto Int. 11(2):33–42. doi: 10.1080/10106049609354532.
- JICA (Japanese International Cooperation Agency). 1996. The master plan study on the groundwater resources development for agriculture in the vicinity of Al Dhaid in the UAE, Final Report. Sharjah, UAE: JICA International Cooperation Agency.
- Kesgin B, Nurlu E. 2009. Land cover changes on the coastal zone of Candarli Bay, Turkey using remotely sensed data. Environ Monit Assess. 157(1-4):89–96. doi: 10.1007/s10661-008-0517-x.
- Kirimi F, Thiong’o K, Gabiri G, Diekkrüger B, Thonfeld F. 2018. Assessing seasonal land cover dynamics in the tropical Kilombero floodplain of East Africa. J Appl Rem Sens. 12(02):1. doi: 10.1117/1.JRS.12.026027.
- Liaw A, Wiener M. 2002. Classification and regression by randomForest. R News. 2(3):18–22.
- Lu D, Weng Q, Moran E, Li G, Hetrick S. 2011. Remote sensing image classification. Boca Raton, FL, USA: CRC Press, Taylor and Francis, p. 219–240.
- Mahmood R, Pielke RA, Hubbard KG, Niyogi D, Bonan G, Lawrence P, McNider R, McAlpine C, Etter A, Gameda S, et al. 2010. Impacts of land use/land cover change on climate and future research priorities. Bull Am Meteor Soc. 91(1):37–46. doi: 10.1175/2009BAMS2769.1.
- McMahon PB. 2003. Water movement through thick unsaturated zones overlying the central high plains aquifer, Southwestern Kansas, 2000–2001; US Department of the Interior. Vol. 3. Lawrence, KS, USA: US Geological Survey.
- Mohamed MM, Saleh NE, Sherif MM. 2010. Sensitivity of benzene natural attenuation to variations in kinetic and transport parameters in Liwa Aquifer, UAE. Bull Environ Contam Toxicol. 84:443–449.
- Mojid MA, Parvez MF, Mainuddin M, Hodgson G. 2019. Water table trend—a sustainability status of groundwater development in North-West Bangladesh. Water. 11(6):1182. doi: 10.3390/w11061182.
- Ouma YO, Keitsile A, Nkwae B, Odirile P, Moalafhi D, Qi J. 2023. Urban land-use classification using machine learning classifiers: comparative evaluation and post-classification multi-feature fusion approach. Eur J Remote Sens. 56(1):2173659. doi: 10.1080/22797254.2023.2173659.
- Qin R, Wu Y, Xu Z, Xie D, Zhang C. 2013. Assessing the impact of natural and anthropogenic activities on groundwater quality in coastal alluvial aquifers of the lower Liaohe River Plain, NE China. Appl Geochem. 31:142–158. doi: 10.1016/j.apgeochem.2013.01.001.
- Saou A, Maza M, Seidel JL. 2012. Hydrogeochemical processes associated with double salinization of water in an Algerian Aquifer, carbonated and evaporitic. Pol J Environ Stud. 21:1013–1024.
- Scanlon BR, Andraski BJ. 2002. Miscellaneous methods for measuring matric or water potential. In: dane JH, Topp GC, editors. Methods of soil analysis, part 4, physical methods. Madison, WI: Soil Science Society of America; p. 643–670.
- Setianto A, Triandini T. 2015. Comparison of kriging and inverse distance weighted (IDW) interpolation methods in lineament extraction and analysis. J Appl Geol. 5(1):21–29. doi: 10.22146/jag.7204.
- Shahin S, Salem MA. 2015. The challenges of water scarcity and the future of food security in the United Arab Emirates (UAE). nrc. 3(1):1–6. 67. doi: 10.13189/nrc.2015.030101.
- Sharp JM. 2010. The impacts of urbanization on groundwater systems and recharge. Aqua Mundi. 1:51–56. doi: 10.4409/Am-004-10-0008.
- Sherif MM, Singh VP. 1999. Effect of climate change on sea water intrusion in coastal aquifers. Hydrol Process. 13(8):1277–1287. doi: 10.1002/(SICI)1099-1085(19990615)13:8<1277::AID-HYP765>3.0.CO;2-W.
- Singh KK, Tewari G, Kumar S. 2020. Evaluation of groundwater quality for suitability of irrigation purposes: a case study in the udham Singh nagar, uttarakhand. J Chem. 2020:1–15. doi: 10.1155/2020/6924026.
- Van Niel TG, McVicar TR, Datt B. 2005. On the relationship between training sample size and data dimensionality: monte Carlo analysis of broadband multi-temporal classification. Remote Sens. Environ. 98(4):468–480. doi: 10.1016/j.rse.2005.08.011.
- Vogelmann JE, Gallant AL, Shi H, Zhu Z. 2016. Perspectives on monitoring gradual change across the continuity of Landsat sensors using time-series data. Remote Sens Environ. 185:258–270. doi: 10.1016/j.rse.2016.02.060.
- Wang Y, Yin W, Zeng J. 2019. Global convergence of ADMM in nonconvex nonsmooth optimization. J Sci Comput. 78(1):29–63. doi: 10.1007/s10915-018-0757-z.
- Wen C, Dong W, Meng Y, Li C, Zhang Q. 2019. Application of a loose coupling model for assessing the impact of land-cover changes on groundwater recharge in the Jinan spring area, China. Environ Earth Sci. 78(13):382. doi: 10.1007/s12665-019-8388-8.
- Wulder MA, White JC, Goward SN, Masek JG, Irons JR, Herold M, Cohen WB, Loveland TR, Woodcock CE. 2008. Landsat continuity: issues and opportunities for land cover monitoring. Remote Sens Environ. 112(3):955–969. doi: 10.1016/j.rse.2007.07.004.
- Zhou Y, Wenninger J, Yang Z, Yin L, Huang J, Hou L, Wang X, Zhang D, Uhlenbrook S. 2013. Groundwater-surface water interactions, vegetation dependencies and implications for water resources management in the semi-arid Hailiutu River catchment, China - a synthesis. Hydrol Earth Syst Sci. 17(7):2435–2447. doi: 10.5194/hess-17-2435-2013.