
Abstract
This paper examines a feature-level fusion framework for detecting and mapping land degradation (LD) and enabling sustainable land management (SLM) in semi-arid areas using optical sensors and Synthetic Aperture Radar (SAR) satellite data. The objectives of this review were to (i) determine the trends and geographical location of land degradation mapping publications, (ii) to identify and report current challenges pertaining to mapping LD using multiscale remote sensing data, (iii) to recommend a way forward for monitoring LD using multiscale remote sensing data. The study reviewed 78 peer-reviewed research articles published over the past 24 years (1998–2022). Image fusion has the potential to be more useful in various remote sensing applications than individual sensor image data, making it more informative and valuable in the interpretation process. In addition, this review discusses the importance of SAR and optical image fusion, pixel-level techniques, applications, and major classes of quality metrics for objectively assessing fusion performance. The literature review alluded that the SAR and optical image fusion in the detection and mapping of land degradation and enabling sustainable land management has not been fully explored. Advanced techniques such as the fusion of SAR and optical satellite imageries need to be incorporated for the detection and mapping of LD, as well as the promotion of SLM in halting LD in South African drylands and around the world. We conclude that there is scope for further research on the fusion of SAR and optical images, as new micro-wave and optical sensors with higher resolution are introduced on a regular basis. The results of this review contribute to a better understanding of the applications of SAR and optical image fusion in future research in the severely degraded drylands of southern Africa.
The fusion of SAR and optical data still remains an open challenge. The future of different remote sensing applications lies in this kind of fusion.
Land degradation is one of the greatest challenges amongst the environmental problems in South Africa, causing a reduction in the capacity of the land to perform ecosystem functions and services that support society and development.
Yet, in South Africa, there are no studies that have widely investigated the potential for a fusion of SAR and optical data to detect and map land degradation and SLM practices.
This paper established a baseline for understanding the application of a fusion of SAR and optical data as rapid tools for mapping, monitoring, and evaluating LD, as well as the impacts of SLM practices in South Africa’s degraded drylands.
KEY RESEARCH GAPS
1. Introduction
Land degradation (LD) is currently one of the greatest environmental concerns. Globally, it is estimated that about 25% of the land surface is highly degraded, while 36% is moderately degraded (UNCCD Citation2017b). In South Africa, approximately 0.7 million hectares of land are considered to be degraded (DEA-NAP Citation2018). LD is defined as a persistent decrease in the capacity of an arid or semiarid eco-system to supply a range of services, including (but not restricted to) forage, fuel, timber, crops, fresh water, wild-harvested foods, biodiversity habitats, and tourism opportunities. Land degradation is a complex term due to its interdisciplinary nature, incorporating geographical, ecological, climatic, and socio-economic perspectives. Such complexity arises partly due to an ongoing discussion on defining land degradation and how it should be measured (Nkonya et al. Citation2013, Lal Citation2015; Mirzabaev et al. Citation2015; Dubovyk Citation2017).
There is a range of definitions of land degradation – the definition by UNCCD (Citation2017b) refers to land degradation as the ‘reduction or loss of biological or economic productivity, and complexity of rain-fed cropland, irrigated cropland, or rangeland, pasture, forest and woodlands resulting from land uses or from a process or combination of processes arising from human activities and habitation patterns’ (Dubovyk Citation2017; Sanz et al. Citation2017; Thomas et al. Citation2017). In this review, land degradation is regarded as the reduction in vegetation cover and the proliferation of bare soil patches is considered as potential land degradation risk. Generally, land degradation is mainly caused by anthropogenic factors such as overgrazing and deforestation, which leave the ground exposed to wind and surface runoff erosion (Reed et al. Citation2011; Traoré et al. Citation2015; Alemu Citation2016; Wairiu Citation2017; UNCCD Citation2017a; Thomas et al. Citation2018).
Unsustainable land management practices such as cultivation on steep slopes and continued conventional soil tillage reduce the soil quality, thereby, accelerating land degradation (Taddese Citation2001; Lal Citation2015). Also, rapid land cover changes and climate variations threaten the productivity of rangelands leading to bush encroachment and habitat fragmentation, causing degradation (Mussa et al. Citation2017; Ramoelo et al. Citation2018). Other biophysical factors that influence land degradation include seasonal rainfall variations and steep terrain; which activate the wearing of the topsoil, especially in areas with low vegetation cover (Meadows and Hoffman Citation2002; Ochoa et al. Citation2016). Land degradation has a negative impact on people’s livelihoods through the decrease in rangeland productivity and loss of fertile topsoil (Bedunah and Angerer Citation2012).
The concept of SLM serves as a unifying theme for global efforts to combat desertification, drought and land degradation, climate change, and loss of biodiversity (World Bank Citation2008; Thomas et al. Citation2018). SLM combines technologies, policies, and activities aimed at integrating socioeconomic principles with environmental concerns in order to maintain or enhance production, increase the resilience of ecosystem services, and be economically viable and socially acceptable (Stringer and Reed Citation2007; Reed et al. Citation2011; Stringer and Harris Citation2014; Reed et al. Citation2015; Webb et al. Citation2017; Thomas et al. Citation2018; Smith et al. Citation2019). The SLM concept is relatively new in South Africa – hence there is an urgent need to further develop SLM approaches and technologies by increasing the number and range of stakeholders, including small farmers and communities and other key groups (Bunning et al. Citation2016; Nigussie et al. Citation2017; Gonzalez-Roglich et al. Citation2019; Liniger et al. Citation2019; von Maltitz et al. Citation2019; Nzuza et al. Citation2021).
To date, mapping and monitoring land degradation have relied on four main approaches expert opinion, biophysical modelling, the conventional field-based approach, and satellite observations (Belenguer-Plomer et al. Citation2019; Nzuza et al. Citation2021). The expert knowledge approach is based on the nature, extent, degree, and causes of soil degradation within a mapping entity and typically necessitates extensive knowledge and experience in soil conservation (Bindraban et al. Citation2012; Cherubin et al. Citation2016). The main disadvantages of expert knowledge include, however, subjectivity, inconsistency, and difficulties in accountability (Nzuza et al. Citation2021). The conventional field-based approach includes techniques such as local sampling and observational surveys such as flowcharts and volumetric surveys. The benefit of this technique is that it can provide detailed objective information on soil degradation at the plot level. However, this method is frequently criticized for being time-consuming, labour-intensive, expensive, and only applicable to small areas.
LD and SLM detection and mapping are essential for countries worldwide, and remote sensing makes it possible on temporal and spatial scales, especially for semi-arid regions. Remote sensing data, irrespective of their type (active or passive sensing), provide valuable information on LD, and the effectiveness of SLM practices as compared with field-based conventional studies and land cover mapping using remote sensing methods is used widely worldwide. The objectives of the paper are to (i) determine the trends and geographical location of land degradation mapping publications, (ii) to identify and report current challenges pertaining to mapping LD using multiscale remote sensing data, (iii) To recommend a way forward for monitoring LD using multiscale remote sensing data.
2. Review methodology
2.1. Systematic reviews
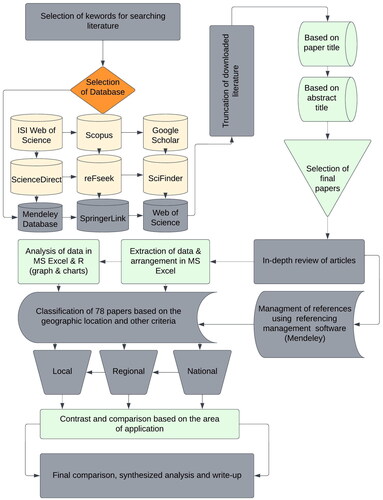
A systematic literature review is a summary and assessment of the state of knowledge on a particular subject or research question that is organized to succinctly present current information. The flowchart below () presents the methodology used to conduct this literature review. The first step was to choose the keywords carefully and systematically for the literature search using the internet literature resources that were already available. The following were the precise keywords for this review: remote sensing in South Africa, fusing Synthetic Aperture Radar (SAR) and optical imagery in South Africa, land degradation detection and mapping using image fusion of optical and SAR in South Africa, assessment of the effectiveness of sustainable land management interventions using fusing (SAR) and optical imagery in South Africa, land-use and landcover (LULC) classification using fusing (SAR) and optical imagery in South Africa, vegetation cover mapping fusing (SAR) and optical imagery in South Africa, spatial analysis of land degradation in South Africa, alien invasive plants detection and mapping using satellite images in South Africa, biomass assessment using satellite imagery in South Africa, and so on.
Figure 1. Methodological flowchart of the review.
2.2. Paper selection and exclusion
Downloaded papers from various publications were organized into folders. These papers were chosen for screening based on their titles and abstracts, while a slight number of published publications were chosen for screening based on the methods section. Following that, a final selection of papers was examined thoroughly, and data were retrieved. The retrieved data were handled and thoroughly analysed in a Microsoft Excel (MS Excel) database. Maps, graphs, and charts were generated as a result of the analysis using MS Excel and R software. The studies were divided into geographical areas (local, regional and national). Based on a global baseline dataset for deep learning in SAR-optical data fusion on mapping of LD, the studies under these areas were described. In order to compare the SAR-optical data fusion reported in different studies, the SAR-optical data fusion on mapping of LD in each district/province under study was retrieved. The purpose of this review was to compare and debate statistics provided between 1998 and 2022. From 1998 to 2022, we found 78 articles that presented various methodologies to map LD and its prediction assessment using remotely sensed data and imageries. Each study covers the application of SAR and optical data fusion, and the LD reported in the different studies was compared. For managing, citing, and referencing published papers in the manuscript, we used Mendeley Reference Manager, an open-source software.
3. The fusion framework for Synthetic Aperture Radar (SAR) and optical imagery
3.1. Synthetic Aperture Radar (SAR) imagery
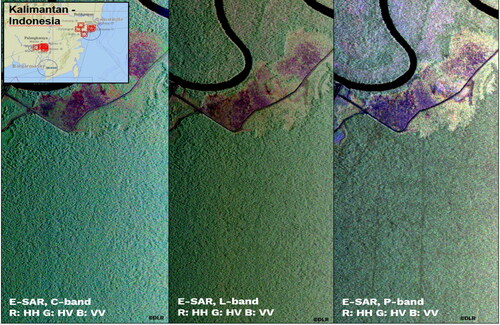
Due to its larger wavelength, synthetic aperture radar is an active microwave sensor, its radiation may, with the exception of heavy rain, pass through cloud cover, haze, dust, and other meteorological conditions (Kulkarni and Rege Citation2020). This capability always makes SAR data accessible in all weather and environmental circumstances (Kulkarni and Rege Citation2020). An antenna collects some of the energy that is backscattered from various objects in the area that the radar is illuminating at a right angle to the motion of the sensor platform. The amount of backscattered energy from distinct objects relies on their surface abrasion, moisture content, and dielectric characteristics (Robertson et al. Citation2019). As a result, it can distinguish between different objects in the image based on their surface characteristics and produces a SAR image that is richer in spatial information. It primarily characterizes the structural aspects of various objects on the surface (Zhang J et al. Citation2010). Radar signals have polarization. SAR data frequency and polarization, which refer to the orientation of the transmitted and received signal, are crucial for capturing vegetation structure. HH, HV, VH, and/or VV are the transmission and reception modes for multi-polarized SAR systems, where H stands for horizontal wave orientation and V for vertical wave orientation (). This enables the extraction of additional structural information and a more thorough assessment of the scattering characteristics of ground objects. HV and VH are more closely related to the structure of the tree canopy because of the volumetric water content (Hughes et al. Citation2020; Meraner et al. Citation2020; Torres et al. Citation2016; Zhang J et al. Citation2010).
Figure 2. Matched pair of different parameters of SAR images.
3.2. Optical imagery
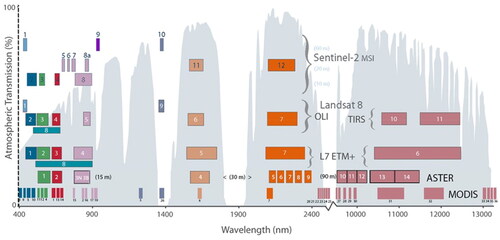
Optical sensors are passive components that gather solar light that has been reflected off of earthly objects. The electromagnetic spectrum’s ultraviolet, visible, and infrared wavelengths are all covered by these sensors. Optical sensors are categorized as panchromatic, multispectral, or hyperspectral based on their spectral resolution. In the visible and near-infrared regions of the electromagnetic spectrum, panchromatic sensors are capable of detecting a broad variety of wavelengths. These sensors have a high spatial resolution but a poor spectral resolution. Due to their wavelength specificity, multispectral sensors react differently to the electromagnetic spectrum’s various wavelength bands, which range from visible to near-infrared (). By separating targets in the scanned area depending on their multispectral reflectance, the spectral resolution of these images is increased (Mishra and Susaki Citation2014; Garcia et al. Citation2015; Togliatti et al. Citation2019; Hughes et al. Citation2020; Kulkarni and Rege Citation2020; Hillmer et al. Citation2021; Cui et al. Citation2022). Multispectral sensors are passive, yet even so, they have a wide enough instantaneous field of view to receive enough energy. As a result, multispectral images have a low spatial resolution. The spatial resolution of multispectral images is constrained by the sensor platform’s restricted storage capacity and the earth station’s constrained bandwidth. Higher spectral resolution improves the interpretability of multispectral images. High spectral resolution and sensitivity are characteristics of hyperspectral sensors. These sensors can offer nearly constant measurements of the visible and near-infrared portions of the electromagnetic spectrum and can have hundreds of spectral bands (Joshi et al. Citation2016; Kulkarni and Rege Citation2020; Zhang R et al. Citation2020).
Figure 3. Spectral resolution = ability of a sensor to separate individual wavelength ranges (channels or bands) (https://landsat.gsfc.nasa.gov/).
3.3. Significance of fusion of SAR and optical imagery
SAR images are rich in spatial information and available in all weather conditions and at all times – yet lack the spectral data that is essential for many remote sensing applications. However, it is difficult to read and tainted with speckle noise (i.e. granular noise present in radar imagery). Optical/multispectral images are produced using sunlight reflected from terrestrial objects. Two objects with distinct structures may look the same in optical images but can be recognized in SAR images because of their spectrum sensitivity. Datasets gathered by remote sensors that operate on various fundamental physical principles will be combined to produce synergistic data in order to alleviate this constraint, and in particular to improve land-use dynamics detection (Rani et al. Citation2017; Kulkarni and Rege Citation2020). In this way, SAR and optical images offer complementary data about the area being imaged, and combining these images creates a composite image with a richness of spectral and spatial data. Gaining a better comprehension and interpretation of the imaged area benefits from analysis of the combined images (Reiche et al. Citation2013; Kulkarni and Rege Citation2020; Baydogan and Sarp Citation2022; Park et al. Citation2022; Tufail et al. Citation2022; Zhang C et al. Citation2022; Zhao et al. Citation2022).
3.4. Pre-processing for SAR and optical image fusion
To improve pixel-level fusion performance, SAR and optical images must be pre-processed. The two steps of this pre-processing are registration of the merged images and speckle reduction from the SAR image. The coherent processing of the backscattered signal causes multiplicative speckle noise to taint SAR images. This makes the image look blurry and makes it challenging to visually comprehend SAR images (Heydari and Mountrakis Citation2018; Kulkarni and Rege Citation2020). Therefore, reducing speckle noise is a crucial pre-processing step before merging SAR and optical images. The primary objectives of speckle reduction filters are (1) effective noise suppression in homogeneous areas, (2) preservation and enhancement of image edges, and (3) visual appearance enhancement. Compromises are necessary since it is difficult to accomplish all of these goals at once. Researchers have developed a variety of methods for lowering speckle noise in SAR images. Spatial domain methods and multi-resolution domain methods are the two basic types of speckle reduction techniques. Some of the most popular spatial domain techniques include the Lee filter, Frost filter, Extended Lee filter, Extended Frost filter, and Gamma MAP filter (Deepthy Mary Alex et al. 2020; Yin et al. Citation2020; Karimi and Taban Citation2021; Khare and Kaushik Citation2021; Li et al. Citation2021; Jin et al. Citation2022; Wang F et al. Citation2022; Zeng et al. Citation2022). Wavelet shrinkage algorithms have been used by some researchers to minimize speckle noise in SAR images (Leal and Paiva Citation2019; Zhang W and Xu Citation2019; Khare and Kaushik Citation2021). In order to improve the quality of the images produced by PPSDH, Jeong et al. (Citation2019) propose a speckle noise reduction approach based on interpolation. No one algorithm can, however, guarantee the optimal speckle reduction for all kinds of SAR images. Recent developments in speckle reduction include non-local filtering-based methods (Hua et al. Citation2022; Kumar et al. Citation2021; Nakano et al. Citation2011; Varadarajan et al. Citation2022; Zhang G et al. Citation2021). Some researchers have applied a deep learning approach for filtering the SAR images (Hughes et al. Citation2020; Yin et al. Citation2020; Zheng et al. Citation2021; Karaoğlu et al. Citation2022). Numerous speckle reduction techniques exist – however, traditional methods are still successfully used for the integration of SAR and multispectral data.
4. Pixel-level fusion methods
The purpose of fusing optical images at the pixel level is mainly to improve spatial resolution, improve structural and geometrical detail while maintaining the spectral fidelity of the original MS data. Using the same or distinct sensors, multitemporal data pixel-level fusion is used to emphasize the informative changes between different times. Fusion approaches are increasingly being used for change detection and analysis.
4.1. Spatial component substitution methods
Several pixel-level fusion techniques have been reported in the existing literature, including Principal Component Analysis (PCA), Gram-Schmidt (GS) Orthogonalization, Intensity-Hue-Saturation (IHS) transform, Brovery Transform (BT), High Pass Filtering (HPF) and Ehlers fusion (Liedtke and Growe Citation2001; Zhang J et al. Citation2010; Salentinig and Gamba Citation2016; Li Citation2017; Rani et al. Citation2017; Abdikan Citation2018; Ahmed, Rabus and Beg Citation2020). These techniques necessitate a high correlation between the images to be fused in order to minimize distortion in the fused image. However, some of the techniques in this group, require histogram matching between components to be fused (Rani et al. Citation2017; Kulkarni and Rege Citation2020).
Intensity-Hue-Saturation (IH) Transform
One of the most frequently employed image fusion techniques for combining complementary multi-sensor datasets is the intensity-hue-saturation (IHS) transform. The IHS technique was initially used on multispectral images to distinguish spectral and spatial content (Abdikan et al. Citation2014; Abdikan Citation2018). The benefit of this technique is that it lessens spectral aberrations in the combined image. However, the intensity component is substituted with a high-resolution SAR image whose histogram has been altered in accordance with the statistical features of the high-resolution SAR image (Abdikan et al. Citation2014). To create fused multispectral images, modified intensity, hue, and saturation components are returned to the natural domain (Kulkarni and Rege Citation2020). The IHS technique was improved by the Ehlers method.
In Ehlers Fusion
The high-resolution SAR image and the intensity component are filtered using Fourier domain filtering in the Ehlers fusion method after being transformed from a multispectral image into an intensity component using the IHS transform. Low-frequency content is extracted using the intensity component, and high-frequency content is extracted using the SAR image (Ehlers et al. Citation2010; Abdikan et al. Citation2014).
Principal Component Analysis (PCA)
A statistical technique called PCA is used to change correlated variables in data into uncorrelated ones. Most of the spatial features in multispectral bands, which are utilized as input for PCA, are included in the first principal component. The remaining components map spectral data that is particular to various multispectral bands. After matching the high-resolution image’s histogram with the first principal component, the high spatial-resolution image takes the place of the first principal component. Creating the merged multispectral images is an inverse PCA transformation (Chen C et al. Citation2020; Gambardella et al. Citation2021).
Gram-Schmidt (GS) Method
This methodology is a generalization of the fusion strategy based on PCA. Contrary to the PCA, this approach allows the first principal component to be selected at random, and the remaining components are calculated in an orthogonal manner to the first principal component. Initially, a simulated low-resolution SAR band is computed for the integration of high spatial resolution SAR and multispectral data. This band serves as the new orthogonal basis’s first band. The first band (simulated low-resolution SAR) and multispectral bands are subjected to GS processing. The high spatial resolution SAR band is then used to replace the first Gram-Schmidt band, and finally, the inverse GS transformation is employed to create the fused multispectral bands (Ghoniemy et al. Citation2023).
Brovery Transform Normalizes
The multispectral image is enhanced with the appropriate spatial information using the Brovery transform, which normalizes the multispectral bands to be fused and multiplies the normalized bands by a high-resolution band. A high pass filter in the frequency domain is used to filter a high-resolution image in the HPF method. Low-resolution multispectral bands are combined with this HPF-filtered high-resolution image to increase spatial resolution (Chen R Citation2015; Taxak and Singhal Citation2019).
5. Discussion
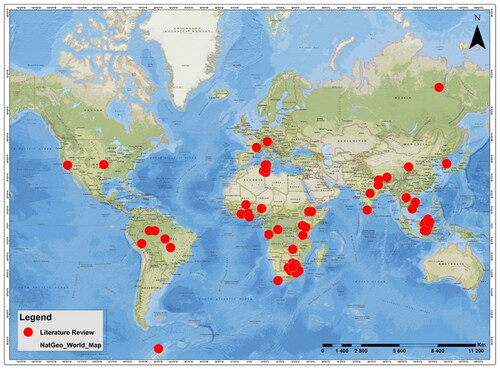
As shown in (), this paper reviewed 78 studies on the fusion of optical and SAR data for land degradation detection and mapping, land use, and land cover assessment over the past 24 years (1998–2022) worldwide. In contrast to our expectations, just 50 studies focused exclusively on land use/land cover classification, and five focused on alien invasive detection and mapping, whereas the majority of studies addressed forest/vegetation monitoring. The potential advantages of fusion for land use analysis were assessed in 32 studies, and the vast majority (28 studies) indicated that fusion enhanced outcomes as compared to using single data sources. A number of studies have also focused on a variety of issues related to vegetation cover, Change detection, and mapping, but the majority of these studies used data fusion to answer some of their target research questions (e.g. using fusion to classify land cover but only using optical or radar data, without Fusion to identify specific land uses). As a result, our study reports on the merged articles’ components and goals. Furthermore, the purpose of this review is to identify the advancements and benefits of data fusion in particular applied to land degradation detection and mapping (including sustainable land management), which is generally difficult to perform using single data sources.
Figure 4. The geographical locations of 78 studies reviewed from (1998–2022) laid across the globe on the use of SAR and optical imagery to assess land cover change (LULCC) and land degradation.
All reviewed studies that were categorized into three spatial scales based on their geographic locations. This includes national, regional, and local levels as it progresses from smaller to larger spatial scales. Local-scale studies were defined as those performed in South Africa; regional-scale studies were defined as those conducted in Sub-Saharan Africa; and national studies were defined as those undertaken on a global scale, e.g. Europe, the United States, Asia, and so on ().
Figure 5. Distribution of study scale against each year (1998–2022).
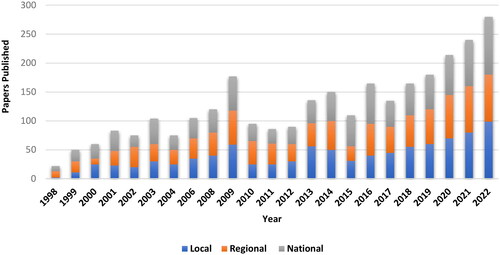
About 80% of the studies were conducted at the local level, while about 16% were conducted at the regional level. Of the remaining studies, only three were conducted at the national level. It can be observed that the number of studies from 2009 was very small and they were mostly carried out at the local level, while only one of these studies was carried out at the regional level. In the period 2013, especially in the last few years from 2018, there was a boom in research publications on forest assessment using remote sensing. Five local scales, two regional scales, and one national scale have already been published in 2020, showing an increasing trend in studies that include spatial forest assessments.
Due to improvements in data processing methodologies, research in the field of SAR and optical image fusion is currently moving in a number of areas (Kulkarni and Rege Citation2020). Deep learning may be used to combine remote sensing data like SAR and optical pictures because of its strong capabilities in feature extraction and data encoding. Ghoniemy et al. (Citation2023) propose a hybrid pixel-level image fusion method for integrating panchromatic (PAN), multispectral (MS), and SAR images.
The multi-stage guided filter (MGF) for optical image pansharpening is used to achieve high spatial detail preservation, and the nested Gram-Schmidt (GS) and Curvelet-Transform (CVT) methods for SAR and optical images, are used to improve the quality of the final fused image and take advantage of the SAR image properties. Deep learning techniques need a lot of training data, which is difficult to gather for remote sensing applications, especially for SAR imaging. Zhang R et al. (Citation2020) propose a novel feature-level fusion framework, in which the Landsat operational land imager (OLI) images with different cloud covers and a fully polarized Advanced Land Observing Satellite-2 (ALOS-2) image are selected to conduct LULC classification experiments. Meraner et al. Citation2020 propose a deep residual neural network to remove clouds from multispectral Sentinel-2 imagery and SAR-optical images. Schmitt, Hughes, and Zhu (Citation2018) have published a huge training dataset namely SEN1-2 to promote research in SAR-optical image fusion using deep learning approaches.
This dataset consists of pairs of SAR and optical image patches, collected across the globe and throughout all seasons (Figure 7.2). Zhang P, Ban, et al. (Citation2021) investigated continuous learning of U-Net by exploiting both Sentinel-1 SAR and Sentinel-2 MSI time series for increasing the frequency and accuracy of wildfire progression mapping. Zhao et al. (Citation2020) proposed deep learning of a novel strategy to learn the relationship between optical and SAR time series based on the sequence of contextual information.
Zhao et al. (Citation2022) propose a new deep-learning model called Deep-CroP framework to improve the alignment between satellite and ground observations on crop phenology. The findings of this experiment on selected ground sites demonstrate that the proposed Deep-CroP is able to accurately identify crop phenology and narrow the discrepancies from 30+ days to as high as several days. Adeli et al. (Citation2021) investigated the capability of L-band simulated NISAR data for wetland mapping in Yucatan Lake, Louisiana, using two object-based machine-learning approaches: Support vector machine (SVM) and random forest (RF). L-band Unmanned Aerial Vehicle SAR (UAVSAR) data were exploited as a proxy for NISAR data. This helps in improving the interpretability of SAR imagery, which is not facilitated by conventional SAR- optical fusion algorithms. Apart from that, other researchers have presented feature and decision-level fusion algorithms based on deep learning (Reiche et al. Citation2013; Rajah et al. Citation2018; Zhang R et al. Citation2020).
5.1. Applications of remote sensing
The use of remotely sensed imagery in LD and SLM detection and mapping has attracted much attention over recent decades, and could significantly contribute to reliable and accurate information relating to the detection and mapping of LD and the effectiveness of SLM practices (). Remote sensing technology offers a unique opportunity to detect and map LD and SLM practices in semi-arid areas. However, few studies have examined Optical and SAR data for detecting and mapping land degradation and the impacts of SLM practices (Nzuza et al. Citation2021). Medium-resolution satellite imagery, such as Landsat, has long been used to map tropical forest disturbances. However, the spatial resolution of Landsat (30 m) has frequently been regarded as too coarse for reliably mapping small-scale selective logging (Zhang S et al. Citation2019).
Figure 6. Percentage of the application of remote sensing for the 78 reviewed studies.
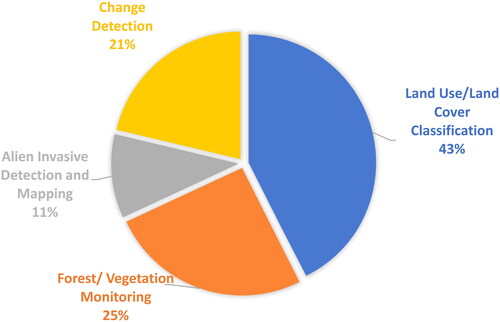
Much of the current literature has shown the advantages of using a range of satellite imagery for the detection and mapping of Land Use and Land Cover Change (LULCC) with reasonable accuracy (Jabbar and Chen Citation2008; Faour Citation2014; Mitri et al. Citation2014; Al Saleh et al. Citation2019; Selvaraj and Nagarajan Citation2021). Satellite specifications have always affected producing trustworthy and precise spatial distribution maps. According to Rajah (Citation2018), researchers must choose between spatial extent (swath width), spectral resolution (i.e. number of bands), spatial resolution (pixel size), and temporal resolution when using remotely sensed data (re-visit time).
Earth Observation (EO) technology currently offers a wide range of airborne and spaceborne sensors that provide a huge variety of remotely sensed data (Schmidt et al. Citation2018). The abundance and advancements in remote sensing satellite technology have the potential to improve detection and mapping accuracy (Rajah Citation2018). For instance, the European Union, through its first Earth Observation (EO) programme Copernicus, launched the Sentinel-1 (S1) and Sentinel-2 (S2) satellites (Rajah et al. Citation2018). Sentinel-1 (S1) is a SAR sensor with unprecedented 250 km2 SAR imagery in single and dual polarization, while Sentinel-2 (S2) is a multispectral optical sensor with 290 km2 optical imagery in 13 optical bands. (Ramoelo et al. Citation2015; Rajah Citation2018). According to (Ramoelo et al. Citation2015; Rajah Citation2018; Reiche et al. Citation2018; Schmidt et al. Citation2018; Das et al. Citation2019; Nazarova et al. Citation2020; Ritse et al. Citation2020), the tandem operation and unique characteristics of these two satellites have established a new paradigm for remote sensing applications (Rajah Citation2018; Schmidt et al. Citation2018; Sharma et al. Citation2021) also argue that the timely launch of S1 and S2 may increase the applicability of remote sensing-based approaches for practical environmental monitoring and mapping tasks.
The synergistic potential of multi-source remotely sensed imagery (for example Sentinel-1 SAR and Landsat-8 OLI Optical imagery) could potentially improve the analysis of LD and accuracies associated with mapping the spatial distributions (Dimov et al. Citation2016; Rajah Citation2018; Kulkarni and Rege Citation2020; Zhang R et al. Citation2020). SAR sensors operate at longer wavelengths and provide complimentary information relating to shape, moisture, and roughness, information not provided by optical imagery alone (Zhou et al. Citation2019). Since multispectral optical imagery records surface information regarding reflectance and emissivity characteristics, while SAR imagery captures the structure and dielectric properties of earth surface materials (Wang L et al. Citation2020; Euillades et al. Citation2021), studies have suggested that the synergistic potential and complementarity of optical and SAR imagery has potential to cost-effectively improve vegetation classification accuracies (Schmidtlein et al. Citation2010). Whereas the technique has been successfully applied in the computer vision, medical imaging, and defence security realms (Du et al. Citation2016; Leal and Paiva Citation2019; Arnal and Mayzel Citation2020; Li et al. Citation2021). Studies on the fusion of optical and SAR imagery for the detection and mapping of LD and SLM practices are limited. Remote sensing image fusion seeks to combine information from multiple sources to achieve inferences that are not feasible from a single sensor or source. The approach seeks to integrate different data in order to obtain more information that can be derived from each of the single sensor data alone. Multi-sensor image fusion is widely recognized as an efficient tool for improving overall performance in image-based applications. Abdikan et al. (Citation2014); Rajah et al. (Citation2018) and Zhang R et al. (Citation2020) consider image fusion as the best option for the integration of information collected from different imaging sensors at varying spectral, spatial, and temporal resolutions. Sentinel-1 and Sentinel-2 imagery provides a unique opportunity to investigate the synergistic potential of new-age optical imagery fused with SAR imagery for invasive alien species detection and mapping. The freely available nature of S1 and S2 imagery, coupled with their large swath widths, short re-visit time, and unprecedented spectral and spatial resolutions offers valuable cost-effective data for invasive alien species detection at both local and regional spatial extents. This paper examines and discusses the need for a Fusion Framework of Optical Sensors and Synthetic Aperture Radar (SAR) Imagery to detect and map land degradation in drylands.
5.1.1. Land use/land cover classification
Human-induced land use and land cover change (LULC) is a significant contributor to global environmental change (Joshi et al. Citation2016; Dourado et al. Citation2019; Chetia et al. Citation2020). Understanding LULC processes is critical for more sustainable land management and will help global initiatives such as reducing emissions from deforestation and forest degradation (REDD+) (Joshi et al. Citation2016). Remote sensing data is critical for classifying LULC information from various sensors with diverse spectral, spatial, and temporal resolutions (Zhang R et al. Citation2020). To date, several studies have investigated, a fusion of multi-sensor remote sensing data, such as SAR data with visible infrared and optical data, which improves classification accuracy and is useful in distinguishing different types of classes that are indistinguishable in optical data due to similar absorption spectrum of land features (Kulkarni and Rege Citation2020; Zhang R et al. Citation2020).
5.1.1.1. Forest/vegetation monitoring
Forest ecosystems provide critical and diverse services and values to human society. Human exploitation of the environment and natural disasters like fires have led to significant deforestation. (Kulkarni and Rege Citation2020). Detecting and monitoring changes in forest cover and its drivers has become an essential component of international forest management as it aids in decision-making and policy development (Rotich and Ojwang Citation2021). Cloud cover remains a problem in the tropics, as does quantifying forest degradation (Joshi et al. Citation2015). One of the best remote sensing technologies for monitoring forests is data fusion since it combines the complimentary information from optical and SAR sensors (Kulkarni and Rege Citation2020). Recent studies have shown the advantages of fusing SAR and optical data for diverse applications in forest monitoring (Lehmann et al. Citation2012; van Beijma et al. Citation2014; Barrett et al. Citation2016; Lindquist and D’Annunzio Citation2016; Abdikan Citation2018; Reiche et al. Citation2018, Citation2013; Hermosilla et al. Citation2019; Koyama et al. Citation2019; Mercier et al. Citation2019; Nazarova et al. Citation2020; Rotich and Ojwang Citation2021; Zimbres et al. Citation2021).
5.1.2. Alien invasive detection and mapping
Understanding the spatial distribution patterns and processes of biological invasions may be important since they are thought to be a major cause of grassland ecosystem and biodiversity degradation. The traditional field-based survey method of monitoring, detecting, and collating spatial distributions of invasive alien plant species is time-consuming and expensive. Therefore, an accurate assessment approach is required, which can be obtained through the use of remote sensing, which provides numerous opportunities. Mapping alien invasion was originally based on aerial photographs. However, this is expensive, has small coverage, and is based on interpretation, which leads to problems in repeatability (Rajah et al. Citation2018; Masemola et al. Citation2019). With recent developments in spatial and spectral properties of sensors and improvements in classification algorithms, remote sensing data is increasingly being used to develop maps of biological invasions (Rajah et al. Citation2018). It has been demonstrated experimentally that multi-source remotely sensed imagery, such as S-1 SAR and L8 Optical, has the potential to improve the accuracies associated with mapping alien invasive spatial distributions (Rajah Citation2018; Masemola et al. Citation2019). However, studies on the fusion of optical and SAR imagery for the detection and mapping of invasive alien species’ spatial distribution are limited.
For instance, in South Africa’s Free State Province, a synergistic combination of Synthetic Aperture Radar (SAR) (Sentinel-1) and optical (Sentinel-2) Earth observation data was used to map the distribution of the Slangbos shrub (Seriphium plumosum). The model results confirm field observations that Slangbos encroachment has the greatest impact on pastures. Spatial cross-validation (SpCV) was used to estimate model accuracy, which resulted in approximately 80% classification accuracy for the Slangbos class within each time step (Urban et al. Citation2021).
Using the hyperspectral reflectance of the species throughout the complete range (400–2500 nm), leaves, and canopy, Masemola et al. (Citation2019), compared the spectral distinctiveness of Acacia mearnsii to contemporary native plant species in the South African landscape using a time series analysis. The Nonparametric Random Forest Discriminant Classifier and the Parametric Interval Extended Canonical Variate Discriminant (iECVA-DA) classification models were compared (RF-DA). The ability to discriminate between A. mearnsii and the sampling species was shown to depend heavily on phenology. In comparison to the iECVA-DA, the results demonstrated that the RF classifier detected A. mearnsii with marginally greater accuracy from 92% to 100%.
Spectral analysis of seasonal profiles, image inputs at various resolutions, spectral indices, and auxiliary data was utilized to create image classification products in order to track the spatial dynamics of Prosopis in the North Cape over the past 30 years. Vector analysis and statistical data were utilized to measure the change in distribution, density, and spatial dynamics of Prosopis since 1974 using multitemporal Landsat imagery and a 500 × 500 m point grid. A combined cover density class and the calculation of the areal density per unit (ha) for each biome were used to quantify the fragmentation and change in natural vegetation. According to the findings, the Northern Cape Province’s Prosopis cover reached 1.473 million ha, or 4% of the total land area, in 2007. The research area revealed a high level of accuracy (72%) (Abella et al. Citation2013).
5.1.3. Change detection
Change Detection (CD) in satellite imagery is important for a variety of applications, including geohazard monitoring and building damage assessment (Zhang C et al. Citation2022). Change detection (CD) in satellite images plays a key role in various applications, e.g. geohazard monitoring and building damage assessment. It involves integrating remote sensing images acquired by multiple sensors at different times to detect changes in a phenomenon across time. Multi-temporal and multi-sensor images obtained for a certain area of the Earth provide complimentary information, and combining such data is always advantageous in determining changes in that area. It is vital to ensure that the images under consideration for fusion are captured as quickly as possible when employing fused images for change detection. Using SAR and optical image fusion, several researchers have worked on change detection (Helman et al. Citation2014; Mishra and Susaki Citation2014; Hermosilla et al. Citation2015, Citation2019; Dourado et al. Citation2019; Chirakkal et al. Citation2021).
For instance, in southern France, extreme storm-related damage from heavy surface runoff was mapped using a repeatable change detection approach based on optical and SAR remote sensing. Based on a special training sample from the October 2018 Aude floods, the findings have more than 85% overall detection accuracies detection accuracies of more than 85% on independent validation samples for all three occurrences (Cerbelaud et al. Citation2021). By comparing pixel-wise and object-based classification, Osio et al. (Citation2020) confirm the correlation between vegetation indices derived from optical sensors and backscatter indices from S1-SAR images of the same land cover classes. The study result shows the highest overall accuracy at 94%, and a kappa coefficient of 0.90 (Osio et al. Citation2020).
Landsat and Advanced Land Observing Satellite Phased Array Type L-Band Synthetic Aperture Radar (ALOS PALSAR) data were previously used to assess the accuracy of mapping the savannah land cover types of forested vegetation, grassland, cropland, and bare land that roughly covered 44,000 km2 savannah in southern Africa. The results showed a number of models with good and striking similarities. The model used optical and Synthetic Aperture Radar (SAR) data from both the dry and wet seasons, and had an overall accuracy of 91.1%, an improvement of more than 10% over using the Landsat data alone from the dry season (81.7 2.3%) (Symeonakis et al. Citation2018). SAR models effectively mapped woody cover and achieved equivalent or lower omission and commission errors than optical models but detected other classes with less accuracy. Multiple sensors and seasons improve results and should be the preferred methodological approach for reliable savanna land cover mapping, especially now that Sentinel-1 and Sentinel-2 data are available. Monitoring of land cover in savannas in general and in the savannas of southern Africa in particular, where a number of land cover change processes are associated with the observed land degradation.
6. Conclusion
This paper assesses the current knowledge on a feature-level fusion framework for detecting and mapping land degradation (LD) and enabling sustainable land management (SLM) in semi-arid areas using optical sensors and SAR satellite data. It establishes that the reviewed articles cover four thematic areas namely (1) land use/land cover classification, (2) forest/vegetation monitoring, (3) alien invasive detection and mapping, (4), change detection, and (5) general mapping.
Land degradation will continue to be a challenge if urgent and coordinated action is not taken, and it is likely to increase in the future due to continued population growth, unprecedented consumption, an increasingly globalized economy, and climate change (IPBES Citation2018). New and improved tools and approaches suitable for assessing and monitoring land degradation under different SLM interventions will be essential to guide sustainable land use and management decisions. This paper examines a feature-level fusion framework using optical sensors with SAR imagery to detect and map land degradation and promote sustainable land management in semi-arid regions. In addition to various fusion methods, this paper discusses the importance of SAR and optical image fusion, pixel-level techniques, and major classes of quality metrics for objectively assessing fusion performance. SAR and multispectral sensors orbiting the planet acquire data in various areas of the electromagnetic spectrum and provide complimentary information about the area being imaged. For this reason, SAR-optical image fusion is a widely discussed topic in remote sensing research.
The main challenges in this area are spatial/spectral distortions and misregistration. Despite the challenges mentioned earlier in this section, due to the need for SAR and optical image fusion discussed in previous sections, this type of fusion is the way of the future for various remote sensing applications. Fusion such as component substitution methods and component hybrid approaches are discussed under the recent trends section. Fusion approaches that combine directional multiscale decomposition and component substitution methods produce a better-fused product than single methods. A review of the existing literature reveals that various approaches to combining SAR and optical images have been developed for various remote sensing applications. Due to differences in sensor geometry, polarization, frequency, and resolution, image fusion methods are data set specific and require fine-tuning of the fusion algorithm parameters. Aside from that, there are numerous difficult problems in SAR and optical image fusion, including image registration with multiple sensors, noise in source images, and computational complexity. With the launch of various microwave and optical remote sensing satellites that offer higher resolutions, the fusion of SAR and optical images remains an active area that will be useful for a variety of remote sensing applications. The findings of this review show that the use of SAR and optical image fusion approaches to detect and map land degradation and promote sustainable land management in semi-arid regions has not been fully explored. The findings of this review will contribute to a better understanding of the applications of SAR-optical image fusion in southern Africa’s severely degraded drylands.
Acknowledgments
The authors gratefully acknowledge the valuable support, guidance, positive critics, and review of the manuscript by my supervisors Professor Emma Archer and Professor Abel Ramoelo both of the University of Pretoria (UP), Faculty of Natural and Agricultural Sciences. Extreme gratitude also goes to God, the giver of life, and the source of wisdom and understanding.
Disclosure statement
No potential conflict of interest was reported by the author(s).
References
- Abdikan S, Balik Sanli F, Sunar F, Ehlers M. 2014. A comparative data-fusion analysis of multi-sensor satellite images. Int J Digital Earth. 7(8):671–687. doi: 10.1080/17538947.2012.748846.
- Abdikan S. 2018. Exploring image fusion of ALOS/PALSAR data and LANDSAT data to differentiate forest area. Geocarto International. 33(1):21–37. doi: 10.1080/10106049.2016.1222635.
- Abella SR, Craig DJ, Smith SD, Newton AC, Bardgett RD, Bowman WD, Kaufmann R, Schmidt SK, Berg V, Den Africa S, et al. 2013. Catalysing natural forest restoration on degraded tropical landscapes. S Afr J Geomatics. 2(2):1–17.
- Adeli S, Salehi B, Mahdianpari M, Quackenbush LJ, Chapman B. 2021. Moving toward L-band NASA-ISRO SAR mission (NISAR) dense time series: multipolarization object-based classification of wetlands using two machine learning algorithms. Earth Space Sci. 8(11):e2021EA001742. doi: 10.1029/2021EA001742.
- Ahmed UI, Rabus B, Beg MF. 2020. SAR and optical image fusion for urban infrastructure detection and monitoring. Remote Sensing Technologies and Applications in Urban Environments V. doi: 10.1117/12.2579480.
- Alemu MM. 2016. Sustainable land management. JEP. 07(04):502–506. doi: 10.4236/jep.2016.74045.
- Al Saleh AH, Misak RF, Al Tamimi SA, Al Baker H, Malek MJ. 2019. Characterization and mapping land degradation hotspots in the terrestrial ecosystem of Kuwait. Biomed J Sci Tech Res. 14(1):1–2. doi: 10.26717/bjstr.2019.14.002487.
- Arnal J, Mayzel I. 2020. Parallel techniques for speckle noise reduction in medical ultrasound images. Adv Eng Softw. 148:102867. doi: 10.1016/j.advengsoft.2020.102867.
- Barrett B, Raab C, Cawkwell F, Green S. 2016. Upland vegetation mapping using Random Forests with optical and radar satellite data. Remote Sens Ecol Conserv. 2(4):212–231. doi: 10.1002/RSE2.32.
- Baydogan E, Sarp G. 2022. Urban footprint detection from night light, optical and SAR imageries: a comparison study. Remote Sens Appl Soc Environ. 27:100775. doi: 10.1016/J.RSASE.2022.100775.
- Bedunah DJ, Angerer JP. 2012. Rangeland degradation, poverty, and conflict: how can rangeland scientists contribute to effective responses and solutions? Rangel. Ecol. Manag. 65(6):606–612. doi: 10.2111/REM-D-11-00155.1.
- Belenguer-Plomer MA, Tanase MA, Fernandez-Carrillo A, Chuvieco E. 2019. Burned area detection and mapping using Sentinel-1 backscatter coefficient and thermal anomalies. Remote Sens Environ. 233:111345. doi: 10.1016/j.rse.2019.111345.
- Bindraban PS, van der Velde M, Ye L, van den Berg M, Materechera S, Kiba DI, Tamene L, Ragnarsdóttir KV, Jongschaap R, Hoogmoed M, et al. 2012. Assessing the impact of soil degradation on food production. Curr Opin Environ Sustainability. 4(5):478–488., doi: 10.1016/j.cosust.2012.09.015.
- Bunning S, Woodfine AC, Vallée D. 2016. Informing future interventions for scaling-up sustainable land management. Lessons learned for decision-makers from a review of experiences of the terrafrica strategic investment programme on SLM in sub Saharan Africa (SIP) under the NEPAD – terrafrica partnership. Food Agric Organ Rep. I5621:1–30.
- Cerbelaud A, Roupioz L, Blanchet G, Breil P, Briottet X. 2021. A repeatable change detection approach to map extreme storm-related damages caused by intense surface runoff based on optical and SAR remote sensing: evidence from three case studies in the South of France. ISPRS J Photogramm Remote Sens. 182:153–175. doi: 10.1016/j.isprsjprs.2021.10.013.
- Chen C, He X, Guo B, Zhao X, Chu Y. 2020. A pixel-level fusion method for multi-source optical remote sensing image combining the principal component analysis and curvelet transform. Earth Sci Inform. 13(4):1005–1013. doi: 10.1007/s12145-020-00472-7.
- Chen R. 2015. The analysis of image fusion based on improved Brovery transform. Proceedings of the 2015 International Industrial Informatics and Computer Engineering Conference, 12. doi: 10.2991/iiicec-15.2015.251.
- Cherubin MR, Karlen DL, Cerri C, EP, Franco ALC, Tormena CA, Davies CA, Cerri CC. 2016. Soil quality indexing strategies for evaluating sugarcane expansion in Brazil. PLoS One. 11(3):e0150860. doi: 10.1371/journal.pone.0150860.
- Chetia S, Borkotoky K, Medhi S., Dutta P., Basumatary M. 2020. Land use land cover monitoring and change detection of Tinsukia, India. Int J Innov Technol Exploring Eng. 9(6):502–506. doi: 10.35940/ijitee.f3814.049620.
- Chirakkal S, Bovolo F, Misra AR, Bruzzone L, Bhattacharya A. 2021. A general framework for change detection using multimodal remote sensing data. IEEE J Sel Top Appl Earth Observ Remote Sens. 14:10665–10680. doi: 10.1109/JSTARS.2021.3119358.
- Cui S, Ma A, Zhang L, Xu M, Zhong Y. 2022. MAP-Net: SAR and optical image matching via image-based convolutional network with attention mechanism and spatial pyramid aggregated pooling. IEEE Trans Geosci Remote Sens. 60:1–13. doi: 10.1109/TGRS.2021.3066432.
- Das B, Pal SC, Malik S, Chakrabortty R. 2019. Modeling groundwater potential zones of Puruliya district, West Bengal, India using remote sensing and GIS techniques. Geol Ecol Landscapes. 3(3):223–237. doi: 10.1080/24749508.2018.1555740.
- DEA-NAP. 2018. Second national action programme for South Africa to combat desertification land degradation and the effects of drought (2018-2030). Available from https://www.dffe.gov.za/sites/default/files/docs/nap_desertification_land_degradation_droughteffects.pdf
- Deepthy Mary A, Hepzibah Christinal A, Abraham Chandy D, Singh A, Pushkaran M. 2020. Speckle noise suppression in 2D ultrasound kidney images using local pattern based topological derivative. Pattern Recognit Lett. 131:49–55. doi: 10.1016/j.patrec.2019.12.005.
- Dimov D, Kuhn J, Conrad C. 2016. Assessment of cropping system diversity in the Fergana Valley through image fusion of Landsat 8 and Sentinel-1. ISPRS Ann Photogramm Remote Sens Spatial Inf Sci. III-7:173–180. doi: 10.5194/isprsannals-III-7-173-2016.
- Dourado GF, Motta JS, Filho ACP, Scott DF, Gabas SG. 2019. The use of remote sensing indices for land cover change detection. Anuário IGEO UFRJ. 42(2):72–85. doi: 10.11137/2019_2_72_85.
- Du Y, Zhang Y, Ling F, Wang Q, Li W, Li X. 2016. Water bodies’ mapping from Sentinel-2 imagery with modified normalized difference water index at 10-m spatial resolution produced by sharpening the SWIR band. Remote Sens. 8(4):354. doi: 10.3390/rs8040354.
- Dubovyk O. 2017. The role of remote sensing in land degradation assessments: opportunities and challenges. Eur J Remote Sens. 50(1):601–613. doi: 10.1080/22797254.2017.1378926.
- Ehlers M, Klonus S, Johan Åstrand P, Rosso P. 2010. Multi-sensor image fusion for pansharpening in remote sensing. Int J Image Data Fusion. 1(1):25–45. doi: 10.1080/19479830903561985.
- Euillades P, Euillades L, Pepe A, Mastro P, Falabella F, Imperatore P, Tang Y, Rosell P. 2021. Recent advancements in multi-temporal methods applied to new generation SAR systems and applications in South America. J South Am Earth Sci. 111:103410. doi: 10.1016/j.jsames.2021.103410.
- Faour G. 2014. Detection and mapping of long-term land degradation and desertification in Arab region using MODESERT. Lebanese Sci J. 15(2):119–131.
- Gambardella C, Parente R, Ciambrone A, Casbarra M. 2021. A principal components analysis-based method for the detection of cannabis plants using representation data by remote sensing. Data. 6(10):108. doi: 10.3390/data6100108.
- Garcia RA, Hedley JD, Tin HC, Fearns PRCS. 2015. A method to analyze the potential of optical remote sensing for benthic habitat mapping. Remote Sens. 7(10):13157–13189. doi: 10.3390/rs71013157.
- Ghoniemy TM, Hammad MM, Amein AS, Mahmoud TA. 2023. Multi-stage guided-filter for SAR and optical satellites images fusion using Curvelet and Gram Schmidt transforms for maritime surveillance. Int J Image Data Fusion. 14(1):38–57. doi: 10.1080/19479832.2021.2003446.
- Gonzalez-Roglich M, Zvoleff A, Noon M, Liniger H, Fleiner R, Harari N, Garcia C. 2019. Synergizing global tools to monitor progress towards land degradation neutrality: trends. Earth and the World Overview of Conservation Approaches and Technologies sustainable land management database. Environ Sci Policy. 93:34–42. doi: 10.1016/j.envsci.2018.12.019.
- Helman D, Mussery A, Lensky IM, Leu S. 2014. Detecting changes in biomass productivity in a different land management regimes in drylands using satellite-derived vegetation index. Soil Use Manage. 30(1):32–39. doi: 10.1111/sum.12099.
- Hermosilla T, Wulder MA, White JC, Coops NC, Hobart GW. 2015. Regional detection, characterization, and attribution of annual forest change from 1984 to 2012 using Landsat-derived time-series metrics. Remote Sens Environ. 170:121–132. doi: 10.1016/j.rse.2015.09.004.
- Hermosilla T, Wulder MA, White JC, Coops NC. 2019. Prevalence of multiple forest disturbances and impact on vegetation regrowth from interannual Landsat time series (1985–2015). Remote Sens Environ. 233:111403. doi: 10.1016/j.rse.2019.111403.
- Heydari SS, Mountrakis G. 2018. Effect of classifier selection, reference sample size, reference class distribution and scene heterogeneity in per-pixel classification accuracy using 26 Landsat sites. Remote Sens Environ. 204:648–658. doi: 10.1016/j.rse.2017.09.035.
- Hillmer H, Woidt C, Istock A, Kobylinskiy A, Nguyen DT, Ahmed N, Brunner R, Kusserow T. 2021. Role of nanoimprint lithography for strongly miniaturized optical spectrometers. Nanomaterials. 11(1):164. doi: 10.3390/nano11010164.
- Hua M, Chen Y, Zhang T, Zhou M, Zou W, Wu J. 2022. A speckle noise suppression method in phase-only holographic display based on an improved Gerchberg–Saxton algorithm. Optik. 251:168407. doi: 10.1016/j.ijleo.2021.168407.
- Hughes LH, Marcos D, Lobry S, Tuia D, Schmitt M. 2020. A deep learning framework for matching of SAR and optical imagery. ISPRS J Photogramm Remote Sens. 169:166–179. doi: 10.1016/j.isprsjprs.2020.09.012.
- IPBES. 2018. The IPBES assessment report on land degradation and restoration. In: Montanarella L, Scholes R, Brainich A, editors. Secretariat of the intergovernmental science-policy platform on biodiversity and ecosystem services. Bonn, Germany: Zenodo; p. 1–744. doi: 10.5281/zenodo.3237392.
- Jabbar M, Chen X. 2008. Land degradation due to salinization in arid and semi-arid regions with the aid of geo-information techniques. Geo-Spatial Inform Sci. 11(2):112–120. doi: 10.1007/s11806-008-0013-z.
- Jeong W, Son K, Cho J, Yang H, Park NC. 2019. Suppression algorithm of speckle noise for parallel phase-shift digital holography. Opt Laser Technol. 112:93–100. doi: 10.1016/j.optlastec.2018.10.053.
- Jin Y, Dollevoet R, Li Z. 2022. Numerical simulation and characterization of speckle noise for laser Doppler vibrometer on moving platforms (LDVom). Opt Lasers Eng. 158:107135. doi: 10.1016/j.optlaseng.2022.107135.
- Joshi N, Baumann M, Ehammer A, Fensholt R, Grogan K, Hostert P, Jepsen MR, Kuemmerle T, Meyfroidt P, Mitchard ETA, et al. 2016. A review of the application of optical and radar remote sensing data fusion to land use mapping and monitoring. Remote Sens. 8(1):70. doi: 10.3390/rs8010070.
- Joshi N, Mitchard ETA, Woo N, Torres J, Moll-Rocek J, Ehammer A, Collins M, Jepsen MR, Fensholt R. 2015. Mapping dynamics of deforestation and forest degradation in tropical forests using radar satellite data. Environ Res Lett. 10(3):034014. doi: 10.1088/1748-9326/10/3/034014.
- Karaoğlu O, Bilge HŞ, Uluer İ. 2022. Removal of speckle noises from ultrasound images using five different deep learning networks. Eng Sci Technol Int J. 29:101030. doi: 10.1016/j.jestch.2021.06.010.
- Karimi N, Taban MR. 2021. A convex variational method for super resolution of SAR image with speckle noise. Signal Process Image Commun. 90:116061. doi: 10.1016/j.image.2020.116061.
- Khare S, Kaushik P. 2021. Speckle filtering of ultrasonic images using weighted nuclear norm minimization in wavelet domain. Biomed Signal Process Control. 70:102997. doi: 10.1016/j.bspc.2021.102997.
- Koyama CN, Watanabe M, Hayashi M, Ogawa T, Shimada M. 2019. Mapping the spatial-temporal variability of tropical forests by ALOS-2 L-band SAR big data analysis. Remote Sens Environ. 233:111372. doi: 10.1016/j.rse.2019.111372.
- Kulkarni SC, Rege PP. 2020. Pixel level fusion techniques for SAR and optical images: a review. Information Fusion. 59:13–29. doi: 10.1016/j.inffus.2020.01.003.
- Kumar V, Kumar Dubey A, Gupta M, Singh V, Butola A, Singh Mehta D. 2021. Speckle noise reduction strategies in laser-based projection imaging, fluorescence microscopy, and digital holography with uniform illumination, improved image sharpness, and resolution. Opt Laser Technol. 141:107079. doi: 10.1016/j.optlastec.2021.107079.
- Lal R. 2015. Restoring soil quality to mitigate soil degradation. Sustain. Times. 7(5):5875–5895. doi: 10.3390/su7055875.
- Leal AS, Paiva HM. 2019. A new wavelet family for speckle noise reduction in medical ultrasound images. Measurement. 140:572–581. doi: 10.1016/j.measurement.2019.03.050.
- Lehmann EA, Caccetta PA, Zhou ZS, McNeill SJ, Wu X, Mitchell AL. 2012. Joint processing of landsat and ALOS-PALSAR data for forest mapping and monitoring. IEEE Trans Geosci Remote Sens. 50(1):55–67. doi: 10.1109/TGRS.2011.2171495.
- Li D, Yu W, Wang K, Jiang D, Jin Q. 2021. Speckle noise removal based on structural convolutional neural networks with feature fusion for medical image. Signal Process Image Commun. 99:116500. doi: 10.1016/j.image.2021.116500.
- Li D. 2017. Remote sensing image fusion: a practical guide. Geo-Spatial Inform Sci. 20(1):56–56. doi: 10.1080/10095020.2017.1288843.
- Liedtke CE, Growe S. 2001. Knowledge-based concepts for the fusion of multisensor and multitemporal aerial images. Lecture notes in computer science (including subseries lecture notes in artificial intelligence and lecture notes in bioinformatics) Vol. 2032. doi: 10.1007/3-540-45134-x_14.
- Lindquist EJ, D’Annunzio R. 2016. Assessing global forest land-use change by object-based image analysis. Remote Sens. 8(8):678. doi: 10.3390/rs8080678.
- Liniger H, Harari N, van Lynden G, Fleiner R, de Leeuw J, Bai Z, Critchley W. 2019. Achieving land degradation neutrality: the role of SLM knowledge in evidence-based decision-making. Environ Sci Policy. 94:123–134. doi: 10.1016/j.envsci.2019.01.001.
- Masemola C, Cho MA, Ramoelo A. 2019. Assessing the effect of seasonality on leaf and canopy spectra for the discrimination of an alien tree species, Acacia mearnsii, from co-occurring native species using parametric and nonparametric classifiers. IEEE Trans Geosci Remote Sens. 57(8):5853–5867. doi: 10.1109/TGRS.2019.2902774.
- Meadows ME, Hoffman MT. 2002. The nature, extent and causes of land degradation in South Africa: legacy of the past, lessons for the future? Area. 34(4):428–437. doi: 10.1111/1475-4762.00100.
- Meraner A, Ebel P, Zhu XX, Schmitt M. 2020. Cloud removal in Sentinel-2 imagery using a deep residual neural network and SAR-optical data fusion. ISPRS J Photogramm Remote Sens. 166:333–346. doi: 10.1016/J.ISPRSJPRS.2020.05.013.
- Mercier A, Betbeder J, Rumiano F, Baudry J, Gond V, Blanc L, Bourgoin C, Cornu G, Ciudad C, Marchamalo M, et al. 2019. Evaluation of Sentinel-1 and 2 time series for land cover classification of forest-agriculture mosaics in temperate and tropical landscapes. Remote Sens. 11(8):979. doi: 10.3390/rs11080904.
- Mirzabaev A, Nkonya E, von Braun J. 2015. Economics of sustainable land management. Curr Opin Environ Sustainability. 15:9–19. doi: 10.1016/j.cosust.2015.07.004.
- Mishra B, Susaki J. 2014. Optical and SAR data integration for automatic change pattern detection. ISPRS Ann Photogramm Remote Sens Spatial Inf Sci. II-7:39–46. doi: 10.5194/isprsannals-II-7-39-2014.
- Mitri G, Nader M, Van der Molen I, Lovett J. 2014. Evaluating exposure to land degradation in association with repetitive armed conflicts in North Lebanon using multi-temporal satellite data. Environ Monit Assess. 186(11):7655–7672. doi: 10.1007/s10661-014-3957-5.
- Mussa M, Teka H, Mesfin Y. 2017. Land use/cover change analysis and local community perception towards land cover change in the lowland of Bale rangelands, Southeast Ethiopia. Int J Biodiver Conserv. 9(12):363–372.
- Nakano N, Hangai M, Nakanishi H, Mori S, Nukada M, Kotera Y, Ikeda HO, Nakamura H, Nonaka A, Yoshimura N. 2011. Macular ganglion cell layer imaging in preperimetric glaucoma with speckle noise-reduced spectral domain optical coherence tomography. Ophthalmology. 118(12):2414–2426. doi: 10.1016/J.OPHTHA.2011.06.015.
- Nazarova T, Martin P, Giuliani G. 2020. Monitoring vegetation change in the presence of high cloud cover with sentinel-2 in a lowland tropical forest region in Brazil. Remote Sens. 12(11):1829. doi: 10.3390/rs12111829.
- Nigussie Z, Tsunekawa A, Haregeweyn N, Adgo E, Nohmi M, Tsubo M, Aklog D, Meshesha DT, Abele S. 2017. Factors influencing small-scale farmers’ adoption of sustainable land management technologies in north-western Ethiopia. Land Use Policy. 67:57–64. doi: 10.1016/j.landusepol.2017.05.024.
- Nkonya E, Mirzabaev A, von Braun J. 2015. Economics of land degradation and improvement - a global assessment for sustainable development. Cham: Springer. doi: 10.1007/978-3-319-19168-3.
- Nkonya E, von Braun J, Mirzabaev A, Le QB, Kwon HY, Kirui O. 2013. Economics of land degradation initiative: methods and approach for global and national assessments. SSRN J. ZEF - Discussion Papers on Development Policy No. 183. doi: 10.2139/ssrn.2343636.
- Nzuza P, Ramoelo A, Odindi J, Kahinda JM, Madonsela S. 2021. Predicting land degradation using Sentinel-2 and environmental variables in the Lepellane catchment of the Greater Sekhukhune District, South Africa. Phys Chem Earth. 124:102931. doi: 10.1016/j.pce.2020.102931.
- Ochoa PA, Fries A, Mejía D, Burneo JI, Ruíz-Sinoga JD, Cerdà A. 2016. Effects of climate, land cover and topography on soil erosion risk in a semiarid basin of the Andes. Catena. 140:31–42. doi: 10.1016/j.catena.2016.01.011.
- Osio A, Pham MT, Lefèvre S. 2020. Spatial processing of sentinel imagery for monitoring of acacia forest degradation in Lake Nakuru Riparian Reserve. ISPRS Ann Photogramm Remote Sens Spatial Inf Sci. V-3-2020(3):525–532. doi: 10.5194/isprs-annals-V-3-2020-525-2020.
- Park SE, Jung YT, Kim HC. 2022. Monitoring permafrost changes in central Yakutia using optical and polarimetric SAR data. Remote Sens Environ. 274:112989. doi: 10.1016/j.rse.2022.112989.
- Rajah P, Odindi J, Mutanga O. 2018. Feature level image fusion of optical imagery and Synthetic Aperture Radar (SAR) for invasive alien plant species detection and mapping. Remote Sens Appl: Soc Environ. 10:198–208. doi: 10.1016/j.rsase.2018.04.007.
- Rajah P. 2018. The integration of freely available medium resolution optical sensors with Synthetic Aperture Radar (SAR) imagery capabilities for American bramble (Rubus cuneifolius) invasion detection and mapping. Available from https://researchspace.ukzn.ac.za/handle/10413/18104
- Ramoelo A, Cho MA, Mathieu R, Madonsela S, van de Kerchove R, Kaszta Z, Wolff E. 2015. Monitoring grass nutrients and biomass as indicators of rangeland quality and quantity using random forest modelling and WorldView-2 data. Int J Appl Earth Obs Geoinf. 43:43–54. doi: 10.1016/j.jag.2014.12.010.
- Ramoelo A, Stolter C, Joubert D, Cho MA, Groengroeft A, Madibela OR, Zimmermann I, Pringle H. 2018. Rangeland monitoring and assessment: a review. Biodivers Ecol. 6:170–176. doi: 10.7809/b-e.00320.
- Rani K, Sharma R, Stroppiana D, Boschetti M, Azar R, Barbieri M, Collivignarelli F, Gatti L, Fontanelli G, Busetto L, et al. 2017. A short note image fusion techniques. J Indian Soc Remote Sens. 45(1):215–227.
- Reed MS, Buenemann M, Atlhopheng J, Akhtar-Schuster M, Bachmann F, Bastin G, Bigas H, Chanda R, Dougill AJ, Essahli W, et al. 2011. Cross-scale monitoring and assessment of land degradation and sustainable land management: a methodological framework for knowledge management. Land Degrad Dev. 22(2):261–271. doi: 10.1002/ldr.1087.
- Reed MS, Stringer LC, Dougill AJ, Perkins JS, Atlhopheng JR, Mulale K, Favretto N. 2015. Reorienting land degradation towards sustainable land management: linking sustainable livelihoods with ecosystem services in rangeland systems. J Environ Manage. 151:472–485. doi: 10.1016/j.jenvman.2014.11.010.
- Reiche J, Hamunyela E, Verbesselt J, Hoekman D, Herold M. 2018. Improving near-real time deforestation monitoring in tropical dry forests by combining dense Sentinel-1 time series with Landsat and ALOS-2 PALSAR-2. Remote Sens Environ. 204:147–161. doi: 10.1016/j.rse.2017.10.034.
- Reiche J, Souzax CM, Hoekman DH, Verbesselt J, Persaud H, Herold M. 2013. Feature level fusion of multi-temporal ALOS PALSAR and Landsat data for mapping and monitoring of tropical deforestation and forest degradation. IEEE J Sel Top Appl Earth Observ Remote Sens. 6(5):2159–2173. doi: 10.1109/JSTARS.2013.2245101.
- Ritse V, Basumatary H, Kulnu AS, Dutta G, Phukan MM, Hazarika N. 2020. Monitoring land use land cover changes in the Eastern Himalayan landscape of Nagaland, Northeast India. Environ Monit Assess. 192(11):711. doi: 10.1007/s10661-020-08674-8.
- Robertson LD, Davidson A, McNairn H, Hosseini M, Mitchell S, Abelleyra D d, Veron S, Defourny P, Le Maire G, Planells M, et al. 2019. Using dense time-series of C-band SAR imagery for classification of diverse, worldwide agricultural systems. International Geoscience and Remote Sensing Symposium (IGARSS); p. 6231–6234. doi: 10.1109/IGARSS.2019.8898364.
- Rotich B, Ojwang D. 2021. Trends and drivers of forest cover change in the Cherangany hills forest ecosystem, Western Kenya. Global Ecol Conserv. 30:e01755. doi: 10.1016/j.gecco.2021.e01755.
- Salentinig A, Gamba P. 2016. Multiscale multisensor decision level data fusion for urban mapping. 4th International Workshop on Earth Observation and Remote Sensing Applications, EORSA 2016 - Proceedings. doi: 10.1109/EORSA.2016.7552768.
- Sanz MJ, Vente J d, Chotte J-L, Bernoux M, Kust G, Ruiz I, Almagro M, Alloza J-A, Vallejo R, Castillo V, et al. 2017. Sustainable Land Management contribution to successful land-based climate change adaptation and mitigation. A report of the science-policy interface. https://www.unccd.int/sites/default/files/documents/2017-09/UNCCD_Report_SLM_web_v2.pdf.
- Schmidt J, Fassnacht FE, Förster M, Schmidtlein S. 2018. Synergetic use of Sentinel-1 and Sentinel-2 for assessments of heathland conservation status. Remote Sens Ecol Conserv. 4(3):225–239. doi: 10.1002/rse2.68.
- Schmidtlein S, Tichý L, Feilhauer H, Faude U. 2010. A brute‐force approach to vegetation classification. J Veg Sci. 21(6):1162–1171. doi: 10.1111/j.1654-1103.2010.01221.x.
- Schmitt M, Hughes LH, Zhu XX. 2018. THE SEN1-2 dataset for deep learning in SAR-optical data fusion. ISPRS Ann Photogramm Remote Sens Spatial Inf Sci. IV-1(1):141–146. doi: 10.5194/isprs-annals-IV-1-141-2018.
- Selvaraj R, Nagarajan SK. 2021. Land cover change detection from remotely sensed IoT data for assessment of land degradation: a survey. J Info Know Mgmt. 20(supp01):2140011. doi: 10.1142/S0219649221400116.
- Sharma LK, Gupta R, Pandey PC. 2021. Future aspects and potential of the remote sensing technology to meet the natural resource needs. In: Pandey PC, Sharma LK, editors. Advances in remote sensing for natural resource monitoring. Hoboken, NJ: Wiley; p. 445–464. doi: 10.1002/9781119616016.ch22.
- Smith WK, Dannenberg MP, Yan D, Herrmann S, Barnes ML, Barron-Gafford GA, Biederman JA, Ferrenberg S, Fox AM, Hudson A, et al. 2019. Remote sensing of dryland ecosystem structure and function: progress, challenges, and opportunities. Remote Sens Environ. 233:111401., doi: 10.1016/j.rse.2019.111401.
- Stringer LC, Harris A. 2014. Land degradation in Dolj County, Southern Romania: environmental changes, impacts and responses. Land Degrad Dev. 25(1):17–28. doi: 10.1002/ldr.2260.
- Stringer LC, Reed MS. 2007. Land degradation assessment in southern Africa: integrating local and scientific knowledge bases. Land Degrad Dev. 18(1):99–116. doi: 10.1002/ldr.760.
- Symeonakis E, Higginbottom TP, Petroulaki K, Rabe A. 2018. Optimisation of savannah land cover characterisation with optical and SAR data. Remote Sens. 10(4):499. doi: 10.3390/rs10040499.
- Taddese G. 2001. Land degradation: a challenge to Ethiopia. Environ Manage. 27(6):815–824. doi: 10.1007/s002670010190.
- Taxak N, Singhal S. 2019. High PSNR based image fusion by weighted average brovery transform method. Proceedings of 3rd International Conference on 2019 Devices for Integrated Circuit, DevIC 2019. doi: 10.1109/DEVIC.2019.8783400.
- Thomas R, Reed M, Clifton K, Appadurai N, Mills A, Zucca C, Kodsi E, Sircely J, Haddad F, Hagen C, et al. 2018. A framework for scaling sustainable land management options. Land Degrad Dev. 29(10):3272–3284. doi: 10.1002/ldr.3080.
- Thomas R, Reed MS, Clifton K, Services CR, Appadurai N. 2017. Modalities for scaling up sustainable land management and restoration of degraded land. https://repo.mel.cgiar.org/handle/20.500.11766/6590.
- Togliatti K, Hartman T, Walker VA, Arkebauer TJ, Suyker AE, VanLoocke A, Hornbuckle BK. 2019. Satellite L–band vegetation optical depth is directly proportional to crop water in the US Corn Belt. Remote Sens Environ. 233:111378. doi: 10.1016/j.rse.2019.111378.
- Torres L, Becceneri JC, Freitas CC, Sant’Anna SJS, Sandri S. 2016. Learning OWA filters parameters for SAR imagery with multiple polarizations. In: Yang X-S, Papa JP, editors. Bio-inspired computation and applications in image processing. New York: Academic Press; p. 269–284. doi: 10.1016/B978-0-12-804536-7.00012-0.
- Traoré S, Ouattara K, Ilstedt U, Schmidt M, Thiombiano A, Malmer A, Nyberg G. 2015. Effect of land degradation on carbon and nitrogen pools in two soil types of a semi-arid landscape in West Africa. Geoderma. 241-242:330–338. doi: 10.1016/j.geoderma.2014.11.027.
- Tufail R, Ahmad A, Javed MA, Ahmad SR. 2022. A machine learning approach for accurate crop type mapping using combined SAR and optical time series data. Adv Space Res. 69(1):331–346. doi: 10.1016/j.asr.2021.09.019.
- UNCCD. 2017a. Scaling up sustainable land management and restoration of degraded land. Global Land Outlook, March, 25. Available from https://www.unccd.int/resources/publications/scaling-sustainable-land-management-and-restoration-degraded-land
- UNCCD. 2017b. The UNCCD securing life on land. Available from https://catalogue.unccd.int/819_Securing_Life_on_Land_ENG.pdf
- Urban M, Schellenberg K, Morgenthal T, Hirner A, Gessner U, Mogonong B, Zhang Z, Baade J, Collett A, Schmullius C. 2021. Using Sentinel-1 and Sentinel-2 time series for Slangbos mapping in the Free State Province, South Africa. Remote Sens. 13(17):3342.
- van Beijma S, Comber A, Lamb A. 2014. Random forest classification of salt marsh vegetation habitats using quad-polarimetric airborne SAR, elevation and optical RS data. Remote Sens Environ. 149:118–129. doi: 10.1016/j.rse.2014.04.010.
- Varadarajan D, Magnain C, Fogarty M, Boas DA, Fischl B, Wang H. 2022. A novel algorithm for multiplicative speckle noise reduction in ex vivo human brain OCT images. NeuroImage. 257:119304. doi: 10.1016/j.neuroimage.2022.119304.
- Von Maltitz GP, Gambiza J, Kellner K, Rambau T, Lindeque L, Kgope B. 2019. Experiences from the South African land degradation neutrality target setting process. Environ Sci Policy. 101:54–62. doi: 10.1016/j.envsci.2019.07.003.
- Wairiu M. 2017. Land degradation and sustainable land management practices in Pacific Island Countries. Reg Environ Change. 17(4):1053–1064. doi: 10.1007/s10113-016-1041-0.
- Wang F, Krause S, Rembe C. 2022. Signal diversity for the reduction of signal dropouts and speckle noise in a laser-Doppler extensometer. Measurement: Sensors. 22:100377. doi: 10.1016/j.measen.2022.100377.
- Wang L, Diao C, Xian G, Yin D, Lu Y, Zou S, Erickson TA. 2020. A summary of the special issue on remote sensing of land change science with Google earth engine. Remote Sens Environ. 248:112002. doi: 10.1016/j.rse.2020.112002.
- Webb NP, Van Zee JW, Karl JW, Herrick JE, Courtright EM, Billings BJ, Boyd R, Chappell A, Duniway MC, Derner JD, et al. 2017. Enhancing wind erosion monitoring and assessment for US rangelands. Rangelands. 39(3-4):85–96. doi: 10.1016/j.rala.2017.04.001.
- World Bank. 2008. Management land, energy. doi: 10.1596/978-0-8213-7432-0.
- Yin D, Gu Z, Zhang Y, Gu F, Nie S, Feng S, Ma J, Yuan C. 2020. Speckle noise reduction in coherent imaging based on deep learning without clean data. Opt Lasers Eng. 133:106151. doi: 10.1016/j.optlaseng.2020.106151.
- Zeng Y, Núñez A, Li Z. 2022. Speckle noise reduction for structural vibration measurement with laser Doppler vibrometer on moving platform. Mech Syst Sig Process. 178:109196. doi: 10.1016/j.ymssp.2022.109196.
- Zhang C, Feng Y, Hu L, Tapete D, Pan L, Liang Z, Cigna F, Yue P. 2022. A domain adaptation neural network for change detection with heterogeneous optical and SAR remote sensing images. Int J Appl Earth Obs Geoinf. 109:102769. doi: 10.1016/j.jag.2022.102769.
- Zhang G, Song R, Ding B, Zhu Y, Xue H, Tu J, Hang J, Ye X, Xu D. 2021. Laplacian pyramid based non-linear coherence diffusion for real-time ultrasound image speckle reduction. Appl Acoust. 183:108298. doi: 10.1016/j.apacoust.2021.108298.
- Zhang J, Yang J, Zhao Z, Li H, Zhang Y. 2010. Block-regression based fusion of optical and SAR imagery for feature enhancement. Int J Remote Sens. 31(9):2325–2345. doi: 10.1080/01431160902980324.
- Zhang P, Ban Y, Nascetti A. 2021. Learning U-Net without forgetting for near real-time wildfire monitoring by the fusion of SAR and optical time series. Remote Sens Environ. 261:112467. doi: 10.1016/j.rse.2021.112467.
- Zhang R, Tang X, You S, Duan K, Xiang H, Luo H. 2020. A novel feature-level fusion framework using optical and SAR remote sensing images for land use/land cover (LULC) classification in cloudy mountainous area. Appl Sci. 10(8):2928. doi: 10.3390/app10082928.
- Zhang S, Yao L, Sun A, Tay Y. 2019. Deep learning based recommender system: a survey and new perspectives. ACM Comput Surv. 52(1):1–38.
- Zhang W, Xu M. 2019. Translate SAR data into optical image using IHS and wavelet transform integrated fusion. J Indian Soc Remote Sens. 47(1):125–137. doi: 10.1007/s12524-018-0879-7.
- Zhao W, Qu Y, Chen J, Yuan Z. 2020. Deeply synergistic optical and SAR time series for crop dynamic monitoring. Remote Sens Environ. 247:111952. doi: 10.1016/j.rse.2020.111952.
- Zhao W, Qu Y, Zhang L, Li K. 2022. Spatial-aware SAR-optical time-series deep integration for crop phenology tracking. Remote Sens Environ. 276:113046. doi: 10.1016/j.rse.2022.113046.
- Zheng Z, Ma A, Zhang L, Zhong Y. 2021. Deep multisensor learning for missing-modality all-weather mapping. ISPRS J Photogramm Remote Sens. 174:254–264. doi: 10.1016/j.isprsjprs.2020.12.009.
- Zhou X, Zhuo J, Krahenbuhl P. 2019. Bottom-up object detection by grouping extreme and center points. Proceedings of the IEEE/CVF Conference on Computer Vision and Pattern Recognition; p. 850–859.
- Zimbres B, Rodríguez-Veiga P, Shimbo JZ, da Conceição Bispo P, Balzter H, Bustamante M, Roitman I, Haidar R, Miranda S, Gomes L, et al. 2021. Mapping the stock and spatial distribution of aboveground woody biomass in the native vegetation of the Brazilian Cerrado biome. For Ecol Manage. 499:119615. doi: 10.1016/j.foreco.2021.119615.