
 ?Mathematical formulae have been encoded as MathML and are displayed in this HTML version using MathJax in order to improve their display. Uncheck the box to turn MathJax off. This feature requires Javascript. Click on a formula to zoom.
Abstract
Exploring the driving factors behind urban polycentricity is of paramount significance for advancing the implementation of urban polycentric strategies. In this, paper takes 41 cities in the China’s Yangtze River Delta region are taken as the research objects, and the degree of urban polycentricity is measured using non-parametric and social network methods. Then, the geographic probe method is applied to reveal the driving factors of the spatial differentiation of urban polycentricity. The research results showed that (1) the distribution of hot and cold spots of the urban polycentricity index was roughly the same between 2006 and 2015, while and the distribution of hot and cold spots of the urban polycentricity index varied greatly between 2015 and 2020. (2) In 2010, the proportions of the secondary and industry tertiary industries and the topographic relief were the main driving factors of urban polycentricity. By 2020, the population size and topographic relief were the key drivers of urban polycentricity.
1. Introduction
In the context of globalization, increasingly frequent political and economic exchanges have led to the further concentration of economic and labor factors in large cities (Sun and Lv Citation2020). With the continuous expansion of urban space, the traditional monocentric structure is unable to carry the huge economic and social activities brought about by urban sprawl, resulting in problems such as traffic congestion and low utilization of land resources and so on (Brueckner Citation2000; Nechyba and Walsh Citation2004). This has forced cities to take active measures to adjust their spatial structure (Wei and Ewing Citation2018). The polycentric strategy is considered to be an important means of supporting the urban development pattern and releasing the momentum of urban development (Meijers and Burger Citation2010). By spreading the population from the main center to the suburbs and creating several interconnected sub-centers at a certain distance from the main center, it can effectively promote the decentralization of urban functions and mitigate the problems of urban congestion. This has been practiced in various countries (Agarwal et al. Citation2012). Cities in China are currently undergoing rapid urbanization, with an urbanization rate of 65.22% in 2022. The spatial structure of large cities in China is also transforming from monocentric to polycentric in order to meet the practical needs of rapid urban development and increasing population (Cheng and Shaw Citation2018).
Multi-centered versus single-centered is a description of the urban spatial structure that involves multiple dynamic concepts related to geography, socio-economics, and politics. Based Drawing on research by Chinese and international scholars, a multi-centered city can be defined as an agglomeration of two or more focal points within a specific economic functional area. These focal points form a functional system with a collaborative division of labor, balanced development scale, and close interconnections (Wu et al. Citation2016). Polycentricity is the general trend of urban spatial structure development when the scale of the city expands to a certain stage. However, in actual urban spatial structure adjustment, there are obvious spatial differentiation characteristics of urban spatial structure polycentricity. There may also be a transition between single-centralization and multi-centralization trends. In the context of urban studies, Lee explored six major metropolitan areas in the United States and identified three distinct developmental patterns in their urban spatial structure: employment dispersion in Portland and Philadelphia, employment polycentrism in Los Angeles and San Francisco, and employment concentration in New York and Boston (Lee Citation2007). Arribas-Bel et al. conducted a statistical analysis of employment centers in various U.S. metropolitan areas, revealing that 45 of them transitioned from being single-centered to multi-centered, while 35 shifted from multi-centered to single-centered (Arribas-Bel and Sanz-Gracia Citation2014). Similarly, Chinese researchers, including Qin Xianhong, uncovered notable spatial differentiation in the urban spatial structure of Chinese cities (Qin et al. Citation2013). They observed a tendency towards polycentrism in the population distribution of Nanjing. Sun Bindong et al. found distinctive patterns in the employment spatial evolution of Shanghai and Beijing, with Shanghai becoming a polycentric city and Beijing evolving into a single-centered city (Sun and Wei Citation2014). Hence, recognizing the significant spatial disparities in urban spatial structures, numerous scholars have actively investigated the mechanisms influencing urban polycentricity.
Urban polycentricity is the result of the long-term development of urban history. It is characterized by linear development and path dependence. National policies and planning strategies have limited the influence on spatial restructuring (Guo et al. Citation2022). In contrast, local governments can mobilize resources for growth and are also an important force in urban spatial restructuring and optimization (Kong et al. Citation2023). Regarding the essence of multi-centralization, it is a structure of centripetal and centrifugal forces of the agglomeration economy and agglomeration diseconomy. The market self-organization mechanism that can exert an agglomeration effect has an important influence on the urban spatial structure (Sun et al. Citation2013). In general, urban polycentricity is the result of the long-term effects of multiple factors such as the urban history, physical geography, administrative policies, and land use (Agarwal et al. Citation2012; Wu 2020). The same factor may have different or even contradictory influences on cities in different regions, and these multiple factors jointly drive the spatial differentiation of urban polycentricity. More research is needed to explain the driving forces that lead to the spatial differentiation of polycentricity in cities with similar characteristics.
In summary, a proper understanding of the spatial differentiation characteristics of urban multi-centeredness is essential for formulating appropriate policies suitable for different cities with multi-centered structures. Existing studies have identified and measured urban centers and multi-centeredness, but there is a lack of systematic comparisons regarding the dynamic evolution patterns of cities transitioning from single-centered to multi-centered structures, both over time and across regions. Furthermore, the adjustment of the urban spatial structure is an integral part of the urban development process, ultimately manifested in its economic, demographic, and social impacts (Han et al. Citation2020). Therefore, given the widespread implementation of multi-centered strategies in cities, it is necessary to consider the various elements such as economic and social factors, population dynamics, and industrial distribution, in order to explore the driving forces and influencing factors behind the spatial differentiation of urban multi-centeredness. This constitutes the main significance of this study.
The research questions and objectives of this study were to analyze the spatial and temporal differentiation characteristics of urban multi-centeredness in the Yangtze River Delta (YRD) region in China. Additionally, in this study, we aimed to investigate whether factors such as economic, social, and geographical aspects at the city level influence urban multi-centeredness, and whether there are variations due to geographical space and time scales. Therefore, in this study, we took the YRD region as an example to identify urban centers with more accurate LandScan population distribution data, and to calculate the polycentric index of cities from the concept of urban polycentricity by using the social network method. Then,based on the geographic detector model, we explored the driving factors of the spatial differentiation of urban polycentricity in the YRD region, identified the dominant factors of urban polycentricity, and correctly determined the characteristics of urban polycentricity, providing a reference for the implementation of a polycentric strategy.
2. Materials and methods
2.1. Study area
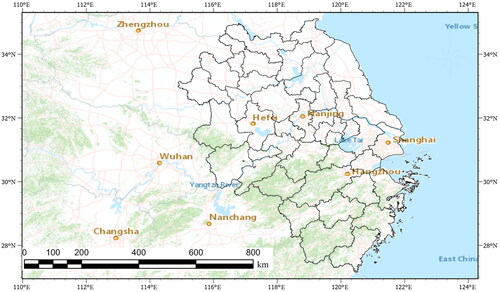
The study area is the YRD region in China, which contains 41 cities, including Shanghai, Nanjing, Hangzhou, and Hefei (). The YRD region is the most rapidly developing region in China and has the highest urbanization rate. As of 2021, the urbanization rate in the YRD region was 71.45%. The acceleration of urbanization has also led to more serious problems such as the waste of land resources, spatial mismatch and urban congestion in the YRD. To achieve healthy and orderly urban development, each city government has successively issued relevant planning policy documents to actively adjust the urban spatial structure and guide the urban spatial structure to achieve multi-centralization. Therefore, conducting research on the cities in the YRD region is beneficial for guiding the development of appropriate urban spatial patterns. Given the varying scales, economic levels, and social development in the region, studying these cities provides a comprehensive sample to explore the factors influencing the spatial differentiation of multi-centeredness. The first objective of this study was to analyze the spatial and temporal differentiation characteristics of the urban multi-centeredness in the YRD region. To achieve this, a relatively long period was selected. Considering the data availability and completeness, the timeframe for this study was 2006 to 2020. The second objective was to investigate whether economic, social, and geographical factors at the city level had an influence on the urban multi-centeredness and whether there were variations due to the geographical space and time scales. Therefore, two key time points were selected to examine whether the influences of the economic, social, and geographical factors on the urban multi-centeredness differed in different years. The year 2010 marks the formal introduction of the policy for integrated development in the YRD region, which led to the conceptualization of the region and had a significant influence on its urban development and planning. The year 2020 represents the most recent data available for this study, and it also allows for a 10-year interval between 2010 and 2020, revealing potential temporal variations in the factors influencing the multi-centeredness. Thus, in this study, the spatial and temporal differentiation characteristics of the urban multi-centeredness in the Yangtze River Delta region from 2006 to 2020, and examines the impact of economic, social, and geographical factors on the multi-centeredness at the city level were examined. The spatial and temporal heterogeneity were considered by using data from 2010 and 2020.
Figure 1. Scope of the study.
2.2. Research methodology
2.2.1. Method of identifying urban centers
We define the urban center as the geographic center of the city’s population, utilizing population distribution data sourced from Landscan. Strictly speaking, this refers to the center of residential population according to the dataset’s specifications. Numerous studies have revealed that there is a stronger alignment between city centers identified based on population data and actual economic or employment centers (Liu and Wang Citation2016; Qiang et al. Citation2023). Therefore, in this paper, uses population distribution data are used to identify city centers. In terms of the specific identification methods, this study employs a non-parametric approach for city center identification is used. In comparison to threshold methods and relative density methods, the non-parametric approach uses locally weighted regression to fit the population density curves, thereby identifying local peaks in the population density as city centers. This approach takes into account the interaction between city centers and surrounding areas, and avoids arbitrary density threshold setting. As a result, it has been widely applied for city center identification (Mcmillen Citation2001).
In this paper, first, we use the local Getis-Ord to identify the population centers. Local spatial autocorrelation can be used to calculate the correlation of a location in space with the same attribute of a neighboring location (Getis and Ord Citation1992). The local Getis-Ord
index, proposed and further modified by Getis and Ord based on local spatial autocorrelation, is a local spatial autocorrelation index based on a distance weight matrix that detects high-value clustering and low- value clustering. The basic principle is that it is used to analyze the degree of aggregation of an attribute value at the local spatial level by calculating the sum of a certain element and its neighboring elements in its surrounding range and comparing it with the sum of all of the elements (Ord and Getis Citation1995, Citation2001). The specific formula is as follows:
(1)
(1)
(2)
(2)
(3)
(3)
where
is the population in the
th spatial unit,
is the total number of elements, and
is the adjacent spatial weight matrix within the distance threshold
When
and
are adjacent to each other,
and vice versa,
The Gi* statistic returned for each element in the dataset is the z-score. When the
score is greater than 0, it means that the spatial unit
forms a high-value spatial aggregation around it; that is, the hot spot area. When
score is less than 0, it means that the spatial unit
forms a low value spatial aggregation around it, that is, it is a cold spot area. At the 5% significance level (
>1.96), the high value population density clustering area is selected as the alternative area of the urban center.
Second, such areas as population centers usually require that a certain scope and population size be met. To filter out the abnormal clustering areas with smaller scopes and populations, and with reference to the actual situation in the YRD region, in this paper, the high-value clustering areas with population densities of greater than 3 people/km2 and populations of number greater than 10,000 in the alternative areas are finally identified as urban centers. The urban center with the highest population is identified as the main center, and the remaining urban centers are defined as secondary centers.
2.2.2. Methods of measuring the urban polycentric index
Urban sub-centers possess two key characteristics: they are located away from the main center and have a certain factor scale level. Therefore, when measuring the multi-centered nature of a city, it is essential to consider both the scale and the distance between the main center and the sub-centers. Specifically, if a sub-center has a larger population size or is located farther away from the main center, its importance is deemed to be higher (Li and Liu Citation2018). Currently, measurements of urban multi-center indices are mainly based on methods that use center hierarchy, modeling, and social network analysis (Liu et al. Citation2016). Compared with the former two methods, the social network-based approach can calculate the importance of a center based on both the scale and distance and can generate a multi-center index by considering the relative importance of all of the sub-centers with respect to the main center. This method has been widely applied in the measurement of urban multi-center characteristics (Dadashpoor et al. Citation2023; Liao et al. Citation2023). In this paper, we adopt an improved social network-based method for calculating the multi-center index, which is based on the research conducted by Li et al. (2018). The specific calculation formulas used in this paper are as follows:
(4)
(4)
(5)
(5)
(6)
(6)
where
is the degree of urban multi-centralization;
is the standard deviation of the importance of each population center within the city; and
is the standard deviation of the importance of urban centers when the city is bi-centric.
is the importance of urban centers, and
is the population size of the center
is the distance between the center
and the main center, and
is the average of the importance of the city center,
is the importance of the main center of the city,
is the population size of the main center of the city, and
is the maximum value of the distance between the main center and the secondary center of the city.
2.2.3. Geographic detector method
The geographical detector model is a tool used to detect and analyze spatial heterogeneity based on the assumption that if there exists a relationship between the variables their spatial distributions should exhibit similarities (Wang and Xu Citation2017). This model is an effective tool for spatial exploratory analysis and has been widely applied in studies involving objects with typical spatial characteristics, such as population growth (Lv et al. Citation2017) and regional development (Ding et al. Citation2014). By detecting the consistency of the spatial distributions of the independent and dependent variables, the geographical detector model can identify the explanatory powers of the independent variables on the dependent variable. Additionally, the geographical detector model does not assume linearity of the relationships and therefore does not require variable standardization, nor does it suffer from collinearity issues.
The geographical detector model consists of four sub-detectors: a risk detector, a factor detector, an ecological detector, and an interaction detector. In this paper, we use the factor detector and interaction detector to study the driving factors behind the spatial differentiation of urban multi-center characteristics. Specifically, the factor detector is used to explore the explanatory power of each independent variable on the spatial differentiation of urban multi-center characteristics (Wang and Xu Citation2017).
(7)
(7)
The larger the -value is, the greater the explanatory power of each variable on the spatial differentiation characteristics of urban polycentricity is. N is the number of cities, and ℎ is the number of detection factor stratification.
is the number of cities within the layer
and
is the variance of the urban polycentricity index in the YRD region, and
is the polycentric index method forthe layer
The interaction detector is mainly used to detect the degree of explanation of the spatial differentiation characteristics of urban polycentricity after the superposition of two independent variables. It can assess the type of influence of the explanatory power of the interactions between factors on the formation of spatial differentiation characteristics of urban polycentricity (Wang and Xu Citation2017).
The degree of polycentricity of the different cities can be influenced by a variety of factors. In this paper, by reviewing the relevant literature and taking into account the data availability, a total of eight potential factors related to the urban economy, population, topography and transportation are selected. The detailed definitions and descriptive statistics of these factors are presented below ():
Table 1. Descriptive statistics of the factors influencing the spatial differentiation of urban polycentricity.
Regarding the urban economy, the economic level of a city can influence the spatial structure of the city by affecting various economic behaviors and their distribution in the urban space (Zhao and Chen Citation2011; Sun et al. Citation2017). In addition, the main economic activities in urban centers mainly originate from secondary and tertiary industries (Han et al. Citation2023). Therefore, in this paper,the total urban gross domestic product (GDP), which represents the economic level of cities, and the proportions of the primary, secondary and tertiary industries, which represent the economic composition of the cities, are select as the primary potential factors influencing the degree of urban polycentricity;
In terms of the urban scale, the scale of the urban population and the scale of the urban built-up areas play an important role in the formation of urban polycentric space. When the urban population reaches 5-10 million, urban traffic congestion and other phenomena will be more prominent and the polycentric spatial structure will be more meaningful (Li et al. Citation2021). Moreover, an increase in the urban population size will lead to expansion of urban boundaries and the prompt formation of urban centers to solve the problem of disorderly sprawl (Li et al. Citation2017). Therefore, in this paper, the urban population size and the urban built-up area size are selected as potential influencing factors.
Regarding urban transportation, the urban transportation infrastructure can influence the aggregation and dispersion of population activities and thus can change the spatial form of a city. Therefore, in this paper, the urban road area per capita is selected as one of the potential factors affecting the urban spatial structure;
Regarding the urban topography, the urban physical geographical conditions are the basis of urban land development and utilization patterns (Guo et al. Citation2022). The mountains and rivers in the city cause fragmented development of the urban landscape and bring about a polycentric and grouped development pattern in some mountainous cities. In this paper, we choose the total topographic relief of the city to characterize the topography of the city as a potential influencing factor of the polycentric urban spatial structure.
2.3. Data
The data used in this paper include population distribution data, socio-economic data, and topographic relief data. (1) Population distribution data: The population distribution data for the YRD region are obtained from the LandScan global population distribution dataset, which is based on method combination of geographic information system (GIS) and remote sensing method and uses data such as population census data, roads, slope, land use, and night lighting data. It is recognized as a relatively authoritative and accurate population spatial dataset and has been widely used to study urban population data (Li 2018). In this paper, we use the administrative boundaries of each city in the YRD region to crop the dataset and obtain the population distribution data for the YRD region. (2) Socio-economic data: The socio-economic data for the YRD region from 2006 to 2020 are primarily obtained from the China Statistical Yearbooks for the corresponding years. The collected data encompass various aspects of 41 cities in the region, including their economic level; proportions of the primary, secondary, and tertiary industries; population size; built-up area; and road area. The economic level of each city is represented by the total GDP for the respective year. The proportions of the primary, secondary, and tertiary industries are derived from the industry composition data in the Statistical Yearbook. The population size is represented by the total resident population of the city in the respective year. The built-up area and road area are both represented by the corresponding statistical areas in the Statistical Yearbook for each city. (3) Topographic relief data: The topographic relief data for the YRD region are obtained from the Chinese topographic relief kilometer grid dataset. This dataset is based on the definition and calculation formula for topographic relief provided by You Zhen et al. who resampled the digital elevation model (Shuttle Radar Topography Mission, SRTM 90 m) data to a 1 km resolution and used the model to calculate a kilometer grid dataset that characterizes the altitude and surface cutting degree of the Chinese region (You 2018).
3. Results
3.1. Preliminary analysis of urban center characteristics
Comparison of the spatial distribution characteristics of the main center population in the cities of the YRD region in 2006 and 2020 reveals that the majority of cities in this region have experienced an increase in the number of main center populations (). In 2020, 31 cities showed an increase in the main center population compared to 2006, indicating that the implementation of their multi-center strategies has yet to yield significant results. Additionally, 10 cities exhibited a decrease in the number of main center populations, indicating the effectiveness of their multi-center strategies.
Figure 2. The comparison of the spatial distribution of the population in the primary center between 2006 and 2020.
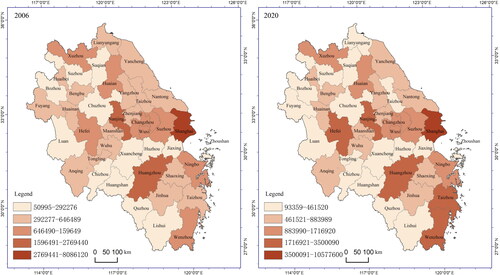
Regarding spatial distribution, cities with a higher number of main center populations are concentrated in the eastern coastal areas and central regions like Nanjing, Hefei, and Hangzhou. These regions are generally economically developed with a higher standard of living. On the other hand, cities with a lower number of main center populations are concentrated in the central and western areas, characterized by larger population sizes but relatively lower economic levels.
Similarly, when comparing the spatial distribution characteristics of the secondary center population in the cities of the YRD region in 2006 and 2020 (), only five cities, namely Wuxi, Wenzhou, Taizhou, Huainan, and Huaibei, experienced a relative decrease in the number of secondary center populations. In contrast, the majority of cities witnessed a significant increase in the relative number of secondary center populations, indicating a trend of population dispersal from the main center to the secondary centers and a growing trend towards multi-center distribution.
Figure 3. The comparison of the spatial distribution of the population in the secondary centers between 2006 and 2020.
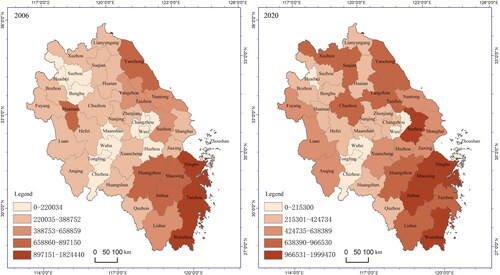
Cities with a higher number of secondary center populations are concentrated in the southeast coastal areas, characterized by diverse topography and higher economic levels. Conversely, cities with a lower number of secondary center populations are focused in central cities like Wuhan and Wuxi, which have relatively flat terrain.
3.2. Analysis of the spatial and temporal distribution characteristics of urban polycentricity
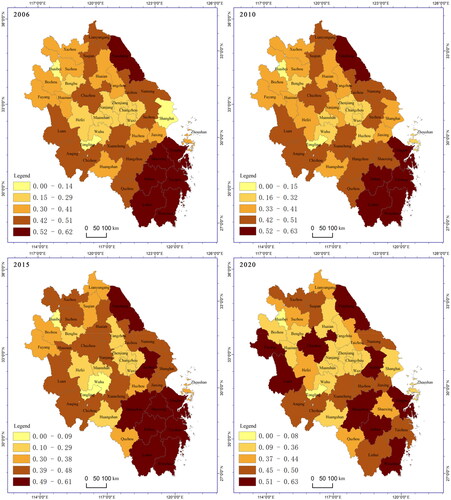
The urban polycentricity index data for 2006, 2010, 2015, and 2020 were selected. The spatial distribution was visualized in five levels using the natural breakpoint method. As can be seen from , that the spatial distribution of the urban polycentricity index in the YRD region varied from year to year. Its spatial distribution characteristics changed significantly between 2006 and 2020, with the spatial distribution of urban polycentricity exhibiting a spatial pattern of high in the southeast and low in the northwest during the period from 2006–2015. During the period 2015–2020, the shift in the trend to high-value areas in the central region of the YRD gradually became obvious, and the urban polycentricity index gradually exhibited a spatial pattern of multi-point dispersal. Specifically, in 2006, the high-value areas of the polycentric index were located in Wenzhou, Taizhou, Jinhua, and other places in the southeastern part of the YRD, and the low-value areas were located in Maanshan, Changzhou, Shanghai, and other places in the central part of the YRD. In 2010, the high-value areas of the polycentric index changed little, and the high-value areas only decreased in Shaoxing city. Similarly, the low-value areas only decreased in Shanghai. In 2015, Suzhou, Hangzhou, and Shaoxing City became high value areas, and Wuhu became a low-value area. Compared with other years, the spatial distribution of the urban polycentricity index in 2020 changed significantly, with the high value areas gradually shifting to the northwest region of the YRD such as Fuyang, Lu’an, and Chuzhou. In contrast, the polycentricity level decreased in Lishui, Taizhou, Quzhou and Shaoxing, while the low-level areas were originally clustered in the southeastern coastal region.
Figure 4. Spatial distribution of urban polycentric index from 2006 to 2020.
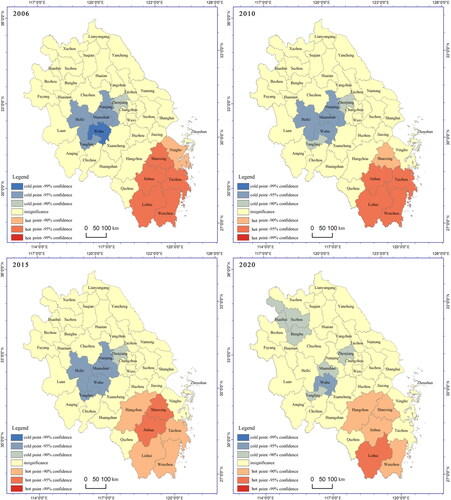
3.3. Analysis of the spatial aggregation characteristics of urban polycentricity
The urban polycentricity index data for 2006, 2010, 2015, and 2020 were selected and visualized using the local Getis-Ord tool in ArcGIS. As can be seen from , the distribution of the cold and hot spots of the urban polycentricity index in the YRD region during the period 2006–2015 was roughly stable. The hot spot areas were mainly distributed in Ningbo, Taizhou, Wenzhou and other cities in the southeast coastal region, indicating that these cities had formed a more stable polycentric spatial structure. The cold spot areas were mainly distributed in Wuhu, Maanshan, Nanjing and other places in the central region of the YRD. These cities were still in the stage of polycentric development of the urban spatial structure. The distribution of the cold and hot spots of the urban polycentric index changed greatly between 2015 and 2020, and only Lishui remained in the hot spot area at the 99% confidence level. The cities in the hot spot area at the 95% confidence level decreased significantly, while there were no cold spot areas at the 99% confidence level, and only Wuhu remained in the cold spot area at the 95% confidence level.
Figure 5. Spatial clustering distribution of the urban polycentric index from 2006 to 2020.
3.4. Analysis of the factors influencing the spatial differentiation of urban polycentricity
3.4.1. Factor detection analysis based on geographic detectors
Factor detectors can be used to quantify the correlation between factors and the spatial differentiation of urban centrality. The higher the q value, the stronger the correlation between the factor and the spatial differentiation of urban centrality. As can be seen from the , in 2010, only the proportion of the secondary industry, the proportion of the tertiary industry and the topographic relief passed the significance test. The correlation of these factors with the spatial differentiation of urban centrality in descending order, were as follows: the proportion of secondary industry (0.465) > the topographic relief (0.453) > the population size (0.415) > the proportion of tertiary industry (0.387). In 2020, both the population size and topographical relief passed the significance test, but their correlation with the spatial distribution of urban polycentricity is slightly weak. However, the correlation between the proportion of secondary and tertiary industries and the spatial distri-bution of urban polycentricity is relatively low and no new factors passed the significance test. The correlation between qualified factors and the spatial differentiation of urban polycentricity, ranked in descending order according to significance test, is as follows: population size (0.362) > topographical relief (0.303). From 2010 to 2020, both population size and topography are significantly correlated with the spatial differentiation of urban polycentricity.
Table 2. Factor detection results for the polycentric spatial differentiation.
The population size was one of the main driving factors of the transition from single-centered to multi-centered cities. One of the main purposes of urban multi-center development is to alleviate the population congestion in the original city center. The continuous expansion of the population size requires more secondary centers to disperse the population from the main center. Therefore, the population size is one of the primary factors influencing the spatial differentiation of urban multi-centers. In addition, the topographical relief, including mountains and rivers, has a significant influence on land use. Cities in mountainous areas, which are influenced by topographic factors, usually have more small-scale secondary centers. Thus, topographic factors also contribute to the spatial differentiation of the urban multi-centers.
The proportion of secondary and tertiary industries is only correlated with the spatial differentiation of urban polycentricity in the year 2010. This may be related to the period of accelerated urbanization and industrialization, during which numerous manufacturing factories and new industrial towns emerged in suburban areas, attracting investment, infrastructure, and population flow to the periphery of the cities. This led to expansion of the city size and a transition from single-centered to multi-centered cities. However, in 2020, as the industrialization in the YRD region slowed down, under the overall industrial structure of the cities already formed, new urban centers were typically established to alleviate traffic congestion in the old center and to promote a better work-life balance. Therefore, during this period, the population size began to replace the industrial structure as the dominant factor driving the spatial differentiation of the urban multi-centers.
3.4.2. Interaction detection analysis based on the geographic detector
Interactive detectors can be used to quantify the correlation between the overlay of two factors and the spatial distribution of urban polycentricity. The higher the q value, the greater the correlation between the interaction of two factors and the spatial dis-tribution of urban polycentricity. As shown in the and , the spatial distribution of urban polycentricity in the YRD region as a whole was the result of the interaction and superposition of multiple factors. The superposition of each factor is dominated by two-factor enhancement and non-linear enhancement. For most factor interactions, the q value is higher than that of individual factors, indicating a stronger corre-lation between the spatial distribution of urban polycentricity and the overlay of multiple factors. The corre-lation resulting from the superposition of multiple factors is higher than that of individual factors. When formulating strategies for urban spatial structure development, it is essential to consider the cumulative effects of multiple factors and to choose a combination of these factors as the driving force behind the development of urban multi-centers, based on the city’s developmental foundation.
Figure 6. Factor interaction detection results of polycentric spatial differentiation in 2010.
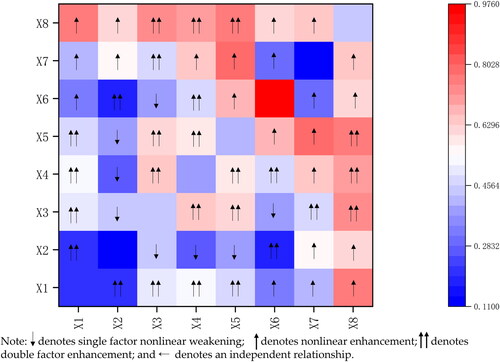
Figure 7. Factor interaction detection results of polycentric spatial differentiation in 2020.
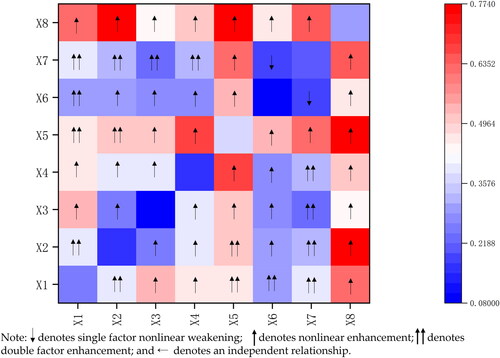
Specifically, in 2010, the average q-value of the interaction between the road area and topographic relief and other factors was larger than the average q-value of the interactions between other factors (), and the interaction between the road area and population size had the highest q-value (0.774). This indicates that the spatial superposition of these two factors played a dominant role in the spatial distribution of urban polycentricity. In 2020, the q-value of the interaction between the topographic relief and other factors was larger than that of the interaction between other factors (), and the q-value of the interaction with population size was the largest (0.774), indicating that the spatial superposition of these two factors played a dominant role in the spatial distribution of urban polycentricity. Therefore, when formulating strategies for the development of the urban spatial structure, the primary consideration should be given to the city’s population size. Additionally, it is advisable to comprehensively consider the city’s topographic and road factors based on its current development status to formulate suitable strategies for multi-center development and to construct urban centers in appropriate locations.
4. Discussion
4.1. Analysis of the spatial differentiation characteristics of urban polycentricity
In this paper, the urban primary and secondary centers in 41 cities in the YRD region from 2006 to 2020 are identified, the urban polycentricity index is calculated based on the spatial distance and population scale of the primary and secondary centers, and analyzes their spatial differentiation characteristics are analyzed. By analyzing the urban polycentric index of the YRD Delta region, it can be found that the urban agglomerations in the YRD region did not start to implement the polycentric strategy on a large scale around 2006. The main characteristics of the rapid urbanization stage at this time were the outward expansion of the urban centers and the massive movement of the rural population to the urban centers. In addition, the cities had not yet experienced the problem of large-scale congestion due to the small scales of most of the urban centers and the underdeveloped transportation system. The problem of large-scale congestion has not yet appeared in the cities. Cities with a more general economic base were more influenced by topographic factors. The populations of the urban sub-centers were higher than the populations of the main centers around 2006. By 2020, the population size of the main center of the city had been significantly reduced. It can be seen that most of the cities had implemented the polycentric strategy, but the polycentric strategy did not achieve the corresponding performance in some cities. The reason for this is that although the new cities in China played the role of population relocation evacuation, the new urban areas usually lacked basic medical and educational facilities and were unable to provide a large enough attraction to the population of the original urban areas, which in reality was not very effective in relocating the population of the original urban areas. A large number of ghost cities emerged (Sun et al. Citation2013). In addition, due to the real estate first approach in the construction of new cities, there was a large surplus of real estate development in the new urban residential land without proper planning. Furthermore, there was a lack of job opportunities for residents, so they had to relocate to the main center to seek jobs. As a result, the new city became a low-activity city (Sun and Pan Citation2008), with a large number of long-distance, pendulum like commutes to each other, further increasing the pressure on the urban transportation system. A new wave of migration to the main urban centers emerged. Therefore, for cities with different economic, demographic and geographic conditions, polycentric strategies need to be carefully selected concerning to the actual development of the city. The application of polycentricity without proper planning will only result in continued urban expansion and housing shortages.
4.2. Analysis of the factors influencing the urban polycentric spatial differentiation characteristics
In this study, geodetectors and analysis were used to identify the factors influencing the spatial differentiation of the multiple centers. The research findings indicated that there were correlations between the multi-center development and the industrial structure, population size, and urban topography, and these correlations exhibited heterogeneity. These findings are supported by a review of the relevant literature.
The population size is one of the main factors influencing the spatial differentiation of urban polycentricity (Anas et al. Citation1998). In related studies, an urban polycentric strategy is usually considered to be an active urban planning strategy when the population scale of a city reaches a certain level. Some scholars have suggested based on empirical studies that when the population of a city is greater than 5 million, more prominent urban problems such as traffic congestion will occur. This is the time when cities should adopt a multi-centered layout to balance the agglomeration economy and commuting costs. Therefore, in 2020, with the general increase in the urban population size in the YRD region, the population size emerged as the dominant factor driving the spatial differentiation of the urban multi-centers.
Topographic factors can have a direct influence on the spatial structure of cities (Li and Liu Citation2018). The literature shows that mountainous cities tend to have more urban centers and their polycentricity index values are usually high (Yang and Qian Citation2014), because mountains and water systems can greatly restrict transportation and communication between regions. For example, Nanjing in China is divided into two parts by the Yangtze River, and the main center is located to the south of the Yangtze River. The secondary center in the north is adjacent to the main center, which is bounded by the Yangtze River, reforming its center at the riverside. Huangshan in China is a typical mountainous city, most of which is located in mountainous areas. The topographic relief is large. Blocked by high mountains, all five urban centers of Huangshan City are established in different basins surrounded by mountains.
The correlation between the industrial structure and urban spatial structure was more significant in the early stage. The YRD region was one of the first regions in China where the central government and local governments coordinated development plans. In the early stage of the development of the YRD region, the government increasingly used market tools to coordinate the land supply and attracted enterprises and foreign investors by setting up a large amount of industrial and commercial land in the periphery and suburbs of the cities, which led to a significant increase in the proportions of the secondary and tertiary industries in the cities and promoted polycentric development of the cities. A typical example is the establishment of new industrial zones and new industrial cities in the YRD region, which have resulted in simultaneous increases in the secondary and tertiary industries and the degree of urban polycentricity. During the period of slow industrialization and urbanization development in 2020, the cities generally achieved a relatively stable industrial structure. Consequently, during this time, the industrial structure did not significantly influence the process of urban multi-center development.
4.3. Policy recommendations
Based on the research findings of this study, the following policy recommendations are proposed. First, cities should formulate appropriate strategies for urban spatial structure development based on the topographic features and population size. Throughout the different periods, the influences of the urban population, scale, and industrial factors on the spatial differentiation of the urban multi-centers have varied significantly. Furthermore, in some periods, the industrial structure failed to significantly influence the urban multi-center development. Therefore, it is necessary to make reasonable judgments about the development stage of a city to establish suitable strategies for the development of a multi-center spatial structure. For example, for cities with smaller scales and lower economic development levels, it is advisable to control the size of the city center and leverage the clustering effect of industries to enhance the utilization efficiency of the city center.
Second, cities need to plan the construction of new urban centers rationally. At the micro-level, the clustering effect serves as the driving force behind urban growth and is a significant factor in the formation of urban centers. According to the findings of this study, during periods of rapid urbanization and industrialization, constructing industrial centers is an effective approach to facilitating the transition toward a multi-centered city structure. However, in stages when urbanization and industrialization slow down, building new industrial centers cannot effectively promote the transition toward a multi-centered city structure. During such periods, attention should be directed toward changes in the urban population size, and balanced development of new urban centers should be encouraged from the aspects of residence, employment, and consumption.
5. Conclusions
In this study, the YRD region in China was taken as an example, and the urban centers of 41 cities in the YRD region from 2006 to 2020 were identified based on LandScan population distribution data and non-parametric models. The social network method is used to calculate the urban polycentricity index by combining the scale of each primary and secondary center and the distance between them, revealing the spatial and temporal differentiation characteristics of urban polycentricity in the YRD region. Next, the factors affecting the spatial differentiation of urban polycentricity in 2010 and 2020 were investigated using geographic detectors. The results showed that: (1) in 2006, the spatial structures of most of the cities were in the initial stage of transformation from monocentric to polycentric, and the populations of the primary centers far exceeded those of the secondary centers. In 2020, the spatial structures of most of the cities were in the mature stage of transformation from monocentric to polycentric. (2) The cold and hot spot distribution of the urban polycentricity index in the YRD region during the period 2006-2015 remained roughly the same, with the hot spot areas mainly distributed in Ningbo, Taizhou, Wenzhou and other cities in the southeast coastal region, and the cold spot areas mainly distributed in Wuhu, Maanshan and Nanjing in the central YRD region; (3) In 2010, the proportion of the secondary industry, the proportion of the tertiary industry, and the topographic relief had significant influences on the spatial differentiation of urban polycentricity. The interaction between road area and population size played a dominant role in the spatial distribution of urban polycentricity; In 2020, the population size and topographic relief can explained the spatial differentiation of urban polycentricity, and the interaction between the two played a dominant role in the spatial distribution of urban polycentricity.
This study also has some limitations. First, the measurement and research of urban multi-center development in this study primarily focused on the population aspect. In future research, it is necessary to integrate factors such as the distribution of urban architecture and industries to achieve a deeper measurement and understanding of the multi-center characteristics of urban morphology. Additionally, by revealing the commuting and other interactive activities between the primary and secondary centers, a better depiction of the functional aspects of the multi-center development can be attained. Second, due to the limitations of data availability, it was not feasible to list all of the potential driving factors that influence the spatial differentiation of the urban multi-center development. In particular, factors related to urban planning policies should be quantified in future studies. In addition, further research should investigate the heterogeneity, especially in terms of the scale and location. Finally, in this study, it was observed that the speed of the multi-center development in some cities had already begun to slow down. Additionally, studies have indicated issues such as separation of the residential and work areas, as well as inefficient land use in urban centers. Therefore, for urban multi-center strategies, rigorous empirical research and analysis are required to assess their economic, spatial, and social performances. Future research should use spatial econometric models to conduct rigorous empirical research and analysis of the economic, spatial, and social performances of multi-center strategies.
Disclosure statement
No potential conflict of interest was reported by the authors.
Correction Statement
This article has been corrected with minor changes. These changes do not impact the academic content of the article.
Additional information
Funding
References
- Agarwal A, Giuliano G, Redfearn CL. 2012. Strangers in our midst: the usefulness of exploring polycentricity. Ann Reg Sci. 48(2):433–450. doi:10.1007/s00168-012-0497-1.
- Anas A, Arnott RJ, Small KA. 1998. Urban spatial structure. J Econ Liter. 36(3):1426–1464.
- Arribas-Bel D, Sanz-Gracia F. 2014. The validity of the mono-centric city model in a polycentric age: US metropolitan areas in 1990, 2000 and 2010. Urban Geogr. 35(7):980–997. doi:10.1080/02723638.2014.940693.
- Brueckner JK. 2000. Urban sprawl: diagnosis and remedies. Int Region Sci Rev. 23(2):160–171. doi:10.1016/B0-08-043076-7/04416-8.
- Cheng H, Shaw D. 2018. Polycentric development practice in master planning: the case of China. Int Plann Stud. 23(2):163–179. doi:10.1080/13563475.2017.1361318.
- Dadashpoor H, Doorudinia A, Meshkini A. 2023. Polycentricity: the last episodes or the new season? Prog Plann. 177:100776. doi:10.1016/j.progress.2023.100776.
- Ding Y, Cai J, Ren Z, Yang Z. 2014. Spatial disparities of economic growth rate of China’s national-level ETDZs and their determinants based on geographical detector analysis. Progr Geogr. 33(05):657–666. doi:10.11820/dlkxjz.2014.05.007.
- Getis A, Ord JK. 1992. The analysis of spatial association by use of distance statistics. Geogr Anal. 24(3):189–206. doi:10.1111/j.1538-4632.1992.tb00261.x.
- Guo J, Wei Y, Chen W, Xiao W. 2022. Progress of urban polycentricity research and planning practice in the context of spatial restructuring. Progr Geogr. 41(2):316–329. doi:10.18306/dlkxjz.2022.02.011.
- Han S, Miao C, Li Y. 2023. Effects of urban polycentric spatial structure on carbon emissions in the Yellow River Basin. Geogr Res. 42(04):936–954. doi:10.11821/dlyj020220769.
- Han S, Sun B, Zhang T. 2020. Mono- and polycentric urban spatial structure and PM2.5 concentrations: regarding the dependence on population density. Habitat Int. 104:102257. doi:10.1016/j.habitatint.2020.102257.
- Kong B, Wang L, Duan X. 2023. Nexus between railway construction and national territorial development strategies in China: a multi-level governance perspective. Trop Geogr. 43(05):859–871. doi:10.13284/j.cnki.rddl.003675.
- Lee B. 2007. Edge’ or 'Edgeless’ cities? Urban spatial structure in U.S. metropolitan areas, 1980 to 2000. J Region Sci. 47(3):479–515. doi:10.1111/j.1467-9787.2007.00517.x.
- Liao X, Fang C, Shu T, Ren Y. 2023. Spatiotemporal impacts of urban structure upon urban land-use efficiency: evidence from 280 cities in China. Habitat Int. 131:102727. doi:10.1016/j.habitatint.2022.102727.
- Li Y, Liu X. 2018. How did urban polycentricity and dispersion affect economic productivity? A case study of 306 Chinese cities. Landscape Urban Plann. 173:51–59. doi:10.1016/j.landurbplan.2018.01.007.
- Liu X, Derudder B, Wu K. 2016. Measuring polycentric urban development in China: an intercity transportation network perspective. Reg Stud. 50(8):1302–1315. doi:10.1080/00343404.2015.1004535.
- Liu X, Wang M. 2016. How polycentric is urban China and why? A case study of 318 cities. Landscape Urban Plann. 151:10–20. doi:10.1016/j.landurbplan.2016.03.007.
- Li F, Zhao M, Huang J. 2021. The performance of spatial structure and the choice of development model of Mage-city. Urban Plann Forum. 01:18–27. doi:10.16361/j.upf.202100002.
- Li F, Zhao M, Wu M, Huang J. 2017. Polycentric Mage-city and its mechanism of spatial performance: findings from Xiamen based on LBS and census data. Urban Plann Forum. (05), :21–32. doi:10.16361/j.upf.201705002.
- Lv C, Lan X, Sun W. 2017. A study on the relationship between natural factors and population distribution in Beijing using geographical detector. J Nat Resour. 32(08):1385–1397. doi:10.11849/zrzyxb.20160707.
- Mcmillen DP. 2001. Nonparametric employment subcenter identification. J Urban Econ. 50(3):448–473. doi:10.1006/juec.2001.2228.
- Meijers EJ, Burger MJ. 2010. Spatial structure and productivity in US metropolitan areas. Environ Plann A. 42(6):1383–1402. doi:10.1068/a42151.
- Nechyba TJ, Walsh RP. 2004. Urban sprawl. J Econ Perspect. 18(4):177–200. doi:10.1257/0895330042632681.
- Ord JK, Getis A. 1995. Local spatial autocorrelation statistics: distributional issues and an application. Geog Anal. 27(4):286–306. doi:10.1111/j.1538-4632.1995.tb00912.x.
- Ord JK, Getis A. 2001. Testing for local spatial autocorrelation in the presence of global autocorrelation. J Region Sci. 41(3):411–432. doi:10.1111/0022-4146.00224.
- Qiang W, Luo H, Xiao Y, Wong DWH, Shi AS, Lin Z, Huang B, Lee HF. 2023. Can urban polycentricity improve air quality? Evidence from Chinese cities. J Clean Prod. 406:137080. doi:10.1016/j.jclepro.2023.137080.
- Qin X, Wei Y, Chen W, et al. 2013. Population expansion and polycentric development of Nanjing City in a period of hyper-growth. Geogr Res. 32(4):711–719. doi:10.11821/yj2013040014.
- Sun B, Hua J, Li W, Zhang T. 2017. Spatial structure change and influencing factors of city clusters in China: from monocentric to polycentric based on population distribution. Progress in Geography. 36(10):1294–1303. doi:10.18306/dlkxjz.2017.10.011.
- Sun T, Lv Y. 2020. Employment centers and polycentric spatial development in Chinese cities: a multi-scale analysis. Cities. 99:102617. doi:10.1016/j.cities.2020.102617.
- Sun B, Pan X. 2008. The impact research on daily travel by urban spatial structure: from the points of view of mono-centric and poly-centric. Urban Probl. 01:19–22.
- Sun B, Tu T, Shi W, Guo Y. 2013. Test on the performance of polycentric spatial structure as a measure of congestion reduction in megacities: the case study of Shanghai. Urban Plann Forum. (02):63–69. doi:10.3969/j.issn.1000-3363.2013.02.009.
- Sun B, Wei X. 2014. Spatial distribution and structure evolution of employment and population in Shanghai metropolitan area. Acta Geogr Sin. 69(6):747–758. doi:10.11821/dlxb201406003.
- Wang J, Xu C. 2017. Geodetector: principle and prospective. Acta Geographica Sinica. 72(01):116–134. doi:10.11821/dlxb201701010.
- Wei YD, Ewing R. 2018. Urban expansion, sprawl and inequality. Landscape Urban Plann. 177:259–265. doi:10.1016/j.landurbplan.2018.05.021.
- Wu Y, Lai S, Wu C. 2016. Research on polycentricity: concept, connotation, and spatial features. City Plann Rev. 40(06):23–31. doi:10.11819/cpr20160605a.
- Wu Y, Wei YD, Li H. 2020. Firm suburbanization in the context of urban sprawl: neighborhood effect and sectoral difference. Profess Geographer. 72(4):598–617. doi:10.1080/00330124.2020.1750437.
- Yang J, Qian S. 2014. A study on spatial texture differentiation of megacity centers – the case of Chongqing. Urban Plann Forum. (04):18–23. doi:10.3969/j.issn.1000-3363.2014.04.004.
- You Z, Fen Z, Yang Y. 2018. Relief degree of land surface dataset of China (1 km). J Global Change Data Discov. 2(2):151–155. doi:10.3974/geodp.2018.02.04.
- Zhao M, Chen C. 2011. Polycentric network organization of mega-city regions in Yangtze River Delta. Procedia Earth Planet Sci. 2:309–314. doi:10.1016/j.proeps.2011.09.048.