
 ?Mathematical formulae have been encoded as MathML and are displayed in this HTML version using MathJax in order to improve their display. Uncheck the box to turn MathJax off. This feature requires Javascript. Click on a formula to zoom.
Abstract
Application of deep learning technology in remote sensing image target detection(RSITD)has made remarkable progress in recent years. However, existing methods usually fuse spatial context information at the pixel level while ignoring the mining of spatial relationships between ground objects. This paper proposes a high-resolution remote sensing object detection network fusion of road-adjacent relationships (HRRSODN) that integrates road proximity relations. Taking artificial features such as toll stations adjacent to roads as an example, the spatial relationship of road proximity is used to assist visual information and improve the extraction accuracy. The method optimizes detection by: Using the spatial relationship as prior information; fusing coordinate attention that captures the spatial relationship between objects; and adding the attention generated by the spatial relationship to the attention generated in the original X and Y directions. This enables the model to understand the spatial layout of objects in the image. The distance loss function concretizes the spatial relationship into a distance index. The distance loss is incorporated into the training process by measuring the spatial distance between feature targets. Thus, during training, the network focuses not only on the positional information of the targets but also pays more attention to the spatial layout of the features. Experimental results show that, compared with conventional methods, the proposed method has achieved significant improvements in detection performance and mining spatial relationships. This verifies the importance of considering the spatial relationship of ground objects in remote sensing target detection. Further, this paper proposes a new method for target detection in remote sensing images (RSIs), which effectively utilizes the spatial relationship information between targets, and provides a new idea for further improving target detection in RSI.
1. Introduction
Object detection has been widely studied in the context of remote sensing, and it plays an important role in various applications (Cheng and Han 2016; Deng et al. Citation2018; Li et al. Citation2020). Counting and detection of human-built targets (Chini et al. Citation2008) such as airplanes, satellite navigation, automobile tracking, and the protection of endangered animals (Lorencin et al. Citation2019) are a few such applications. Object detection methods based on convolutional neural networks (Chua Citation1999) (CNNs) have gained popularity in the field of computer vision. Consequently, these techniques have become the preferred choice for detecting optical remote sensing data, including aerial and satellite images. Remote sensing image target detection (RSITD) aims to find targets of interest from complex remote sensing background images and label their locations and categories accurately and efficiently. The geometric structure and spatial pattern of images are becoming increasingly complex, and the amount of information contained in the images is growing higher owing to improvements in the spatial resolution of remote sensing images (RSIs). Conventional pixel- and object-level target detection techniques gradually lose target information as the image reaches deeper layers of the network after multiple convolutional pooling operations, effectively hindering target extraction (Xiao et al. Citation2020; Zou et al. Citation2023). The spatial relationship of target elements in the image is valuable in assisting target detection during remote sensing. Typically, extant methods fuse spatial context information at the pixel level, and they neglect the modeling and mining of spatial relationship information for the target image elements. Academician Deren (Deren et al. Citation2014) pointed out that the current high-resolution RSI information extraction has gradually evolved from pixel-level spectral decoding and primitive structural-level texture analysis to high-level understanding and cognition (rule knowledge and scene modeling). Therefore, it is necessary to study the spatial relationships between RSI targets to improve RSITD (Blaschke Citation2010).
Deep learning (Hinton and Salakhutdinov Citation2006; LeCun et al. Citation2015) has become an important technical tool for target detection, owing to its powerful feature expression and automatic learning ability. Foreign object detection in chest x-rays based on deep neural networks (Santosh et al. Citation2020) and face detection based on YOLOv3(Redmon and Farhadi Citation2018) are examples (Jiang et al. Citation2021). However, these tasks only extract target information from images, in isolation, at the ‘perception’ level; they lack ‘cognition’ (i.e. understanding the relationship between targets). Although some target detection tasks have already adopted attention-mechanisms, most attention methods on lightweight networks focus on encoding inter-channel information and ignore location information. Examples include CNN-based occlusion-aware facial expression recognition (Gao and Zhao Citation2021) and automatic detection of tuberculosis in chest CT (Kotei and Thirunavukarasu Citation2022). In contrast, the coordinate attention (CA) mechanism (Xie et al. Citation2022) not only captures cross-channel information, but also senses orientation and location information. This leads to more accurate localization and recognition of targets of interest, considerably improving the target detection task.
Currently, the application of CA has been widely studied. Wang introduced CA into the improved YOLOv4 network for unmanned aerial vehicle target detection based on image defogging under sea-fog conditions; this resulted in enhanced the ability to detect small objects while ensuring that the network was lightweight (Wang et al., Citation2021). Sheng wu proposed an improved lightweight YOLOv5 model based on the attention mechanism for mask detection; the CA module was inserted after each ShuffleLayer (Ma et al. Citation2018; Zhang et al. Citation2018) to form the novel ShuffleCANet (Xu et al. Citation2022) backbone. These methods have improved the target detection capabilities to a certain extent and achieved relatively good results by directly inserting the attention module into the network. This attention mechanism plays a vital role in integrating spatial relationships in target detection. However, these methods are just a simple reuse of the coordinate attention mechanism without going deeper to apply it, we dig out the underlying principle of CA and find that it preserves the long-distance dependency in the X and Y directions for the channel attention power to interact with the information in the two directions. On this basis, we added the spatial attention extracted from the spatial information of the road, and achieved better detection results, so we selected the coordinate attention mechanism as one of the application methods to incorporate spatial relationships
In addition, to enhance the utilization of spatial relations, we adopted a method of spatial relation materialization, which measures the spatial relations among features by distance. For example, roads and gas stations are usually in adjacent spatial relationships. We used this prior information to transform the road information into a position mask matrix. Then, we added road distance loss (Rloss) to the three main loss functions of the network to learn the positional information of the detected features faster and correct the detection results so as to focus on the spatial relationships of the features and improve the network performance.
In this paper, we propose HRRSODN, which extracts the road information dataset through a road extraction algorithm and incorporates the spatial information embedded in roads into the feature maps through an attention mechanism in the CNN extraction process. This helps focus on detecting the characteristic attributes of the features, thus suppressing unnecessary details and enhancing useful features for improving the CNN's representation capability. Furthermore, we propose Rloss, which exhibits superior convergence performance, restricts a more reasonable detection range for target detection and reduces the influence of interfering factors in the image, thus optimizing the fine extraction process of high-resolution remote sensing targets. This method can improve the detection performance without increasing the computational cost. In summary, to optimize the representation of feature information, we propose a method that incorporates the spatial relationship of the attention mechanism and the loss function to highlight the detection of key regions. Experimental results demonstrate that the proposed method achieves optimal detection performance under various background conditions, such as service areas and toll booths, compared to other state-of-the-art methods on the public DIOR dataset (Li et al. Citation2020).
The main contributions of the methodology are as follows:
This is the first fusion of spatial relationships of road proximity in remote sensing target detection, with verified effectiveness on some artificial feature targets.
A coordinate attention-guidance module that is integrated with spatial relations is proposed. This utilizes spatial relations to enhance image region perception and supplement certain semantic information. Additionally, it integrates the attention transformed by spatial relations based on the attention in the XY directions, thus optimizing feature information representation in the spatial domain while highlighting key regions.
The proposed Rloss, figuratively related to the space, complements the original localization loss so that the network focuses on the positional accuracy of the target frame during the training process, while considering the environmental and contextual information surrounding the target frame for measuring its quality accurately.
2. Related work
As regards the problem of object detection in RSIs, various target detection methods have been proposed, utilizing the image characteristics to achieve excellent performances; most of these methods are based on deep learning networks. Mainstream target detection algorithms based on deep learning networks are divided into two main categories: two-stage (Du et al. Citation2020) and single-stage (Chen et al. Citation2021) target detection algorithms. The first stage of the two-stage process locates the target object and ensures sufficient accuracy and recall of the suggestion box, and the second stage focuses on classifying suggestion boxes and finding more accurate locations. Generally, two-stage detection algorithms are slower and more accurate. The single-stage detection algorithm applies goal regression, without a suggestion box stage, and generates the class probability and the object position coordinate values with a single detection. The single-stage detection algorithm is faster but less accurate than the two-stage algorithm. Current target detection is highly accurate on most of the datasets; however, the detection of actual features is not stable owing to the presence of many interfering factors such as neighboring features, imaging conditions, and image differences in remotely sensed high-resolution images (Zhang et al. Citation2016; Cheng et al. Citation2017).
Many current detection algorithms do not actively consider the spatial relationship between artificial feature targets, which is precisely an important reference in manual interpretation. Some researchers have considered the importance of spatial relationships for target detection and made initial applications. The initial common practice is to apply spatial relations directly, for example, LSA-Net (Yu and Son Citation2020), which detects leaf spot species on leaves, combined the spatial relation of the leaf spots exist in the inner region of the leaf in a two-step process. First, it detects location of leaf is in the image, determines the region of interest (ROI), and then categorizes the leaf spots in the ROI. In the automatic port identification problem (Chen et al. Citation2019), deep learning and geospatial analysis are combined to obtain a progressive recognition model of ship-terminal-port. This model detects and locates the terminal category and pixel coordinates, converts them to geographic coordinates, performs hotspot analysis, and then realizes the identification and extraction of the port location and range using density clustering methods. With advancing research, spatial relationship application has gradually matured in multiple ways. For example, the multi-scale remote sensing image interpretation network (MSRIN) model, based on remote sensing target spatial relationship detection, has good spatial relationship applications (Cui et al. Citation2019). After accurately identifying different remote sensing targets and their positions, the model detects and displays the spatial position relationship between different targets, such as far and near, up and down, and left and right. Justin T.Mufford (Mufford et al. Citation2019) employed drone-based image acquisition and photogrammetric analysis to quantify the spatial proximity of cattle. By extracting still images from video screenshots obtained from a drone, an orthographic mosaic was generated, capturing the locations of all cows and calves and measuring the distances between them. Their study not only entailed an exploration of the social structure, dichotomous relationships, grazing, and maternal behavior of cattle but also clearly showed that members of related pairs were closer than members of unrelated pairs and that distances were greater at night.
The study of spatial relationship has achieved remarkable results in various fields. FSA-Net (Yang et al. Citation2019) realized the detection of head posture by detecting key features but other conventional methods take the whole of the head as the input of feature calculation, ignoring the spatial information between the features. For example, after calculating the feature information of the nose and the mouth and then integrating them together, they do not utilize the spatial characteristic that the nose is on top of the mouth spatial feature. The authors then proposed a fine-grained aggregation structure: the features are refined into regional features, and spatial coding is used to represent the spatial location relationships between the regional features. LSNet is a model used for segmentation of human instances, which incorporates instance-specific location information to improve accuracy and robustness. Through the pose attention module (PAM) (Tsai and Yeh Citation2021), the location information is encoded in the form of attention-regions, which are directly integrated into the segmentation process to distinguish instances more effectively at the feature level. In addition, through the operation of keypoints sensitive combination (KSCom), the position information of multiple sampling points is utilized, including human body key points and random points, to reduce misclassified pixels and improve segmentation accuracy. The experimental results show that LSNet achieves significant performance improvement on the human instance segmentation task and excels in handling severe occlusion situations.
These approaches have successfully harnessed spatial relationships from various perspectives to achieve impressive outcomes. On the basis of these studies, we found that employing CA to combine spatial relationships and utilizing Rloss for visualizing spatial relationships enhances their significance more effectively. By inserting the coordinate attention module, we introduce the spatial relationship, and the spatial relationship is fused with the two-direction attention map generated by the CA module to generate a new attention map and apply it to the input feature map, emphasizing the representation of the attention area. In addition, considering the accuracy and calculation speed of the detection model, the original loss function only considers the position and scale overlap between the target boxes but ignores the environment and context information around the target box. The proposed Rloss helps visualize the spatial relationship, supplements the context information, and complements the CA, enabling the model to predict the shape of the object more effectively.
3. Methodology
3.1. Method overview
Remote sensing imagery requires improved precision and recall for target detection to address the challenges due to complex features and a high number of interfering factors. Although improving the model can improve detection performance, and its effect does not increase significantly in practical applications due to hardware limitations. To solve this problem by exploiting the prior condition of spatial relationships, we propose a high-resolution remote sensing object detection network (HRRSODN) that entails the fusion of road-adjacent relationships. Our method achieved reliable results in several networks. We herein present an example involving the use of YOLOv7(Wang, Bochkovskiy et al. Citation2022) to describe the improvements achieved. We introduced a priori conditioning in CNNs and better utilized the properties of space by adding a CA module. In addition, we added Rloss to the loss function in YOLOv7. As regards bounding box regression, we combine the consistency of overlap area, centroid distance, and aspect ratio to achieve fast and accurate regression of prediction boxes.
illustrates the network structure of HRRSODN, which is improved based on YOLOv7. The backbone network includes convolution, C3, CA, efficient layer aggregation network (ELAN) (Wang, Liao et al. Citation2022), maximal pooling (MP), and spatial pyramid pooling (SPPCSPC)(He et al. Citation2015) modules. The ELAN module obtains rich gradient information, which increases the convergence stability of the model. The SPPCSPC module adds multiple parallel maximal pooling operations in a series of convolutions, which avoids the problem of duplicate features in the images extracted by the image processing operations, avoiding image distortion caused by image processing and solving the problem of duplicate features in the image extracted by the convolutional neural network. In the MP module, the maximum pooling operation extends the receptive field of the current feature layer and fuses it with the feature information that has been processed by the regular convolution, improving the generalization ability of the network.
Figure 1. Network structure diagram of HRRSODN.
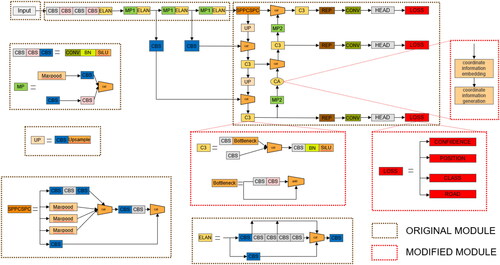
The C3 module is an improvement associated with HRRSODN and is used to replace the ELAN-H module to improve the feature extraction capability of the network and strengthen its integration with spatial relationships. The C3 module was selected mainly because it performs cross-layer connections and can synthesize spatial information at different levels. The ELAN module only combines single-layer features, and the spatial information is relatively limited. It fuses features of different step sizes and can obtain multi-scale spatial information, which is beneficial for detecting targets of different sizes. It uses global connections, does not focus on the local area, and can obtain richer and more complete spatial structure information. The combination of the C3 module and spatial information was found to achieve excellent results in the case of YOLOv5; therefore, we reused this module for YOLOv7.
With the introduction of the Rloss module, the network incorporates the spatial relationships during training. It not only focuses on the position accuracy of the target frame but also comprehensively considers the environment and contextual information around the target frame. This enables the network to pay more attention to targets near roads, thereby effectively addressing detection problems in specific target scenarios such as roads and gas stations.
The addition of the CA module substantially enhanced the entire network. It is located in the back part of the network and is used to extract advanced features; this is crucial to the success of the target detection task. Further, the attention weights learned in the X and Y directions are combined with the spatial attention weights extracted from the spatial relationship. This strengthens the model’s focus on the target position and leads to a better understanding and processing of the input features, thus improving the model performance. The resulting advantages include improved detection effect of small targets; reduced the amount of calculation; better integrated feature maps of different scales; and negligible effect on real-time performance.
The specific module analysis is detailed in Sections 3.1 and 3.2.
3.2. Coordinate attention feature optimization
In image processing, spatial relations refer to the positional and spatial layout relations between different pixels in an image, including the distance, relative position, and arrangement between pixels. These relations entail a wealth of information in image processing tasks, which can help us understand the relative positions, size relationships and layout structures between objects in an image.
The CA mechanism is a variant of the attention mechanism used in image processing for target detection tasks. It enhances the performance of target detection by introducing coordinate information to enhance attention to distinct locations in an image. In the target detection task, the mechanism assigns a coordinate encoding to each image position and splices it with features from the attention-computation to enhance the representation of positional relationships. This allows the network to attend to the locations in the image that are relevant to the target, improving the accuracy of target detection. The CA mechanism is particularly useful in lightweight target detection networks as it provides effective location awareness while maintaining efficient network performance.
Although the CA mechanism has many advantages in target detection tasks, there are some potential limitations. First, it may lack a certain amount of semantic information because it focuses primarily on coordinate or positional information in the image while ignoring the importance of semantic structure. Second, the CA mechanism may not have the ability to perceive image regions, which may lead to ignoring relevant information within the region, thus affecting the accuracy of detection. Finally, the mechanism is not sufficiently adaptable to image transformations and may exhibit instability when dealing with geometrically transformed images such as rotation, scaling, or translation.
To overcome the potential limitations of the CA mechanism, the introduction of spatial relations can be a useful option. Spatial relations refer to the relative positions and geometric relationships between objects, which can provide more semantic information, enhance the perception of image regions, and improve the model’s adaptability to image transformations for target detection tasks.
First, by introducing spatial relations, the target detection model can better understand the semantic structure between targets. The model can better understand the arrangement and organization of objects in a scene by learning the relative positions of objects, such as ‘above’, ‘below’, ‘left’, and ‘right’, and other relationships to better understand the arrangement and organization of objects in the scene. This semantic information can help the model to predict the presence and location of the target more accurately, thus improving the detection accuracy.
Second, spatial relations can enhance the ability to perceive image regions. The conventional CA mechanism may lack the perceptual ability when dealing with different regions, and it is easy to ignore the essential information in the region. With the introduction of spatial relations, by contrast, the model can perceive the contents of image regions more comprehensively by focusing on the geometric relations between targets, especially the relations between targets and their surroundings. Thus, the model can better capture the contextual information of the target, thus improving the accuracy and robustness of detection.
Finally, spatial relations can also improve the model’s adaptability to image transformations. Since spatial relations consider the relative position and geometric features of the target, the model can be more stable when dealing with geometrically transformed images such as rotation, scaling, or translation. This is because the spatial relation has a certain degree of invariance, and it does not completely lose its significance because of changes in the position or angle of the target. As a result, the model can better maintain its ability to understand and detect the target when handling various image transformations.
Therefore, the CA module incorporating spatial relations can further optimize the target detection network by transforming the road image containing spatial information into an attention map of the same format as the XY direction and incorporating it into the original attention, thereby improving the performance of the target detection network.
3.2.1. Information-embedding module
First, we review the conventional CA mechanism (i.e. CA module). This module encodes each channel by performing a global average pooling operation on the intermediate tensor X and using two pooling kernels (H,1) and (1,W) along the horizontal and vertical coordinates, respectively. This yields a pair of maps with orientation recognition properties, representing the distant feature correlation and accurate localization of the input features in the horizontal and vertical spatial directions, respectively, to enhance the network’s focus on the target ROI.
The output of the cth channel with height h is expressed as follows:
(1)
(1)
Similarly, the output of the cth channel with width w is expressed as follows:
(2)
(2)
3.2.2. Attention generation module
The CA module embeds the coordinate information into the concatenated feature maps generated in two directions, and applies a shared 1 × 1 convolutional transform function F1 to transform it:
(3)
(3)
Where is the nonlinear activation function. The generated feature map
is the feature map formed by encoding the spatial information in the horizontal and vertical directions. The feature map is batch normalized and nonlinearized, and along the spatial dimensions
is split into
and
Additionally two 1 × 1 convolutional transforms are used to separate
vs.
transformed to a feature map with the same number of channels as the input X.
and
and finally processed with a Sigmoid activation function to generate the attention weights
and
(4)
(4)
(5)
(5)
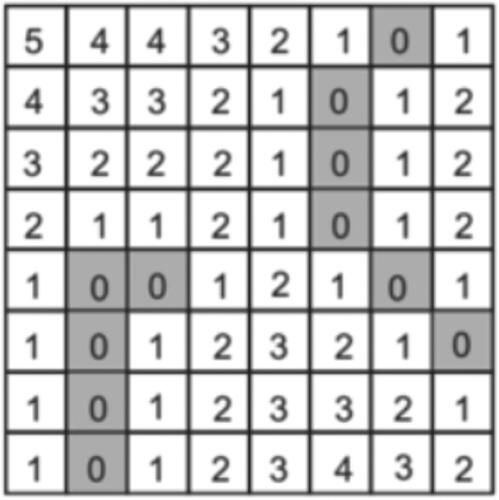
To compensate for the shortcomings of the CA mechanism, we propose an improved method of fusing spatial relations. Specifically, we introduced the neighboring spatial relationship between roads and detected targets in the CA module to combine attention with spatial information. In the training process, we extracted the road information from the image and generated the road grayscale map, which was converted to the road binary map by binarization as shown in . Then the road mask matrix was generated according to the distance of the pixel point from the road. This mask matrix represents the distance information of the pixels in the image with respect to the road, and pixels closer to the road receive higher scores and vice versa. We then processed the mask matrix into scaled values between 0 and 1 by the Sigmoid method, generating attentions representing the X and Y directions on the tensor.
Figure 2. Road binary map.
3.2.3. Attention output module
After the two steps as above, the CA module structure is shown in . The output CA Y is
(6)
(6)
Figure 3. Coordinate attention flow chart for fusing spatial relationships.
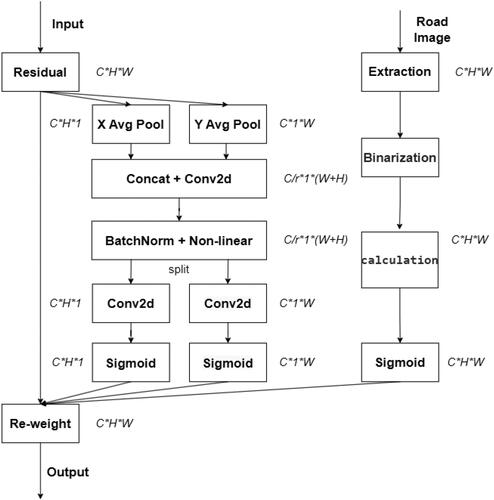
The CA module considers the encoding of spatial information, and the final output Y contains attention from the horizontal direction, attention from the vertical direction, and attention from spatial relations. Each element in the three attention-maps responds to whether the object of interest exists in the corresponding location or not, and CA is able to locate the ROI more accurately, combining spatial relations to make the channel information and location information more precise.
3.3. Loss functions
There are many ways to utilize spatial relationships. In addition to the CA fusion spatial relationship method mentioned in Section 3.2, another method is to use distance indicators to visualize spatial relationships. We propose an important innovation: the spatial relationship loss function Rloss based on the distance index. The core idea of Rloss is to use the spatial relationship of roads and gas stations as prior information, and fully consider the spatial layout of ground objects in the image, to evaluate the quality of the target frame more accurately.
In each training session, the target location is predicted and detected, the distance between the predicted frame and the actual frame is computed, a road mask matrix is generated using a binary map of the road containing spatial information according to the distance, and the positional information of the predicted and the actual frames is multiplied with this mask matrix. Such an operation results in the network being more sensitive to target boxes near the road, since target boxes closer to the road will receive higher weights, while target boxes farther away from the road will receive lower weights.
Due to the introduction of Rloss, the network incorporates spatial relationships during the training process, focusing not only on the positional accuracy of the target box, but also integrating the environment and contextual information around the target box. This makes the network pay more attention to targets near roads, thus better coping with the problem of detecting specific target scenarios such as roads and gas stations.
The conventional localization loss Ploss usually chooses distance intersection over union loss (DIOU)(Zheng et al. Citation2020) or complete intersection over union loss (CIOU), which helps in the position regression of the network, but Rloss supplements the description of spatial relationships between feature targets. This not only focuses on the location and scale overlap between target frames, but also introduces the spatial relationship between roads and gas stations as a prior information to measure the quality of target frames more accurately. Such improvements have enabled the network to make considerable progress in RSITD, and experimental results demonstrate its effectiveness in improving detection performance and accuracy.
By synthesizing the loss function, we combine Rloss with the original loss function (localization loss (Ploss), confidence loss (Closs) and classification loss (Sloss)). This enables the network to maximally utilize the spatial relationship information during the training process, comprehensively understanding the spatial layout of the feature target and thus improving the accuracy and robustness of the target detection.
(7)
(7)
where γ1, γ2, γ3, and γ4 are the equilibrium coefficients; and
and
represent confidence loss, classification loss, localization loss and road distance loss, respectively. The network divides each feature map into a number of grid cells, and each cell outputs a vector [tx, ty, tw, th, po, cls], where tx, ty, tw, and th are used to compute the prediction box, the corresponding anchor box (i.e. the offset between the centers of the two cells), and the width and the height of the prediction box, and ‘po’ is the probability of a cell (the prediction box) containing a target, and ‘cls’ is the corresponding predicted values of the categories. The feature maps do not interfere with each other, and the loss generated by each feature map is added directly to the total loss. Many localization loss functions, such as CIOU, DIOU, and generalized intersection over union (GIOU) (Rezatofighi et al. Citation2019) can be used for target detection, but considering the actual effect of these loss functions on the network, CIOU can improve the network more clearly by saving time, returning the prediction frames faster, and increasing the network’s convergence speed. Therefore, CIOU was chosen for localization loss in our experiments.
(8)
(8)
(9)
(9)
(10)
(10)
where
denotes the predicted frame,
denotes the real frame, and
is the distance between the two frames, α is the equalization factor, and υ is the penalty term.
BCEloss can be used to compute the difference in loss between predicted and real frames. and
are determined as follows:
(11)
(11)
(12)
(12)
Our experiments verified the key role of Rloss in network performance by comparing the effects of different loss functions. This innovative point brings new progress in the field of RSITD, and further confirms the importance of fully exploiting the spatial relationship between feature targets in RSITD.
4. Experiments and results
4.1. Datasets
4.1.1. Homemade spatial relation dataset
The current open-source remote sensing dataset lacks feature classes with spatial relationship, therefore, to meet our need to study the effect of spatial relationship on target detection, we created a self-made spatial relation (SR) dataset. The images in the dataset are by Google, and the selected images are distributed over the whole of main-land China. The generation of images combines with the POI point data collected by GPS and the accuracy of the data is guaranteed. Some examples of POI data are shown in . According to the GPS collected POI point location download, the data is accurate and has small deviations.
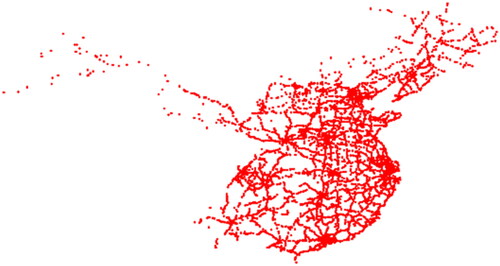
Figure 4. POI points in China.
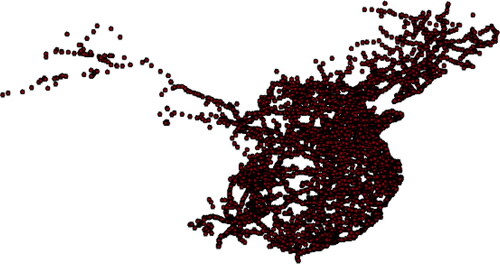
Figure 5. Road network in China.
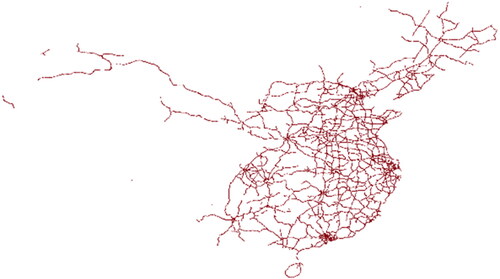
Figure 6. POI point distribution of gas stations in China.
The size of each image is 1280 × 1280 pixels, with a total of 2600 images, and there are three categories: toll stations, service areas and gas stations. These three categories of features are artificial buildings, the planning before the construction of the site is distributed around the road and have a clear spatial relationship with the road. This is shown in .
Among them, gas stations were previously not effectively detected by general detection methods because of their complex shape and non-uniform color image features. However, using the proposed method substantially improved the detection of this category, as explained in Section 4.3.1.
4.1.2. DIOR dataset
The DIOR dataset, proposed by Junwei Han’s team at the Northwestern Polytechnical University, has significant differences in intra- and inter-class scales, as well as high similarity and diversity. The dataset contains 23,463 images and 192,472 instances with an image size of 800 × 800 pixels and a resolution of 0.5-30 meters. These images cover 20 object categories, across different seasons, weather, and locations and are obtained from Google Earth. The rich data of DIOR dataset meets our experimental needs. Further experiments on this dataset will increase the reliability of the proposed method.
We selected two types of typical highway toll booths and service areas from the DIOR dataset, to study the application of spatial relationships in RSIs. Both target objects are distributed on both sides of the road and show clear correlation with the spatial relationship of the road.
4.2. Evaluation indicators
The target detection model has four types of classification results: true positive (TP), false negative (FN), false positive (FP) and true negative (TN).
The basic parameters for constructing evaluation metrics for target detection are precision (P) and recall (R), which can be expressed as:
(13)
(13)
(14)
(14)
During the experiment, P and R constrained each other. Ideally, both should score well, but in practice, they were contradictory in some cases. The trade-off between P and R is difficult. To accurately evaluate the model, it is necessary to introduce average precision (AP) and mean accuracy (mAP) metrics.
(15)
(15)
(16)
(16)
However, only these two evaluations metrics are not enough, so we introduce the F1 score metric, which considers the precision and recall of the classification model and can accurately evaluate the accuracy of the model. The formula for the F1 score is as follows:
(17)
(17)
4.3. Experimental process and analysis
In our experiments, the operating system, graphics processing unit (GPU), compute unified device architecture (CUDA), and deep learning framework were used with windows, NVDIA GeForce RTX 3090, 10.2, and PyTorch 1.7.1, respectively. During the training process, we trained the model using the stochastic gradient descent (SGD) algorithm with a warm-up for the first three rounds of experiments, with an SGD momentum parameter of 0.8. In the comparison and ablation experiments, the pre-trained model was not used to eliminate its influence on the experiments. The epoch (number of iteration rounds), initial learning rate, minimum learning rate, and batch size in the experiments were 500, 0.01, 0.0001, and 32, respectively. Subsequently, the learning rate was adaptively adjusted according to the set batch size, with a momentum parameter of 0.937 and a weight decay of 0.0005.
4.3.1. Ablation experiments
To analyze the effectiveness of the proposed spatial relation method, we introduced HRRSODN into YOLOV7, YOLOV5 and Centernet, and set up different ways of combining modules on the homemade SR dataset for the ablation experiments. The results of the ablation experiments are summarized in .
Table 1. Ablation experiments of YOLOV7 introduced into HRRSODN.
Table 2. Ablation experiments of YOLOV5 introduced into HRRSODN.
Table 3. Ablation experiments of Centernet introduced into HRRSODN.
Experimental results demonstrate the effectiveness of each of the proposed modules. The proposed HRRSODN-CA module introduces spatial relations based on the original CA mechanism, which improves the detection performance. As shown in , after adding HRRSODN-CA to YOLOV7, YOLOV5, and Centernet, the mAP increased by 1.2%, 0.6%, and 5.6%, and the F1 scores increased by 1%, 0.5%, and 2.7%, respectively, which demonstrates that the combination of the attention mechanism and spatial relations can effectively enhance the model performance. In addition, after adding HRRSODN-Rloss to YOLOV7, YOLOV5 and Centernet, the mAP increased by 0.8%, 1.3% and 4.7%, and the F1 scores increased by 1%, 0.5% and 3.5%, respectively, demonstrating the effectiveness of Rloss. After adding both modules (HRRSODN-CA and HRRSODN-Rloss) to each network simultaneously, mAP increased by 1.8%, 2.6%, and 6.8%, and F1 scores increased by 2%, 1.5%, and 8.0%, respectively. The simultaneous addition of these two modules achieved a mutually reinforcing effect.
The gas station categories in the SR dataset are mentioned in Section 4.1.1. Due to the complexity of the data itself, the detection results are poor; however, by applying spatial relationships, we improve the detection performance of the model. The experimental results are shown in .
Table 4. Ablation experiments of HRRSODN on the gas station dataset.
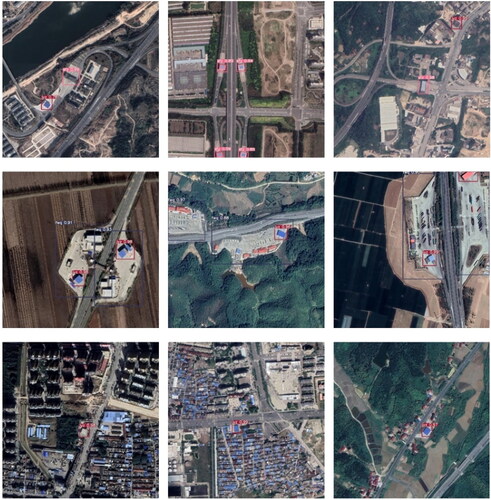
illustrates some of the detection results of the proposed method. A set of nine samples contains remote sensing targets of varied sizes and classes, with varying background complexity and lighting conditions, and with images taken at completely different angles. The target detection results in demonstrate the excellent performance of our remote sensing target detection method.
Figure 7. Detection effect of HRRSODN.
4.3.2. Experimental results and comparative analysis
After showing the advantages of the proposed method in Section 4.4.1, we compare the method with some state-of-the-art models. These models can be categorized into the following three groups: (1) single-stage detection methods, such as Centernet (Duan et al. Citation2019), YOLOV5, and YOLOV6 (Li et al. Citation2022); (2) two-stage detection methods, such as Faster region-convolutional neural network (Faster R-CNN)(Girshick Citation2015); and (3) Transformer-based detection methods such as Deformable-DETR (Zhu et al. Citation2020).
and show the experimental results of the proposed method and other networks on the SR dataset and DIOR dataset. The proposed method achieves 92.9% mAP and 90.0% F1 scores on the homemade SR dataset. The highest performance in both metrics is achieved by our method, exceeding the performance of other models. The single-stage detection modules YOLOV5 and YOLOV6 have mAPs of 88.9% and 89.4% and F1 scores of 88.5% and 88.0%, respectively, and the proposed method significantly outperforms these methods. A transformer-based network that has become popular in recent years, Deformable DETR has a mAP of 92.7% and an F1 of 88.0%. This type of network yields satisfactory results but has not yet achieved our target results for improved networks. For the two-stage detection results, Faster R-CNN and Centernet had mAPs of 84.3% and 82.7%, respectively, and F1s of 66.0% and 80.0%, respectively, with the lowest accuracy for both metrics. This result may be explained by the fact that the two selected two-stage network methods are old and have poor network performance. The prediction results for each method are shown in .
Figure 8. Prediction performance of each network.
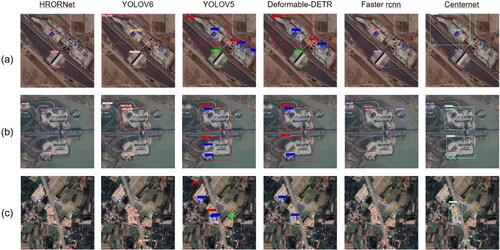
Table 5. Comparative experiments of HRRSODN on the SR dataset.
Table 6. Comparative experiments of HRRSODN on the DIOR dataset.
demonstrates the detection results. It can be observed that our method exhibits fewer errors in terms of misdetection and omission, improving the accuracy. shows that identifying gas stations within a service area is a challenging task. Most algorithms mistakenly detect gas stations with similar colors, complicating the sample; however, the proposed method exhibits good screening performance. (b) The toll station in the upper left corner and (c) the gas station in the lower right corner are both relatively small and have low color resolution; therefore, they are usually undetectable by conventional algorithms despite their presence on both sides of the road. In contrast, in HRRSODN, spatial relations are fused so that the network focuses on detecting targets on both sides of the road, thus avoiding such missed detections. Overall, YOLOV6 and Deformable-DETR have very good detection results, second only to the proposed methods. However, they are slightly less effective on some hard-to-detect targets, and there are some missed detections in Figures a, b, and c. However, YOLOV5 and Faster rcnn have fewer misses and more significant error detection. These two networks do not learn the features of the target comprehensively enough. Centernet has smoother detection and less miss-detection than Faster rcnn in both miss-detection and misdetection.
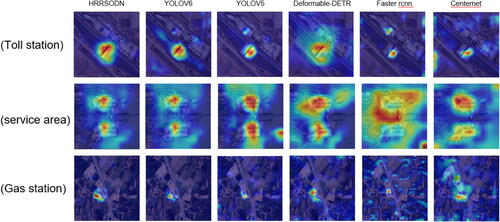
In heatmaps we can see that HRRSODN achieves better detection in all categories of images, for the category of toll stations, HRRSODN is the only heatmap that does not produce false detections, several other networks more or less mistake the gas station next to it as a toll station as well, and Deformable-DETR is slightly better but the range is too large to cover. For the category of service areas, the heat maps can easily spread out and become larger due to the larger scope of the service area, several networks in the YOLO series are better compared to the others, and Faster R-CNN detects the worst. For the category of gas stations, HRRSODN achieved good results for accurate location of gas stations with the darkest heat map color, Centernet and Faster R-CNN produced a lot of misdetected ranges in the heat map.
Figure 9. Heatmap comparison of multiple networks.
Overall, the proposed HRRSODN achieves significant improvements by fusing road neighborhoods.
5. Discussion
5.1. Role of the module on spatial relations
The results of the ablation experiments demonstrate that, in the context of the object detection task, integrating spatial relationships into the HRRSODN-CA module using attention mechanisms and concretizing spatial relationships through the HRRSODN-Rloss module yield similar mAP values. However, both methods outperform the network that does not incorporate spatial relationships. This enhancement confirms the effectiveness of applying spatial relationships in object detection. By fusing the HRRSODN-CA and HRRSODN-Rloss modules into the network, detection accuracy is further improved. This confirms the fact that applying these two types of spatial relationships to the object detection task can indeed enhance model performance.
The HRRSODN-CA module employs a coordinate attention mechanism to introduce spatial relationship information into the network. It performs feature aggregation along two spatial directions, X and Y, and returns a pair of direction-aware attention maps. Subsequently, the road weight matrix generated from the spatial information is added to generate three weighted scores that help generate CA. The HRRSODN-Rloss module continuously corrects the distance between the target position and the road position, thus guiding the training process in the right direction. These two modules provide guidance and suggestions for network training through SRs. Therefore, combining these two spatial relation modules can improve performance. The comprehensive utilization of the HRRSODN-CA module and the newly added HRRSODN-Rloss module in the feature extraction network significantly improves the accuracy of remote sensing target detection. Moreover, the F1 score of the network was improved because of the application of the lightweight feature extraction network.
5.2. Scalability of spatial relationship
Spatial relationships have broad application potential in the field of object detection. Although this study primarily focused on the spatial relationship between roads and gas stations, the proposed approach can also be extended to other domains and scenarios. For example, it can be applied to spatial relationships such as rivers and bridges, cities and parks, port terminals, docks, and coastlines to improve the accuracy and efficiency of object detection tasks in those fields. In the case of rivers and bridges, considering that bridges usually cross rivers, we can exploit this spatial relationship to improve the accuracy of bridge detection. By transforming the river information into a location mask matrix, we can introduce the spatial relationship between rivers and bridges into the network, so that the network pays more attention to the areas where bridges may exist. Similarly, in the case of city parks, we can exploit the spatial relationship between urban areas and park areas to optimize the object detection task. For example, when detecting urban green space, we can ensure that the model pays more attention to the boundary area between the city and the park by incorporating information about urban buildings into the model. Another application scenario is the spatial relationship between the port terminal and the coastline. Because port terminals are usually located on the coastline, we can exploit this spatial relationship to improve the detection performance of port terminals. By integrating the location information of the coastline into the network, it can help the model to more accurately identify the location of the port terminal, thereby improving the detection accuracy. In summary, there is excellent scope for the application of spatial relationships in object detection tasks. We can significantly improve object detection performance in various spatial relationship scenarios by introducing spatial relationships into the network and incorporating corresponding attention mechanisms and loss functions. Although this study primarily focuses on the spatial relationship between roads and gas stations, the proposed method is also applicable to other spatial relationship scenarios, such as rivers and bridges, cities and parks, ports, docks and coastlines, etc.
5.3. Attempts at spatial relationships
Although spatial relationships are promising in object detection tasks, we face several challenges and difficulties in incorporating them into networks. One of our explorations is to incorporate road spatial information into four-channel imagery data. Although the original intention was to ensure that the network better understands the spatial relationship between roads and objects, the results achieved in practical applications are not promising. We analyzed the results and identified the following reasons. 1) The neural network is a ‘black box’ operation in the process of extracting spatial relationship features, which means that we cannot know precisely how the network processes and applies spatial information during the learning process. While the network may be able to extract spatially relational features from four-channel imagery, we cannot guarantee that these features will interact with other target features in the desired manner. 2) Integrating spatial information into the network may introduce noise. For example, when road spatial information is added to four-channel images, noise in non-target areas may be introduced, which may interfere with the learning process of the network and ultimately degrade performance.
However, we identified another possible approach. Starting from the region of interest (ROI), we read the original image and road image and determined the ROI according to the distance between the pixel point and the road and the spatial relationship of the gas station and other buildings along the road. Subsequently, we assign different weights to pixels inside and outside the ROI to generate a position weight matrix. Combining this weight matrix with the intermediate variable X produced by the network makes the detected objects closer to the road. However, this method also fails to achieve effective results, probably because the ROI method oversimplifies the modeling of spatial relationships and does not fully consider their complexity. Following the failure of the ROI method, we made several attempts. Although most of them failed, they still demonstrated our efforts in exploiting spatial relationships for object detection in RSIs. These attempts provide valuable insight and experience for follow-up research and help us understand the importance of spatial relationships in target detection in RSIs. They also enable us to understand how to explore and utilize this information to provide us with spatial attention mechanisms and distance.
5.4. Future scope
Apart from object detection, spatial relationships also play an important role in semantic segmentation. In semantic segmentation, we need to divide the image into different regions and classify each region. However, the boundaries between different regions are usually blurred, which requires us to consider the spatial relationship between pixels to better segment different regions. For example, in RSIs, different land types are often divided according to the shape and distribution characteristics of ground objects. By modeling these spatial relationships, different types of land can be segmented more accurately, and more accurate data for subsequent analysis and decision-making can be provided.
In addition, edge detection and ground-object classification can also apply spatial relationships, which are essential for remote sensing image processing and analysis. It can help algorithms better understand the relationship and distribution between different objects in the image, thereby improving the accuracy and efficiency of remote sensing image processing and analysis.
6. Conclusion
In this study, we focused on the spatial relationship between ground objects and objects of interest and sought to alleviate the influence of complex surface object environment interference for improving the accuracy of target detection in high-resolution remote sensing images. To this end, we adopted the current popular YOLOv7 network as the basis for improvement, combined with the application of spatial relations. First, we introduced a coordinate attention (CA) mechanism module into the network to fully explore the spatial relationship information and optimize it accordingly. Next, we designed a distance loss function, using the distance as an indicator to measure the spatial relationship. This method helps the network to capture better spatial relationship between ground objects and objects of interest, thereby improving the detection accuracy. We conducted a series of experiments to verify the proposed method’s effectiveness and its superior performance in remote sensing image object detection. Experimental results verify that the proposed method is robust in complex ground-object environments and significantly improves the accuracy and efficiency of object detection in remote sensing images. To sum up, this study effectively improves the performance of remote sensing image target detection by fusing the spatial relationship between ground objects and targets. In future work, we will continue to explore the application of spatial relations in depth to further optimize object detection technology in remote sensing images.
Acknowledgments
All authors express their gratitude to the reviewers and editors for their helpful and detailed comments and suggestions to the paper.
Disclosure statement
No potential conflict of interest was reported by the author(s).
Data availability statement
The paper provides the database used in the current study at baiduy-un(https://pan.baidu.com/s/1FZGTbIPzrjXe1b4qstCD1Q?pwd=xwo4; extraction code: xwo4, accessed on 20 August 2023) and the python code available online at GitHub (https://github.com/suyishao99/HRRSODN, accessed on 20 August 2023).
Additional information
Funding
References
- Blaschke T. 2010. Object based image analysis for remote sensing. ISPRS J Photogramm Remote Sens. 65(1):2–16. doi:10.1016/j.isprsjprs.2009.06.004.
- Chen C, He C, Hu C, Pei H, Jiao L. 2019. A deep neural network based on an attention mechanism for sar ship detection in multiscale and complex scenarios. IEEE Access. 7:104848–104863. doi:10.1109/ACCESS.2019.2930939.
- Chen K, Lin W, Li J, See J, Wang J, Zou J. 2021. AP-loss for accurate one-stage object detection. IEEE Trans Pattern Anal Mach Intell. 43(11):3782–3798. doi:10.1109/tpami.2020.2991457.
- Cheng G, Han J, Lu X. 2017. Remote sensing image scene classification: benchmark and state of the art. Proc IEEE. 105(10):1865–1883. doi:10.1109/JPROC.2017.2675998.
- Cheng G, Han J. 2016. A survey on object detection in optical remote sensing images. ISPRS J Photogramm Remote Sens. 117:11–28. doi:10.1016/j.isprsjprs.2016.03.014.
- Chini M, Pacifici F, Emery WJ, Pierdicca N, Del Frate F. 2008. Comparing Statistical and Neural Network Methods Applied to Very High Resolution Satellite Images Showing Changes in Man-Made Structures at Rocky Flats. IEEE Trans Geosci Remote Sensing. 46(6):1812–1821. doi:10.1109/TGRS.2008.916223.
- Chua LO. 1999. CNN: A paradigm for complexity[M]. In: Huertas JH, Chen WK, Madan RN, editors. Visions of nonlinear science in the 21st century: Festschrift dedicated to Leon O Chua on the occasion of his 60th birthday. Singapore: World Scientific Publishing; p. 529–837.
- Cui W, Wang F, He X, Zhang D, Xu X, Yao M, Wang Z, Huang J. 2019. Multi-Scale Semantic Segmentation and Spatial Relationship Recognition of Remote Sensing Images Based on an Attention Model. Remote Sensing. 11(9):1044. doi:10.3390/rs11091044.
- Deng Z, Sun H, Zhou S, Zhao J, Lei L, Zou H. 2018. Multi-scale object detection in remote sensing imagery with convolutional neural networks. ISPRS J Photogramm Remote Sens. 145:3–22. doi:10.1016/j.isprsjprs.2018.04.003.
- Deren L, Liangpei Z, Guisong X. 2014. Automatic analysis and mining of remote sensing big data. Acta Geodetica et Cartographica Sinica. 43(12):1211. doi:10.13485/j.cnki.11-2089.2014.0187.
- Du L, Zhang R, Wang X. 2020. Overview of two-stage object detection algorithms. Paper presented at the Journal of Physics: Conference Series. doi:10.1088/1742-6596/1544/1/012033.
- Duan K, Bai S, Xie L, Qi H, Huang Q, Tian Q. 2019. Centernet: keypoint triplets for object detection. In: Proceedings of the IEEE/CVF international conference on computer vision. IEEE. doi:10.1109/iccv.2019.00667.
- Gao J, Zhao Y. 2021. TFE: a Transformer Architecture for Occlusion Aware Facial Expression Recognition. Front Neurorobot. 15:763100. doi:10.3389/fnbot.2021.763100.
- Girshick R. 2015. Fast r-cnn. Paper Presented at the Proceedings of the IEEE International Conference on Computer Vision.
- He K, Zhang X, Ren S, Sun J. 2015. Spatial pyramid pooling in deep convolutional networks for visual recognition. IEEE Trans Pattern Anal Mach Intell. 37(9):1904–1916. doi:10.1109/TPAMI.2015.2389824.
- Hinton GE, Salakhutdinov RR. 2006. Reducing the dimensionality of data with neural networks. Science. 313(5786):504–507. doi:10.1126/science.1127647.
- Jiang X, Gao T, Zhu Z, Zhao Y. 2021. Real-time face mask detection method based on YOLOv3. Electronics. 10(7):837. doi:10.3390/electronics10070837.
- Kotei E, Thirunavukarasu R. 2022. Ensemble technique coupled with deep transfer learning framework for automatic detection of tuberculosis from chest X-ray radiographs. Healthcare (Basel). 10(11):2335. doi:10.3390/healthcare10112335.
- LeCun Y, Bengio Y, Hinton G. 2015. Deep learning. Nature. 521(7553):436–444. doi:10.1038/nature14539.
- Li C, Li L, Jiang H, Weng K, Geng Y, Li L, Ke Z, Li Q, Cheng M, Nie W. 2022. YOLOv6: a single-stage object detection framework for industrial applications. doi:10.48550/arXiv.2209.02976.
- Li K, Wan G, Cheng G, Meng L, Han J. 2020. Object detection in optical remote sensing images: a survey and a new benchmark. ISPRS J Photogramm Remote Sens. 159:296–307. doi:10.1016/j.isprsjprs.2019.11.023.
- Lorencin I, Anđelić N, Mrzljak V, Car Z, University of Rijeka Faculty of Engineering. 2019. Marine Objects Recognition Using Convolutional Neural Networks. Naše More. 66(3):112–120. doi:10.17818/NM/2019/3.3.
- Ma N, Zhang X, Zheng H-T, Sun J. 2018. Shufflenet v2: practical guidelines for efficient cnn architecture design. In: Proceedings of the European Conference on Computer Vision (ECCV). Springer International Publishing. doi:10.1007/978-3-030-01264-9_8.
- Mufford JT, Hill DJ, Flood NJ, Church JS. 2019. Use of unmanned aerial vehicles (UAVs) and photogrammetric image analysis to quantify spatial proximity in beef cattle. J Unmanned Veh Sys. 7(3):194–206. doi:10.1139/juvs-2018-0025.
- Redmon J, Farhadi A. 2018. Yolov3: an incremental improvement. doi:10.48550/arXiv.1804.02767.
- Rezatofighi H, Tsoi N, Gwak J, Sadeghian A, Reid I, Savarese S. 2019. Generalized intersection over union: a metric and a loss for bounding box regression. In 2019 IEEE/CVF Conference on Computer Vision and Pattern Recognition (CVPR), 658–666.
- Santosh KC, Dhar MK, Rajbhandari R, Neupane A. 2020. Deep Neural Network for Foreign Object Detection in Chest X-Rays. In: 2020 IEEE 33rd International Symposium on Computer-Based Medical Systems (CBMS),p. 538–541. IEEE. doi:10.1109/cbms49503.2020.00107.
- Tsai E-J, Yeh W-C. 2021. PAM: pose attention module for pose-invariant face recognition. doi:10.48550/arXiv.2111.11940.
- Wang C-Y, Bochkovskiy A, Liao H-YM. 2022. YOLOv7: trainable bag-of-freebies sets new state-of-the-art for real-time object detectors. doi:10.48550/arXiv.2207.02696.
- Wang C-Y, Liao H-YM, Yeh I-H. 2022. Designing network design strategies through gradient path analysis. doi:10.48550/arXiv.2211.04800.
- Wang S, Wu H, Zhang L. 2021. AFDN: attention-based feedback dehazing network for UAV remote sensing image haze removal. In: 2021 IEEE International Conference on Image Processing (ICIP). IEEE. doi:10.1109/ICIP42928.2021.9506604.
- Xiao Y, Tian Z, Yu J, Zhang Y, Liu S, Du S, Lan X. 2020. A review of object detection based on deep learning. Multimed Tools Appl. 79(33-34):23729–23791. doi:10.1007/s11042-020-08976-6.
- Xie C, Zhu H, Fei Y. 2022. Deep coordinate attention network for single image super‐resolution. IET Image Proc. 16(1):273–284. doi:10.1049/ipr2.12364.
- Xu S, Guo Z, Liu Y, Fan J, Liu X. 2022. An improved lightweight yolov5 model based on attention mechanism for face mask detection. In: International Conference on Artificial Neural Networks. doi:10.1007/978-3-031-15934-3_44.
- Yang T-Y, Chen Y-T, Lin Y-Y, Chuang Y-Y. 2019. FSA-Net: learning Fine-Grained Structure Aggregation for Head Pose Estimation From a Single Image. In: 2019 IEEE/CVF Conference on Computer Vision and Pattern Recognition (CVPR), pp. 1087–1096. doi:10.1109/CVPR.2019.00118.
- Yu H-J, Son C-H. 2020. Leaf spot attention network for apple leaf disease identification. In: Proceedings of the IEEE/CVF Conference on Computer Vision and Pattern Recognition Workshops. IEEE. doi:10.1109/cvprw50498.2020.00034.
- Zhang L, Zhang L, Du B. 2016. Deep learning for remote sensing data: a technical tutorial on the state of the art. IEEE Geosci Remote Sens Mag. 4(2):22–40. doi:10.1109/MGRS.2016.2540798.
- Zhang X, Zhou X, Lin M, Sun J. 2018. Shufflenet: an extremely efficient convolutional neural network for mobile devices. In: Proceedings of the IEEE Conference on Computer Vision and Pattern Recognition. IEEE. doi:10.1109/cvpr.2018.00716.
- Zheng Z, Wang P, Liu W, Li J, Ye R, Ren D. 2020. Distance-IoU loss: faster and better learning for bounding box regress ion. AAAI 34 (7):12993–13000. doi: 10.1609/aaai.v34i07.6999.
- Zhu X, Su W, Lu L, Li B, Wang X, Dai J. 2020. Deformable detr: deformable transformers for end-to-end object detection. doi:10.48550/arXiv.2010.04159.
- Zou Z, Chen K, Shi Z, Guo Y, Ye J. 2023. Object detection in 20 years: a survey. Proc IEEE. 111(3):257–276. doi:10.1109/JPROC.2023.3238524.