
 ?Mathematical formulae have been encoded as MathML and are displayed in this HTML version using MathJax in order to improve their display. Uncheck the box to turn MathJax off. This feature requires Javascript. Click on a formula to zoom.
Abstract
The change in the land spatial structure affects regional development and stability. In the context of the construction of the Guangdong-Hong Kong-Macao Greater Bay Area, studying the spatial structure changes in its important cities will contribute to the coordinated development of the region. This study uses spatial analysis and coupling models to explore the basic characteristics and evolutionary trends of the land spatial structure in Zhongshan city in 2000, 2011, 2022, and 2035. Through research, it is found that (1) in general, the urban space is divided into different geometric forms by the water network system. The spatial structure of living land is ‘fragmentation-aggregation-aggregation and fragmentation’. (2) Ecological land is concentrated in the southeast and remained relatively stable. Productive land accounts for the largest proportion in Northeast China, becoming the main area of agricultural development. (3) From 2022 to 2035, the area of productive land will increase in different ranges under four scenarios, and the area of productive land will increase the fastest under the urbanization development scenario (UDS). (4) The ecological land area increases only in the ecological protection scenario (EPS), and the area decreases in the other three scenarios. An increase in construction land area occurs in the urbanization development scenario (UDS) and nature development scenario (NDS). (5) The habitat quality of Zhongshan city showed a significant decline from 2000 to 2022. In 2035, the habitat quality will significantly improve in the ecological protection scenario (EPS) and sustainable development scenario (SDS) scenarios, and the ecological regions in Southeast China will be significantly clustered and expanded.
1. Introduction
1.1. Research background
Since China’s reform and opening up, the southern coastal areas have accelerated urbanization, industrialization, and regional economic integration. In the context of the construction of the Guangdong-Hong Kong-Macao Greater Bay Area, studying the spatial structure changes in its important cities will contribute to the coordinated development of the region. Because the urban agglomeration effect attracts the one-way inflow of high-quality resources, on the one hand, it promotes the rapid development of urban social economies; on the other hand, capital forces continuously drive the sustainable development of geographical natural resources, resulting in significant changes in the spatial structure of urban land. In the twenty-first century, the low-quality, high-speed urbanization process is breaking the stable barrier of human-land relationships, causing the fragmentation of cultivated land, the disorderly expansion of urban construction land, the decentralization of rural construction land, the decline of the ecological environment, the extinction of rural areas, etc. (Wang and Li Citation2022). As the urban–rural dual structure remains in the process of urban–rural development for a long time (Luo et al. Citation2008), maintaining a stable human-land relationship is a prerequisite for urban development (He et al. Citation2020). Relevant studies have shown that ecological environmental changes and the occurrence of natural disasters are closely related to land use changes and urbanization development (Shi et al. Citation2006; Chu et al. Citation2018). In-depth analysis of land use changes holds practical significance for the sustainable development of cities, ecological environment construction, and future urban planning.
1.2. Literature review
1.2.1. Importance of land use and land cover change (LUCC)
Land is the most basic natural resource for ensuring and maintaining human survival and development (Wu Citation1991; Liu Citation1997), and it is also the core spatial unit connecting human beings with the natural environment. Land carries the development of human civilization through various historical stages and is closely related to the field of human activity (Wang et al. Citation2002). However, land use and land cover change (LUCC) is the result of human activities, the natural environment, and socioeconomic conditions (Mooney et al. Citation2013), and it has an explicit and implicit binary structure (Dai and Ma Citation2018; Cai et al. Citation2020). Scholar Yi-Fu Tuan believed that LUCC is a two-way mirror of human society. Meanwhile, it is also an important part of global environmental change, ecological protection, and regional sustainable development. However, the scientific prediction of LUCC was made in 1995, when the IGBP and IHDP plans proposed the ‘International Global Environmental Change: Man and Environment Plan’ and jointly implemented the ‘LUCC Cross Scientific Research Plan’ (Turner et al. Citation1995). Therefore, the evolution of LUCC has gradually become such that various countries have carried out research on global environmental change and sustainable development (Turner et al. Citation2007). Since then, in 1995, the IIASA performed research on ‘land cover change in land use in Europe and North Asia’. In 2000, the IGBP project proposed the concept of the ‘Anthropocene’ (Ruddiman Citation2013), according to which human activities have played a nonnegligible role in the changes in the earth’s surface. The ESSC of the United States also proposed that ‘human activities are the third driving factor affecting changes in the geographical and natural environment’ (Xu et al. Citation2013). Houghton et al. (Citation2000) proposed that LUCC will become an important material spatial structure for realizing the sustainable development of human beings in the future.
1.2.2. Research on land use and land cover change (LUCC) at different scales
Based on regions of different scales (Wang et al. Citation2002; Yin et al. Citation2023), geology (Liu et al. Citation2018), geomorphology (Hou et al. Citation2004), watersheds (Zhang et al. Citation2019), and other regional studies tend to be diversified. Early studies on land use change in different geographical areas and countries (Petek Citation2005), planning and management (Kim Citation2011), development (Dempsey et al. Citation2017), cooperation (David Citation2015), conflict (De Jong et al. Citation2021), and policy have gradually matured (Long Citation2014). Other scholars have focused on LUCC and human health (Davey and Selvey Citation2020), the ecological environment (Lerner and Harris Citation2009), climate (Rounsevell and Reay Citation2009), urban planning, and infrastructure (Hu et al. Citation2016). In addition, different scenario simulations, assessments, ecosystems, and impact factors for LUCC have become the focus of attention (Jamali et al. Citation2023; Li et al. Citation2023).
After the reform and opening up and rapid urbanization, Zhongshan city has achieved leapfrog development from being an agricultural county to being an industrial city. From the perspective of the region as a whole, Zhongshan city is an important coastal city in both the Guangdong-Hong Kong-Macao Greater Bay Area and the Pearl River Delta. For the Guangdong-Hong Kong-Macao Greater Bay Area, Liu et al. (Citation2023) discussed the impact of different urban land use changes on the habitat quality distribution pattern over four periods. Research has analyzed the impact of different driving factors on habitat quality changes and the spatiotemporal evolution of ecosystem service values in the Guangdong-Hong Kong-Macao Greater Bay Area (Liu et al. Citation2023; Zheng et al. Citation2022). At the same time, Yuan et al. (Citation2023) proposed changes in the land spatial pattern in 2025 and 2035 under the coordination scenario of production space priority, ecological space priority, living space priority, and ‘three living spaces’. Based on the 40-year time span of the Pearl River Delta, Xu et al. (Citation2015) analyzed the spatial and temporal expansion of central urban areas in some cities and discussed the intensity of the influence of nature, society, and the economy on the expansion of urban construction land. In addition, He et al. (Citation2020) analyzed land use changes in the Pearl River Delta and proved that Zhongshan’s urbanization level is going through a mid-term acceleration stage to a late maturity stage. From regional analysis to local analysis, Zhang (Citation2013) analyzed only the growth rate of construction use in Zhongshan city. Zhang et al. (Citation2021) analyzed the relationship between land use changes and regional ecological risk changes. Xiao et al. (Citation2019) believed that changes in the land spatial pattern could cause temporal and spatial changes in dike-pond landscapes, and they systematically showed that the temporal and spatial changes in dike-pond landscapes were affected by urbanization development, economic and industrial structures, the adjustment of the life value system and policy changes. Therefore, this study analyzes the evolutionary process of the urban spatial structure through the medium of regional land change and combines multiple subsystems in the regional system of human-land relationships to explore the change in and mechanisms of the impact of humans, society, the economy, and nature on the urban spatial structure.
1.2.3. Analysis methods and models for land spatial structure analysis and prediction
In terms of analysis methods, Yang et al. (Citation2016) used multivariate spatial statistical methods to analyze the evolutionary rules of the spatial centrality of, dynamics of, and differences in urban and rural construction land in the Pearl River Delta region, as well as the impact mechanisms of spatial evolution. Lin et al. (Citation2016) used a multivariate method to analyze the spatiotemporal characteristics of ecological risks during the land change process in Zhongshan city from 1990 to 2013. Feng et al. (Citation2022) used the FLUS-InVEST model to analyze the spatial and temporal differentiation change characteristics of habitat quality and habitat degradation in Zhongshan city from 1995 to 2018. These scholars divided the relevant research content of Zhongshan city into two aspects. On the one hand, they focused on analyzing the spatial pattern distribution, quantitative changes, and morphological evolution of land (Xu et al. Citation2015; Lin et al. Citation2016; Yang et al. Citation2016); on the other hand, regional land spatial changes interact and mutually influence the ecological structure, social structure, and economic structure (Liu et al. Citation2023; Zheng et al. Citation2022; Feng et al. Citation2022).
In addition to analysis methods, the use of models is a branch of research. At present, there are many types of models for the analysis, simulation, and prediction of the land spatial structure, and each model has its own differences and advantages. Previous studies have used the quantity forecasting model to analyze the changes in the quantity of different land use types, which may not realize the prediction of location changes in space (Lauf et al. Citation2012; Wang et al. Citation2019). Some studies use the spatial forecasting model to combine quantity change and spatial forecasting, which can improve the accuracy of forecasting results (Luo et al. Citation2010; Liu et al. Citation2017). However, the evolution of the spatial structure of LUCC is dynamic and complex and is affected by many types of factors. Clearly, scholars have performed much research on the model prediction of land use change through different methods (Chu et al. Citation2018; Cai et al. Citation2020; He et al. Citation2020; Yin et al. 2023), providing important theoretical methods and a scientific basis for this study on land use pattern changes. The advantage of coupling models lies in the fact that they integrate the advantages of multiple models to maximize the reduction in the limitations of a single model (Arsanjani et al. Citation2013; Liu et al. Citation2018; Mohamed and Worku Citation2020). Therefore, based on existing research results, this paper integrates the advantages of different models and the characteristics of the research area, takes land use as the research entry point, analyzes the distribution of, change in and form of the land spatial pattern in Zhongshan city, Guangdong Province, China, and attempts to explore land space and time. The connection between evolution and other elements of the city reveals the dynamic changes in and internal logic of land space.
1.3. Problem statement and objectives
From the research content above, with regard to the classification of land use types in Zhongshan city, some studies tend to ignore the practical issues of the mix and complexity of urban and rural construction land. The urban image of Zhongshan perceived by citizens is that of a city that looks like a city but is not a city. This kind of urban image is attributed to the fragmentation, expansion, and invasion of urban and rural construction land caused by early urban planning and natural development. The economic development of Zhongshan city has become an important factor in the spatial distribution and change of land. Therefore, the spatiotemporal evolution of construction land requires a more detailed expression of the actual spatial pattern of urban and rural land. In addition, regarding the spatial analysis of land use in Zhongshan city, most research content mainly selects past data and current data to analyze land spatial changes, and less research is involved in predicting land use changes. Regarding simulating the future, the spatial pattern distribution and scenario setting of LUCC needs to fully consider the practical issues and future planning of Zhongshan city. On the other hand, there is a lack of driving factors in the analysis and prediction of land use changes, especially the role and impact of the water network system and the industrial structure on the spatial distribution of land in Zhongshan city. Accordingly, based on organizing and thinking about the issues, this study further refines the classification of construction land to better reveal the distribution characteristics of urban and rural construction land in Zhongshan city. In addition, this study sets four scenario models based on Zhongshan city’s unique geographical location and future urban planning and urban development. Finally, due to the close relationship between the water network system and land spatial pattern distribution in Zhongshan city, the water network is classified twice on the premise of selecting multiple driving factors.
This study has four main purposes: (1) to identify the spatial pattern distribution and spatial structure characteristics of urban land from 2000 to 2022; (2) to explore the intensity of the impact of different driving factors on various land use types; (3) based on four scenarios, to simulate the evolution of the spatial pattern and spatial structure characteristics of urban land in China in 2035; and (4) to analyze the area proportions and spatial distribution characteristics of different levels of habitat quality in Zhongshan city from 2000 to 2035.
In summary, this study uses a coupled research method to explore and predict the basic laws of the spatial and temporal evolution of land spatial patterns in Zhongshan city. This study uses visual maps and quantitative data to reveal changes in the human-land relationships, regional systems, and urban land spatial pattern distribution and structure in Zhongshan city. Finally, the analyzed data results are further discussed based on the actual problems of Zhongshan city, and future urban and rural planning, ecological planning, sustainable development, and other issues are fully considered.
2. Study area and data source
2.1. Study area
Zhongshan city, Guangdong Province, China (113°09′113″46′E, 22°11′22°47′N), is the study area. It has a total land area of ∼1781 km2 and a sea area of ∼118 km2. It is situated in the southern portion of Guangdong Province, south of the middle of the Pearl River Delta, where the Xijiang and Beijiang Rivers empty into the ocean. It shares borders with the Nansha District of Guangzhou city and the Shunde District of Foshan city to the north, Jiangmen city, the Xinhui District, and the Doumen District of Zhuhai city to the west, Zhuhai city to the southeast, and Shenzhen city and the Hong Kong Special Administrative Region across the Pearl River Estuary to the east (). Zhongshan city has jurisdiction over 15 towns, eight subdistricts, one national-level development zone (Zhongshan Torch High-Tech Industrial Development Zone), one economic cooperation zone (Cuiheng New District), 127 jurisdictional communities, and 150 administrative villages.
Figure 1. Zhongshan city, Guangdong province, China.
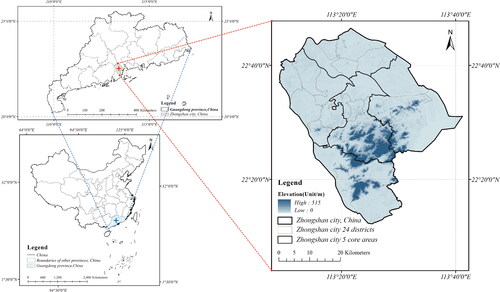
At the end of 2021, the urbanization rate of Zhongshan city was 89.13%, its GDP was ∼356.6167 billion yuan, its permanent population was ∼4.4669 million, and its urban population was ∼1.7671 million. Zhongshan city has a long summer and no winter and is characterized by a south subtropical monsoon climate. The climate is warm, and the sunshine is sufficient. The annual average temperature is 23.9 °C, and the annual rainfall is 1695.4 mm. Rainfall is abundant (Zhongshan Statistical Bureau Citation2022). The northwestern, southwestern, and northeastern areas of Zhongshan city have flat terrain, while the southeastern area has relatively undulating terrain. Influenced by the Wugui Mountain District, the southeastern area has a good ecological nature. In addition, the Xijiang River, Xiaolan Waterway, Jiya Waterway, Hongqili Waterway, and Shiqi River form a unique water network system in Zhongshan city.
2.2. Data sources
Based on the study area, remote sensing image data covering three periods, i.e. 2000, 2011, and 2022, in the administrative area of Zhongshan city were obtained (). The image IDs are LC81220442022246LGN00, LT51220442011264BKT00, and LE71220442000258SGS00. The data come from the USGS (https://earthexplorer.usgs.gov/), the spatial resolution is 30 × 30 m, and the cloud cover is <10%.
Table 1. Remote sensing image data on Zhongshan city in 2000, 2011, and 2022.
For remote sensing image data analysis, ENVI 5.2 software was used to perform radiometric calibration, geometric correction, atmospheric radiation correction, band fusion, image stitching, and cropping on the three-phase remote sensing image data in batches, and the maximum likelihood method was used for supervised classification and visual analysis. The combination method combines Google Earth based on land resource utilization and coverage characteristics. In addition, we comprehensively referred to the ‘Classification of Land Use Status’ (GB/T21010-2017), the land use cover classification system of the Chinese Academy of Sciences, and related studies (He et al. Citation2020; Xiang et al. Citation2023). Combined with the regional characteristics, the land use types of Zhongshan city are divided into 8 categories ().
Table 2. LUCC number and classification.
This study evaluated the accuracy of remote sensing interpretation data in 2000, 2011, and 2022, and the overall accuracy was (375/419) 89.4988%, (379/426) 88.9671%, and (390/448) 87.0536%, respectively. Furthermore, the kappa coefficients were 0.88, 0.8739, and 0.8516, respectively, meeting the accuracy requirement of being >85% (Liu et al. Citation2014). Regarding the selection of basic data and driving factor data, the administrative boundary data came from the National Geographic Information Resources Directory Service System (https://www.webmap.cn/), and the data were the basic geographical information data in 2021 (1:1 million). Water system data and traffic data came from Open Street Map (https://www.openstreetmap.org). The data were corrected and modified by combining the 2011 and 2022 satellite images and Google Maps. Temperature data, precipitation data, population data, and GDP data came from the Resource and Environmental Science Data Center of the Institute of Geographic Sciences and Natural Resources, Chinese Academy of Sciences (https://www.resdc.cn), with a spatial resolution of 1 × 1 km. The digital elevation model (DEM) data came from the Geospatial Data Cloud of the Chinese Academy of Sciences (http://www.gscloud.cn/), with a spatial resolution of 30 × 30 m. The data collection method for slope, aspect, and terrain curvature was based on DEM data extraction. The main source of socioeconomic data was the ‘Zhongshan Statistical Yearbook’ in 2011, 2012, and 2022 (Zhongshan Statistical Bureau Citation2011, Citation2012, Citation2022). In addition, based on the consistency requirement of the data coordinate system, all data adopted the WGS_1984_UTM_Zone_49N projection coordinate system.
3. Research methods
3.1. Land use transfer matrix
The land use transfer matrix can reflect the change in the structural characteristics of land use types in the early and late periods of the study area during the monitoring period, as well as the probability of mutual conversion between different land use types (Zhang et al. Citation2017). The formula is as follows:
(1)
(1)
Formula (1): Sij represents the area of land use type i converted to type j (km2); n represents the number of land use types before and after the transfer of the study area. i and j represent the land use types at the beginning and end of the monitoring period in the study area, respectively.
3.2. Land use dynamic degree model
The dynamic attitude of land use change can reflect the quantitative change characteristics of land use types in a certain period (Wang and Liu Citation2001). It is also an important indicator reflecting the extent of land area expansion or contraction (Zhang et al. Citation2019).
3.2.1. Single dynamic model
The single dynamic model represents the average annual change in a certain land use type in the study area during the monitoring period (Wang and Bao Citation1999). The formula is as follows:
(2)
(2)
Formula (2): is the average annual rate of change of land use type i during the monitoring period in the study area;
and
represent the area (km2) of land use type i in the study area at the beginning
and end
of the monitoring period, respectively.
3.2.2. Comprehensive dynamics model
The comprehensive dynamic model reflects the comprehensive changes in all land use types in the study area during the monitoring period (Wang et al. Citation2002). The is established as follows:
(3)
(3)
Formula (3): is the area of the first land use type;
represents the area where Class i land use types are transformed into non-Class i land use types; and
is the absolute value.
3.3. Spatial analysis model
The spatial analysis model can systematically analyze the intensity of land use dynamic change and comprehensively consider the spatial transfer process, increase process, speed, and rate of land use change (Liu and He Citation2002). The is established as follows:
(4)
(4)
(5)
(5)
(6)
(6)
Formula (4–6): indicates the transfer rate of class i land at time
to time
and
represent the rate of increase and the rate of spatial change, respectively; i is the land use type;
and
represent the area of the Class i land use type at the beginning and end of the period, respectively;
represents the area of the unchanged part of the i-th land use type;
represents the area of the transferred part; and
represents the new area.
3.4. Comprehensive index of the degree of land use
The comprehensive index of the degree of land use can reflect the degree of intensity of land use and the degree of comprehensive utilization of land by human activities (Zhu and Li Citation1997), and its index level can reflect the breadth and depth of land use. This index is calculated as follows:
(7)
(7)
Formula (7): La is the comprehensive index of the degree of land use, and its value is a continuous function of [100, 400]; Ai represents the index of the degree of land use grading of type i land; Ci represents the proportion of the type i land area in the total area; and n is the classification value of the degree of land use.
Based on the grading standards of several scholars, the degree of land use of the study area was divided into four levels (Zhu and Li Citation1997) ().
Table 3. Grading standard of the comprehensive index of the degree of land use.
3.5. CA model
The cellular automata (CA) model is a network dynamics model with discrete characteristics in time, space, and state (Hou et al. Citation2004). In space and time, the state of each cell has locality and independence; the rules of evolution are local changes. The spatial system of the CA model is composed of six parts: the cell, cell state, cell space, cell neighborhood, transition time, and transition rules (Chu et al. Citation2018) ().
Figure 2. Structure of cellular automata (CA).
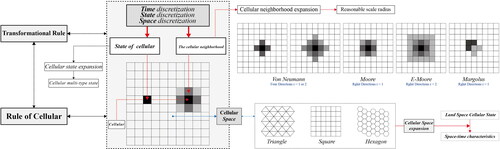
The CA model has no explicit mathematical function and is a general term for a class of models. Therefore, any model satisfying the transformation rules can be a CA model (Nouri et al. Citation2014). The transformation rules are as follows:
(8)
(8)
Formula (8): S represents the cellular space, namely, the cellular state; and
are the discrete states of the cells in the initial stage and the final stage, respectively. N denotes the neighborhood of each cell; and
denotes the cellular transformation rule in the local space.
3.6. Markov model
In the future analysis method, the Markov model can predict the probability of occurrence of or change in a certain event and the change trend of this event at a fixed time. The Markov model uses a grid scale to construct a quantitative probability model for the transition between various states of land use types in the process of change and uses the states before and after the development of time to obtain statistics and make interpretations of the change characteristics and transfer rules of an event in a certain period (Zhang et al. Citation2017). The model is established as follows:
(9)
(9)
Formula (9): and
are the status quo of land use types at times t and t + 1, respectively; and
represents the state transition probability matrix.
First, the operating criterion of the Markov model is to determine the state transition probability matrix of the mutual conversion between land use types. The calculation method is as follows:
(10)
(10)
(11)
(11)
Formula (10, 11): is the transition probability matrix from the initial period
to the end period
from land use type i to type
needs to meet two conditions, namely,
and
n is the number of land use types in the study area;
represents the area of land use type i converted to land use type j at time
to time
and
is the area of land use type i in the initial period of the study.
Based on the non-consequence and homogeneity of the Markov process and the Bayes conditional probability formula [65], the following formula needs to be satisfied:
(12)
(12)
Formula (12): is the state probability vector after n-1 state transitions to reach n transitions; and
is the initial state probability vector.
3.7. Logistic model
The advantage of the logistic model is that it does not require the independent variables to be continuous or discrete; additionally, it can be used to predict the likelihood of something happening in a region (Zeng et al. Citation2009). This model is established as follows:
(13)
(13)
Formula (13): is a constant in the predictive model;
represents the probability of the
-type land use type appearing in each grid, and the value is [0–1];
represents the regression coefficient to determine the quantitative relationship between the driving factors and their impact on the evolution of land use types; and
represents the various driving factors. The larger the value of
is, the higher the correlation between the independent variable and the dependent variable.
The logistic regression model requires a goodness-of-fit test, usually using the ROC curve (Pontius and Schneider Citation2001; Fawcett Citation2006), which is mainly used to test the relationship between the fitted data and the actual data. The calculation method is as follows:
(14)
(14)
(15)
(15)
Formula (14, 15): is one of the
and
observed values in the abnormal group, and the larger observed value is abnormal; Az = ROC, the ROC value range is [0.5, 1], and the fitting degree will increase with the increase in the ROC value. When ROC < 0.5, the simulation results are not consistent with the actual situation; when ROC = 0.5, there is no correlation between the simulation and actual results, indicating that the model is poorly fitted; when 0.5 < ROC < 0.75, there is a certain consistency between the simulation and the actual results, indicating that the fit of the model is general; and when ROC > 0.75, the simulation has a good agreement with the actual results, indicating that the model fits well.
Regarding the selection of driving factors, we follow the principles of easy availability (), spatiotemporal consistency, spatial difference, continuity, and diversity; combine the social, economic, and ecological conditions of the research area; and integrate several scholars (Zeng et al. Citation2009; Chen et al. Citation2017). Finally, this study selects four dimensions, i.e. physical geographic factors, climatic factors, accessibility factors, and socioeconomic factors, including 19 driving factors, to analyze the impact of land use evolution ().
Figure 3. Natural and climate drivers.
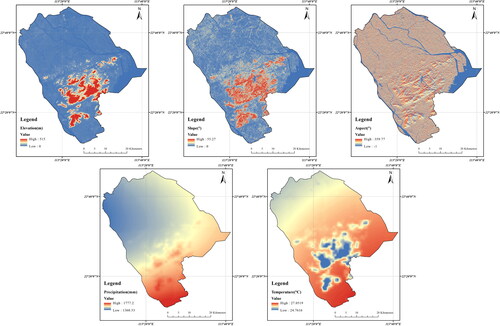
Figure 4. Socioeconomic drivers.
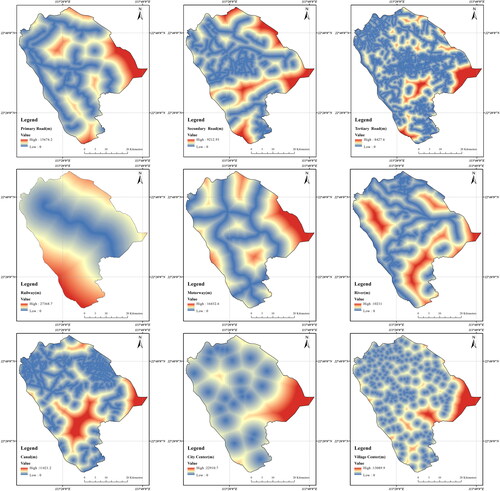
Figure 5. Reachability drivers.
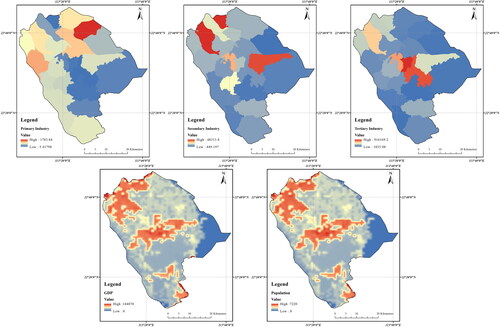
Table 4. Factors driving the evolution of land use types.
3.8. Habitat quality model
Human activities are one of the important driving factors affecting the change in the land spatial structure and the natural ecological environment, and the change in the land spatial structure is one of the reasons leading to the change in habitat quality. Habitat quality can reflect the ability to maintain regional biodiversity, ecosystem health, and the quality of the human living environment, and it is also an important indicator of regional ecological security and human well-being (Wu et al. Citation2020). In this study, the habitat quality module in InVEST 3.13 software was used to analyze and evaluate the spatial variation in urban habitat quality over multiple periods. The habitat degradation index and the habitat suitability index are the two factors that determine habitat quality. Habitat quality is negatively correlated with habitat degradation. The value range of the habitat quality index is [0–1]. The closer the value is to 1, the more stable the ecosystem. The formula is as follows (Xiang et al. Citation2023):
(16)
(16)
Formula (16): Qxj represents the habitat quality of grid cell x with land use type j; Hj represents the habitat suitability of land use type j; Dxj represents the habitat degradation degree of grid cell x with land use type j; k is the half-saturation constant; and z is the fixed conversion factor of the system (z = 2.5).
The habitat degradation index indicates the degree of impact of threat factors on the habitat structure. The basic assumption is that the higher the sensitivity of the land use type in the ecological environment system is to the threat factors, the greater the degradation degree of the land use type. The formula for calculating the habitat degradation degree is as follows:
(17)
(17)
(18)
(18)
(19)
(19)
Formula (17–19): indicates the degree of habitat degradation of the grid unit of the land use type, and the value range is (0–1); r is a threat factor;
represents the total number of grid cells occupied by threat factor r;
is the raster number of the r threat raster layer;
is the weight of the threat factor (
), and the value range is [0–1]; R is the number of threat factors;
indicates those land use types that are threat grids (0 or 1);
is the accessibility level of the threat factor to grid x, the value range is [0–1], and the larger the value is, the higher the accessibility;
represents the sensitivity of land use type
to threat factor
the value range is [0–1], and the larger the value is, the higher the sensitivity;
represents the threat level of the threat factor value of the threat grid y in the area to the land use type grid x;
represents the linear distance between grid
and grid
is the maximum influence distance of the threat factor; and
is the raster in threat source
The impact of threat factors on habitats decays linearly or exponentially as the distance between them increases.
First, based on the InVEST model user manual, the relevant literature and expert opinions (Yohannes et al. Citation2021; Wang and Cheng Citation2022; Xiang et al. Citation2023; Xiao et al. Citation2023). UCL, RCL, CL, IL, and BL are defined as threat factors, and the weight range, maximum distance influence, and spatial decay type of each threat factor are set ().
Table 5. Threat factor parameter settings.
Second, the habitat quality model needs to set the habitat suitability of different land use types, and the value range is [0–1], where 0 means that there is no biological survival condition and 1 means that the habitat suitability is high. It is also necessary to set the sensitivity of each land use type to various threat factors ().
Table 6. Suitability and sensitivity of various land use types.
Finally, this study combined the research results of many scholars and the characteristics of the study area to divide habitat quality into five levels ().
Table 7. Habitat quality levels in Zhongshan city.
4. Results and analysis
4.1. Changes in the land spatial structure and habitat quality
4.1.1. Changes in the land spatial structure from 2000 to 2022
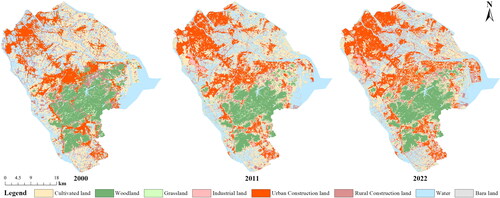
Through the visualization of the land use data results of the three periods (), the spatial structure of land in the central area of Zhongshan and the northwestern region underwent drastic changes from 2000 to 2022. The land for living continued to increase; and the surrounding ecological and production land was continuously encroached upon. In terms of the spatial distribution of geographical natural resources, WL and W resources are the most abundant. The spatial distribution of WL is mainly concentrated in Wugui Mountain and the southern region (Banfu town, Sanxiang town, Shenwan town, and Tanzhou town). In 2000, the water network was denser than that in 2022. The areas with dense water networks were mainly concentrated in Triangle town, Minmin town, and Tanzhou town and had a large number of mulberry-fish ponds. The CL area in the northwestern region decreased rapidly from 2000 to 2022. Due to the continuous dynamic changes in land, the main CL areas were ultimately in the northeastern and southwestern regions, with the northeastern region becoming the main area of the primary industry in Zhongshan city.
Figure 6. Spatial distribution of land use types in Zhongshan city in 2000, 2011 and 2022.
During the first stage (2000–2011) of the evolution of the land spatial structure ( and ), the WL and W areas of ecological land changed significantly, decreasing to 49.1 km2 (−2.7%) and 63.77 km2 (−3.51%), respectively, mainly transferred to CL, UCL and RCL. CL had a reverse growth phenomenon during the rapid urbanization stage, and the area growth of CL mainly came from W and WL. However. Comparing the land structure in 2011 with the land structure in 2000, the IL area nearly doubled, and the overall proportion was relatively low (1.45%). The BL area more than doubled. The UCL area increased by 66.95%, accounting for more than 20%, but the RCL area decreased by 42.8 km2 (−2.35%), and the area decreased by ∼25%, mainly shifting to CL (). During this period, urbanization increased from 60.67 to 87.84%.
Figure 7. Spatial structure of land use in Zhongshan city from 2000 to 2022.
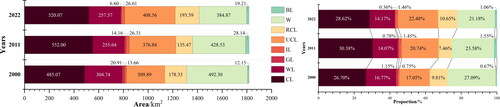
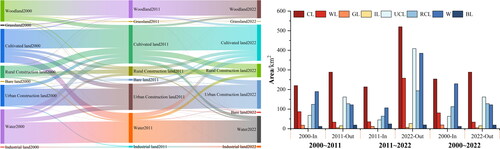
Figure 8. Transfer matrix of land use types in Zhongshan city from 2000 to 2022.
The top three changes in the single dynamic degree are BL (13.16%), IL (9.26%), and GL (−3.23%). Compared with 2000, IL and BL grew relatively quickly, and GL decreased rapidly ( and ), but it did not have a direct impact on the overall land spatial structure of the region. The areas of W, WL, and RCL significantly decreased and became the main land use types affecting the land structure of Zhongshan city. At this stage, the countryside was passively involved in the transformation caused by urbanization and industrialization under the dual logic framework of ‘urban priority development goals and strategies’ and the ‘urban–rural dual system’ (He et al. Citation2020), resulting in ‘farmers upstairs’, ‘rural demolition and construction’, ‘empty homesteads’, ‘urban expansion and rural contraction’, and other factors that have induced drastic fluctuations in the regional system of urban–rural human-land relationships.
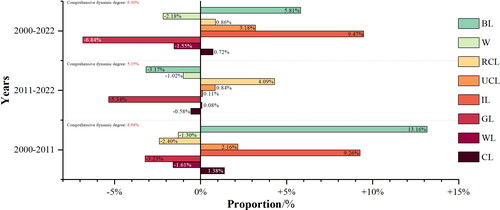
In the second stage (2011–2022), the changes in land use structure are relatively stable, and urbanization gradually slows down (fluctuation range: 85–90%). The area of CL and BL has decreased. The area of CL in 2022 is still higher than that in 2000, and it has begun to shift to urban and rural construction land. In addition, the W area continues to decrease. The GL and IL areas grow slowly (). Due to population agglomeration and economic development, UCL area continues to grow (+1.74%). RCL shows a positive and drastic dynamic change (single dynamic degree: 4.29%). The growth of urban and rural construction land mainly comes from the transfer of CL. Rural construction and infrastructure construction have become the hot spots of rural development during this period. The second stage of the comprehensive dynamic degree of land spatial structure in Zhongshan City (5.15%) is relatively stable compared with the first stage (8.94%), and overall it is still in a period of fluctuation in the relationship between man and land ().
Figure 9. Single dynamic attitude and comprehensive dynamic attitude of land use in Zhongshan city from 2000 to 2022.
Based on formulas (4–6), the degree of dynamic spatial change in land use during the period from 2000 to 2022 was calculated (). The spatial rate of change index was >1% for CL, W, RCL, and UCL. The lower transfer rates were IL, UCL, and WL, and the higher transfer rates were BL, GL, and RCL. CL, IL, UCL, RCL, and BL belonged to expanding land use types, their new addition rate was greater than the transfer rate, and the land use expansion of IL, UCL, and BL was relatively strong. W, WL, and GL all belonged to shrinking land use types, and their new addition rate was smaller than the transfer rate. The rate of spatial change was highest for the BL and RCL land use types.
Table 8. Spatial analysis model of land use in Zhongshan city from 2000 to 2022.
The comprehensive index of the degree of land use from 2000 to 2022 calculated by Formula (7) was 279.73, 285.25, and 293.78. Therefore, the degree of land space utilization within the study area continued to increase from 2000 to 2022. Changes in the land use degree mainly occurred in the central urban area and the northwestern region, and significant changes in the soil use degree were also found in areas with higher urbanization and industrialization levels in Zhongshan city ().
4.1.2. Changes in habitat quality from 2000 to 2022
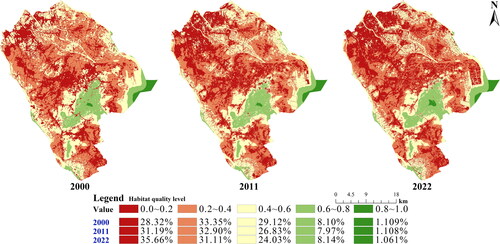
Through the Habitat Quality module in InVEST software, the spatial distribution of habitat quality in Zhongshan city from 2000 to 2022 was obtained (). Habitat quality at levels I and II was mainly concentrated in the northwestern, northeastern, and southern regions. The obvious changes in habitat quality are mainly in the northwest and northeast regions. However, habitat quality changes in the southeastern region are relatively stable.
Figure 10. Spatial distribution of habitat quality at different grades in Zhongshan city from 2000 to 2022.
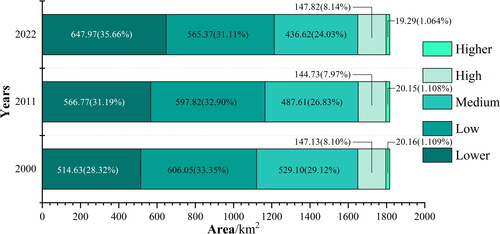
Second, the proportion of the habitat quality area at level IV was the lowest (<2%), the proportion of the habitat quality area at level V was <10% and the proportion of the habitat quality area at level IV decreased year by year. The ratio of mass to area increased slightly. Based on the three levels of III, V, and IV, it is found that the proportion of area in 2022 decreased by 5.10% compared with that in 2000 (). However, the area of habitat quality at level I increased year by year (2022 > 2011 > 2000). In 2022, habitat quality at levels I and II accounted for the largest proportion (66.77%), an increase of 5.01% compared to 2000. In addition, in 2022, the proportion of the habitat quality area at level I was the largest, but the proportion at level II was greater than that at level I in 2000 and 2011. The spatial distribution of habitat quality has similar characteristics to the change in land spatial structure, reflecting the transformation of habitat quality in most areas of the study area to a low level, and there is a potential risk of habitat degradation.
Figure 11. The area quantity and proportion of different grades of habitat quality in Zhongshan city from 2000 to 2022.
From 2000 to 2022, the overall habitat quality index of Zhongshan city showed a downward trend, and the habitat quality from high to low was 2000 > 2011 > 2022 ().
Table 9. Habitat quality index of Zhongshan city from 2000 to 2022.
4.2. Changes in the land spatial structure and habitat quality in 2035
4.2.1. Simulation test
The ROC values of different land use types obtained at the scale of 30 × 30 m are CL = 0.85, WL= 0.98, GL = 0.94, IL = 0.90, UCL = 0.94, RCL = 0.82, W = 0.93, and BL = 0.82. For the 8 land use types, the ROC values of land use were all >0.75 (Li et al. 2008). Therefore, the regression model simulation at the scale of 30 × 30 m has good accuracy and can better explain the actual spatial distribution of land use and its relationship with various driving factors. Based on the influence of driving factors on the land structure, X15, X4, and X11 have the strongest influence on CL. X1, X2, and X11 have an obvious influence on WL. X2, X11, and X12 have the strongest influence on GL. X2, X13, and X16 have the strongest effects on IL. X15 and X16 have the strongest influence on UCL. X15 and X16 have the strongest effect on RCL. X15 and X16 have the strongest influence on W. X11 and X19 have the strongest influence on BL. In summary, the regional economy, water system, and urban center have a significant role in promoting the urban land spatial structure.
The simulation results of land use types in Zhongshan city in 2022 show that the logistic-CA-Markov model and the CA-Markov model test the land use simulation data and actual data in 2022. The accuracy of the logistic-CA-Markov model (kappa = 0.764) is slightly higher than that of the CA-Markov model (kappa = 0.721). Due to the complexity of land and regional differences, it is extremely difficult for the accuracy of the prediction model to reach more than 85% (Zeng et al. Citation2009). At the same time, this study once again verifies the FOM accuracy. The simulation accuracies of the logistic-CA-Markov model and the CA-Markov model are FOM = 0.144 and FOM = 0.102, respectively. Therefore, the simulation accuracy of the logistic-CA-Markov model is better than that of the CA-Markov model.
4.2.2. Changes in land spatial structure in 2035
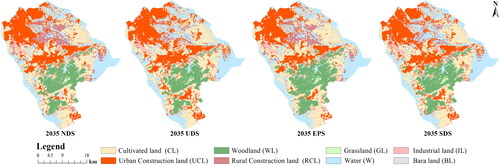
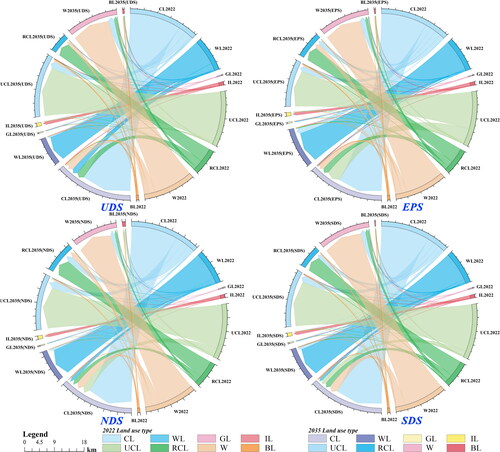
To meet the different development needs of the city, the historical land use transfer matrix of Zhongshan city from 2000 to 2022 was comprehensively considered. In addition, the ‘Zhongshan City Land and Space Master Plan (2020–2035)’, ‘Zhongshan City Ecological Environmental Protection 14th Five-Year Plan’, and ‘Outline Development Plan for the Guangdong-Hong Kong-Macao Greater Bay Area’ were used. At the same time, we drew on the scenario models set by other scholars (Li et al. Citation2022; Yu et al. Citation2023). Based on the spatial characteristics and changes in land in the third phase of Zhongshan city, the logistic-CA-Markov model was used to construct the nature development scenario (NDS), urbanization development scenario (UDS), ecological protection scenario (EPS), and sustainable development scenario (SDS). The land spatial pattern distribution and spatial structure characteristics of Zhongshan city in 2035 under this scenario were obtained (). The distribution of living space is concentrated in the central urban area and the northwest region. The main characteristics of these two regions are better economic development and a dense population. The ecological space is generally located in the southeastern region, with Wugui Mountain as the core and radiating to the surrounding areas. The distribution of production space is relatively scattered, mainly in the western, eastern, and northeastern regions. The distribution of land spatial patterns in 2035 is somewhat similar to that in 2022. The main difference lies in the different degrees of aggregation and separation of different local land use types.
Figure 12. Distribution and structural changes in the land spatial pattern in Zhongshan city in 2035 based on four scenarios.
4.2.2.1. NDS setting and forecast results
The natural development scenario is based on setting driving factors and following the laws of natural development without setting any restrictive factors to simulate the change in the land spatial distribution pattern in 2035. According to and , the land use type with the largest increase in area is RUL (228.63 km2), and the increase mainly comes from CL and W land. Although there is a slight decrease in UCL, the proportion of urban and rural construction land reaches 33.46%, and the overall construction land remains in a stable state. In addition, the area of CL increases and is close to the area in 2011, mainly due to the transfer of UCL, RCL, and W. On the other hand, GL and IL see a small increase, and the W area decreases significantly and is ∼48.80 km2 compared with 2022, mainly shifting to CL and RCL (). Therefore, under the NDS scenario, the change in the land spatial structure ratio mainly focuses on urban development.
Figure 13. Changes in the number and proportion of land use types in Zhongshan city in 2035 under the four scenarios.
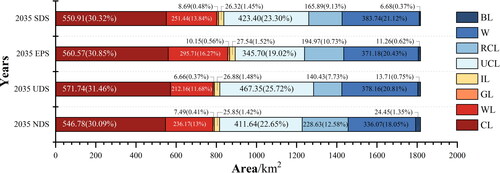
Figure 14. The transition matrix of land use types in Zhongshan city in 2035 under the four scenarios.
4.2.2.2. UDS setting and forecast results
In the context of rapid urbanization, the process of urban–rural integration has been further accelerated, with economic growth as the core goal. Considering that Zhongshan city is in a major strategic deployment stage of rapid development, the construction of the central urban area and the integration of urban and rural areas will be further promoted, which will inevitably lead to the optimization and adjustment of urban and rural construction land. Therefore, in the UDS scenario, the land use type tends to be more economically productive. First, the probability of BL priority transfer to UCL increases by 90%, and the probability of transfer to IL increases by 50%. Second, considering the adjustment of living space, the stability of ecological space, and the demand for production space in urban development, the probability of transfer from RCL to CL and UCL increases by 80%. Finally, the probability of transitioning from CL to WL increases by 80%. According to and , UCL has become the main land for urban and rural life, accounting for 33.46% of the total area, which is still relatively stable compared with that in 2022. However, the ecological land decreases, the W area has the largest decrease, and its proportion drops to 18.05%. CL increases significantly (571.74 km2), which is in line with the target of material demand in the process of future urbanization.
4.2.2.3. EPS setting and forecast results
Considering the regional ecological environment of Zhongshan City and the safety of the ecological environment of the Xijiang River Basin, further strengthen the ‘Lingnan City of Water Town’ and create a high-level open city that is happy and livable. Therefore, future urban development also needs to strengthen the overall ecological environment of the region. Therefore, in the EPS scenario, firstly, BL prioritizes increasing the transition probability to WL, GL, and CL by 90%. Secondly, increase the transfer probability from UCL and CL to WL and GL by 60%. Finally, to maintain the stability of regional ecology and water areas, reduce the transfer probability of WL to UCL by 60% and the transfer probability of W to CL by 60%. The simulation results show that GL, WL, and CL will increase by 0.2%, 2.1% and 2.23%, respectively, compared with 2022, and the areas of IL and RCL will remain stable, but the area of UCL will decrease significantly. According to and , the division of urban and rural land use is more clear that urban expansion tends to be stable, and more urban gray areas are released and transferred to other land types.
4.2.2.4. SDS setting and forecast results
In the context of SDS, the mutual interests among urban society, the economy, and the ecological environment should be systematically balanced. It is necessary to take into account the main goals of sustainable urban development and steady GDP growth and to coordinate the balance and symbiosis between urban development and ecological environmental protection. The ‘Zhongshan City Land and Space Master Plan (2020–2035)’ proposed to explore coordinated ‘mountain-water-forest-field-lake-grass-sea’ protection and development To maximize the stability and orderly growth of WL and GL areas. The constraints in the SDS scenario are as follows: first, we reduce the probability of transition from WL to CL by 80%; second, we reduce the probability of transition from CL, WL, and GL to BL by 80%; and third, we reduce the probability of transition from CL, WL, and GL to UCL and RCL to 20%. At the same time, we keep the number of water areas stable and reduce the transfer probability of W to UCL and RCL by 90%. In addition, considering the regional population and economic development and taking urban and rural development into account, we increase the transfer probability of BL to UCL and RCL by 80%. According to the forecast results (), the ecological space is reasonably controlled, and the proportion of ecological land area remains above 35%, basically maintaining the ecological space land area in 2022. CL still maintains growth, which is the same as the other three scenarios; UCL increases, and RCL decreases. The area of BL decreases the most and shifts mainly to CL, WL, UCL, and RCL. Therefore, in the context of SDS, maintaining a stable ecological environment takes into account urban development.
In 2035, the comprehensive indices of the land use degree under the four scenarios are 299.2179 (NDS), 297.6062 (UDS), 294.8125 (SDS), and 289.7398 (EPS). Under the NDS and UDS scenarios, the degree of land space utilization is significantly improved, the interaction between humans and land is stronger, and the degree of regional development is significantly enhanced. Compared with 2022, the degree of land space utilization in the EPS and SDS scenarios is relatively stable, and the relationship between humans and land tends to be stable.
4.2.3. Changes in the spatial structure of habitat quality in 2035
Based on the changes in land spatial structure in 2035 under four scenarios In the NDS scenario, the change in habitat quality was significantly different from that in 2022 and was the lowest among the four prediction results (). Although the habitat quality index at levels V and IV increased by 2.77% compared with 2022, the habitat quality area at level I increased by 42.6 km2, and that at level III decreased by 70.51 km2. In the UDS scenario, there is still a certain difference in the change in habitat quality compared with 2022, and it is relatively stable on the whole. Compared with the other three scenarios, the habitat quality index at the V and IV levels accounts for the lowest proportion, only 11.38%; however, the habitat quality index at the I level is significantly higher than that in the NDS scenario. In the EPS scenario, the habitat quality area at V and IV levels increased by 4.57% and increased by 83.01 km2 compared with 2022, while the habitat quality at I level decreased by 68.50 km2 compared with 2022, and the habitat quality in the central urban area, the eastern region, and the southeastern region significantly improved. In the SDS scenario, the habitat quality index at the I and II levels decreased by 1.79% and the area decreased by 32.47 km2 in 2022, while the habitat quality area at the V and IV levels increased by 24.42 and 29.00 km2, respectively ( and ).
Figure 15. Spatial pattern distribution of habitat quality under the four scenarios in 2035.
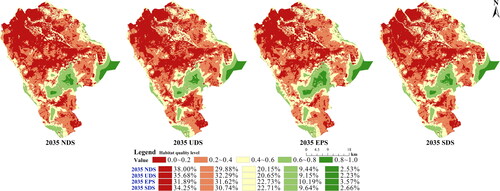
Figure 16. Changes in the area quantity and proportion of habitat quality at different levels under the four scenarios in 2035.
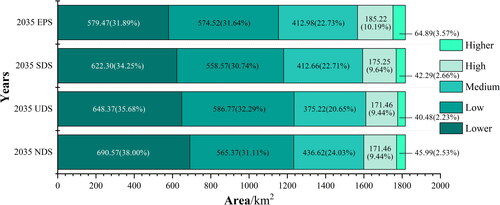
The habitat quality index of different simulated scenarios in 2035 is (from large to small) EPS (mean) > SDS (mean) > UDS (mean) > NDS (mean) (, ). At the III level, the proportion of environmental mass area is NDS > EPS > SDS > UDS. At the V and IV levels, the proportion of habitat quality area is EPS > SDS > NDS > UDS. At the I level, the proportion of habitat quality areas is NDS > UDS > SDS > EPS. In addition, the lowest share of habitat quality area at levels I and II is EPS, which was lower than in 2011 and 2022. The habitat quality areas in the EPS and SDS scenarios are higher at the I and II levels than from 2000 to 2022. NDS has the lowest habitat quality index of the four scenarios. The level of habitat quality in the UDS and NDS scenarios is generally lower than that from 2000 to 2022.
Table 10. Habitat quality index of Zhongshan city from 2000 to 2022.
5. Discussion
5.1. Maintain stable changes in land spatial pattern
As one of the important cities in the Guangdong-Hong Kong-Macao Greater Bay Area and the Pearl River Delta region, Zhongshan city has a key strategic position in the development of the southern coastal areas of the country. In the first period (2000–2011), the spatial pattern distribution of construction land ranged from scattered to aggregated and gradually formed a mixed feature of urban and rural construction land, with the change pattern being in high agreement with previous studies (Feng et al. Citation2022). Although construction land increased to a certain extent in the first period, the growth in the number of construction sites in 2011 did not more than double that in 2000, which is different from the results of other scholars (Zhang et al. Citation2021). In the second period (2011–2022), with the development of the urban economy, land for living began to spread from agglomerations to the suburbs around the city. The main factors were the limitation due to the quantity of regional land, the restriction of economic development, and the transfer of industries to the suburbs It is worth noting that the use of rural construction land increased during this period. First, the urbanization process slowed down; second, agricultural development occurred in local areas, and some agricultural products became important economic structures in various districts (such as Shenwan town, Minzhong town, and Triangle town). In both periods, with the growth of social and economic activities, the area of CL showed a trend of rapid growth and slow decline. The area of CL in 2022 was smaller than that in 2011, but the area of CL was still higher than that in 2000. In addition, the area of IL increased rapidly in the first period; the increase rate nearly doubled in 2000, but the proportion of the overall area was still low (<2%). Although the area reduction rate of GL was faster, the area proportion in the overall area was relatively low (<1.5%).
Therefore, IL and GL failed to have a substantial impact on the overall land spatial structure during the evolution of the spatial structure. In addition, the ecological land area of Zhongshan city continued to decrease. WL was mainly distributed in the southeastern area; its area changed greatly in the first period; and in the second period, the area change in WL showed a stable state. Although the WL area increased slightly, it was still lower than that in 2000 (−2.6%). Therefore, maintaining the stability of WL holds great significance for regional ecology, agricultural development, soil consolidation, flood control, and so on. The distribution and quantity changes of land patterns in Zhongshan city are closely related to the urbanization process, population size, and socioeconomic structure adjustment. Stabilizing the current land spatial pattern of Zhongshan city and the readjustment, planning, and governance of local areas have become urban development strategies.
5.2. Distribution of expansion areas
Water is a natural ecosystem that Zhongshan city has had since antiquity. The land spatial distribution pattern of Zhongshan city is divided into different patches by the water network system, forming a unique urban spatial form in the Pearl River Delta and Guangdong-Hong Kong-Macao Greater Bay Area. The area reduction of W in 2022 was close to ∼20% of that in 2000 and shifted to cultivated land and urban and rural construction. Therefore, the water area is an important ecological network in Zhongshan city. Keeping the area of W stable has irreplaceable significance for Zhongshan city’s production, life, and ecology. Judging from the changes in the spatial structure of land in Zhongshan city, the spatial structure of living land has undergone drastic changes, which have mainly occurred in urban areas with higher urbanization, economic development, and a dense population (He et al. Citation2020), and the overall construction land area continues to increase. This finding is consistent with existing research (Liu et al. Citation2017). The outward expansion of construction land is positively correlated with urbanization, fully verifying previous research (He et al. Citation2020). However, the expansion area is mainly distributed in the northwestern group area (Xiaolan town, Guzhen town, Dongsheng town, Dongfeng town, and Nantou town) and the central group area (Shiqi District, Nan District, and Shaxi town). Because these areas are located in flat plains and have unique water network systems, they are also areas with fragile ecological environments. Accordingly, Zhongshan city’s spatial pattern distribution and structural changes are closely related to the dense water network, superior geographical location, and industrial structure upgrading. For future urban management and governance, priority should be given to building a water network ecological security system and following the concept of ecological sustainability. The Zhongshan municipal government, departments, and institutions should focus on strengthening the water ecosystem, water safety system, water supply system, water management system, water supervision system, and water culture system. Through scientific management, intelligent management, big data, and six systems, we will enhance and improve Zhongshan city’s ecosystem, living system, and production system to better implement Zhongshan city’s 2035 planning goals.
5.3. Changes in the land spatial structure
From 2000 to 2022, the comprehensive index of the degree of land use continued to rise, and it was consistent with the driving level of urbanization. The comprehensive index of the degree of land use under the EPS (289.74) and SDS (294.81) scenarios in 2035 remains basically stable compared with that in 2022. Under the UDS (297.6062) and NDS (299.2179) scenarios, the spatial utilization degree of land constantly improves, and some local areas experience violent fluctuations in the human-land relationship under the two scenarios. In 2035, the change in the land spatial structure under the EPS and SDS scenarios is stable, which is conducive to urban development and has high consistency with the prediction results of previous studies (Wu et al. Citation2018; He et al. Citation2020). In the context of the NDS and UDS scenarios, the area of CL increases significantly. Under the principle of priority of production space, cities, and regions will develop rapidly, the passivity of ecological space area will decrease, and the area of WL and W will decrease significantly, which will inevitably lead to security problems of local ecological patterns. In the SDS scenario, the areas of WL, GL, W, and IL are basically maintained at the 2022 level; only the areas of CL and UCL increase, and only the areas of BL and RCL decrease. The land use change is in line with the requirements of urban economic development, and regional ecological security is considered. In general, the 2035 SDS scenario is relatively consistent with basic urban development (Wu et al. 2020).
Under the NDS and UDS scenarios, Zhongshan city will inevitably face the challenge of ecological environmental degradation in the future due to natural development and rapid urbanization. In the future urban development process, it is necessary to maintain stable ecological land and production land as prerequisites and to control and alleviate transitional urbanization and disorderly development. In addition, urban renewal needs to reserve and release more urban space, inject more ecological patches, and weaken the contradictions and conflicts between urban and rural construction land in core areas. Doing so will result in promoting the construction of new infrastructure, improving the urban and rural living environments, protecting and inheriting urban history and culture, strengthening the construction of green living circles in urban and rural communities, enhancing urban resilience, and improving urban ecological functions. Relevant government departments and planners understand that the urbanization process is not an oppositional pattern between ‘demolition’ and ‘construction’. They need to focus on durable renovation and microrenewal to alleviate the disorderly and mixed spatial pattern of urban and rural construction land left over from history.
Regarding the SDS scenario and the EPS scenario, improving Zhongshan city’s spatial pattern from an ecological perspective should focus on boosting the ‘one core’ ecological function in the Wugui Mountain area. Doing so can be achieved by speeding up the promotion of mountain closures for reforestation, through forestry ecosystem restoration, and by protecting ecological public welfare woodlands. It is also necessary to strictly limit the conversion of forestland into construction land and cultivated land. In addition, we should focus on the security issues of core ecological areas and scientifically and systematically meet the long-term governance goals of ecological protection and restoration projects in Zhongshan City’s ecological functional zones, ecological protection red lines, nature reserves, and other areas, focusing on the internal ecological construction of the city. More attention should be paid to the impact of scientific and technological development on urban development. The future sustainable development of cities should establish an intelligent genetic structure. An organic structure is formed through the connections between cells. When one node changes, another node will make optimization adjustments accordingly. Therefore, improving urban management and operational efficiency is particularly important in the future urban development process through the creation of urban digital twins and smart network management.
5.4. The spatial distribution of habitat quality is developing toward polarization
From 2000 to 2022, the habitat quality of Zhongshan city showed a downward trend, and the area of habitat quality at levels I and III showed an increasing trend, which was basically consistent with previous studies (He et al. Citation2020; Li et al. Citation2022). However, the area at level II continued to decrease, transforming into level V habitat quality and level I habitat quality. The spatial distribution of and variation in habitat quality remained relatively stable at levels V and IV. In the second period, the area of level V increased due to Zhongshan’s continuous investment in strengthening ecological environmental protection and responding to the policy of returning farmland to forest. It is worth focusing on the overall characteristics and spatial distribution of habitat quality. Although the area proportion of level II decreased, the area proportion of level I continued to increase year by year, and the area proportion of levels I and II was more than 60%. In 2035, the SDS and EPS scenarios have higher habitat quality levels than the NDS and UDS scenarios, but the SDS and EPS scenarios still have lower habitat quality levels than those in 2000. The change in the characteristics of the land spatial structure directly affects habitat quality. The spatial distribution of habitat quality in Zhongshan city is developing toward polarization, and there is still a high risk of ecological degradation in some areas. Therefore, it is of great significance to coordinate the symbiotic relationship among economic development, the land spatial structure, and the ecological environment and to optimize the regional land spatial pattern for urban sustainable development.
In summary, this study makes the following suggestions for the future development of Zhongshan city: (1) First, we should focus on strengthening and building the ecological landscape, functions, and humanistic construction of weak ecological space areas. Second, we should accelerate the optimization of the ecological network system in the central urban area, western cluster, and southern cluster. Finally, we should stabilize and improve the self-regulating capabilities of the southern and southeastern ecological systems. Doing so is conducive to creating a new urban ecological pattern in Zhongshan city of ‘one core (Wugui Mountain), four corridors, a water network, and multiple ecological patches’. (2) Regarding industrial space optimization and the spatial layout, the focus in the future should be on how to promote the scale, systematization, and green development path of production space. (3) To optimize living space, efforts should be made to strengthen the construction of urban and rural transportation systems to enhance connectivity between regions. Doing so will improve the construction of urban and rural living environments and actively create a new pattern of high-quality, warm, and attractive urban and rural living spaces. Finally, we recommend ‘advanced governance’ in urban management. For Zhongshan city’s urban management, a networked, node-based, and intelligent digital twin management method should be launched. Zhongshan city has a unique location and natural conditions. Sustainable urban development requires the establishment of scientific urban management through big data collection, algorithm identification, model prediction, and the realization of ‘advancement’. Urban management should be forward-looking, systematic, and holistic to better prevent urban crises. Urban governance should achieve the unity of the sustainability and intelligence of urban ‘things’ and the diversity of the needs of ‘people’ in the city.
6. Conclusions
The coupled model and multiple methods were used to analyze the changes in the spatial pattern and structural characteristics of land in Zhongshan city from 2000 to 2022. The land space of Zhongshan city in 2035 was predicted and analyzed by simulating four different scenarios. Meanwhile, the habitat quality levels in different periods were analyzed, and the conclusions were as follows:
The logistic-CA-Markov model can simulate land use change in the study area well; the kappa value exceeds 75%, and the FOM index reaches the standard level, indicating that the model is suitable for the simulation of the future land spatial pattern distribution in the study area.
CL, W, and UCL have become one of the land use types with the largest proportion in Zhongshan city. In the first period (2000–2011), the change in the ecological spatial pattern was particularly significant. The ecological land area decreased significantly, and the area of W decreased by 6.58%. The areas of CL, UCL, and IL increased significantly. In the second period (2011–2022), compared with the first period, the change in the land spatial structure showed a significant slowdown, but the water area continued to decline (384.87 km2), while the area of forestland remained the same as that in the same period in 2011. During the period from 2000 to 2022, the area of UCL continued to grow, and the proportion of the area increased from 17.05 to 22.48%. However, RCL experienced a process in which it went from decreasing to increasing, and the dynamics of RCL were significantly different in the two periods before and after. The proportion of the total area of urban and rural construction land increased from 26.86 to 33.13%. In recent years, the changes in the structure of living space have been in line with the urbanization process and residential land needs of Zhongshan city.
In the land use structure in 2035, CL, UCL, WL, and W will still be the main land use types. In the four scenarios, the area of CL increases in different ranges, and the area of CL is greater than that of CL in 2022. In the four scenarios, the area of CL increases in different ranges, and the area of CL is greater than that of CL in 2022. In the UDS scenario, CL has the largest growth rate (571.74 km2), and the area proportion increases by 2.84%. WL shows an increase only in the EPS scenario (295.71 km2). The area of W decreases to different degrees in all four scenarios, but the area of W decreases the fastest in the NDS scenario (−48.8 km2), and the area of W changes the most smoothly in the SDS scenario (−0.06%). RCL does not fluctuate significantly in the EPS scenario. In addition, there is no significant change in the areas of GL and IL under the four scenarios.
During the period from 2000 to 2022, the comprehensive index of land space utilization continued to increase, and sharp fluctuations in the relationship between humans and land mainly occurred in areas of economic growth and densely populated areas. In 2035, the land level comprehensive index will be the strongest under the NDS and UDS scenarios, which proves that urban population activities will continue under these two scenarios. Therefore, the urban fringe and the urban–rural transition zone are areas where living space is easy to expand and where the distance between humans and land fluctuates, leading to the blurring of the boundaries of urban–rural construction land.
During the period from 2000 to 2022, the overall habitat quality of Zhongshan city showed a downward trend (2000 > 2011 > 2022), and the spatial distribution of habitat quality had a significant north–south differentiation. The obvious reduction in habitat quality mainly occurred in the northwestern and central regions, and the area of habitat quality in the southeastern region gradually shrank. The habitat quality under the four scenarios in 2035 is lower than that in 2000; the habitat quality under the SDS scenario is higher than that in 2011 and 2022; and the habitat quality under the UDS and EPS scenarios is slightly higher than that in 2022.
In summary, the distribution of the land spatial pattern in Zhongshan city shows that urban and rural construction land has changed from ‘dispersion-concentration-decentralization and concentration’, and the release of more cultivated land in the northeastern and southern regions is conducive to regional centralized agricultural production. Under the EPS and SDS scenarios, it is more in line with the requirements of Zhongshan city’s overall urban and rural planning, land planning, and ecological environment construction in 2035, which is conducive to the sustainable development of Zhongshan city and alleviates the contradiction between humans and land in some areas.
In addition, this study has some limitations. The spatial resolution of the remote sensing image data selected in this study is 30 × 30 m; although the accuracy reached more than 85%, there are still some errors. Second, there are certain differences in the spatial resolution of different driving factors. Although unified processing and checking of spatial resolution cannot avoid certain errors in the prediction process, it is still necessary to improve the precision selection in future research. In addition, there may be slight errors between the prediction results of Zhongshan city and the actual situation in local areas. On the one hand, there is a spatial autocorrelation effect in the scale conversion process of raster data, and there is a certain degree of autocorrelation in the calculation of the logistic model. On the other hand, due to the large number of explanatory variables in the model, the lack of some data and differences in resolution may be the reason for the deviation of the simulation results from the actual situation. In future research, the accuracy of the data and analysis methods needs to be further improved.
Author contributions
Conceptualization: Jingzhao Feng and Jianqiang Yin; methodology: Jingzhao Feng, Yile Chen, and Jianqiang Yin; software: Jingzhao Feng; validation: Jingzhao Feng, Yile Chen, and Jianqiang Yin; formal analysis: Jingzhao Feng and Senyu Lou; investigation: Jianqiang Yin and Jingzhao Feng; resources: Jingzhao Feng; data curation: Jingzhao Feng and Senyu Lou; writing—original draft preparation: Jingzhao Feng; writing—review and editing: Jingzhao Feng and Yile Chen; visualization: Jingzhao Feng; supervision: Yile Chen and Senyu Lou; project administration: Jianqiang Yin; funding acquisition: Senyu Lou. All authors have read and agreed to the published version of the manuscript.
Disclosure statement
No potential conflict of interest was reported by the author(s).
Data availability statement
The data provided in this study were plotted by the authors’ team and are included in the article, which can be found in and .
Additional information
Funding
References
- Arsanjani JJ, Helbich M, Kainz W, Boloorani AD. 2013. Integration of logistic regression, Markov chain and cellular automata models to simulate urban expansion. Int J Appl Earth Obs Geoinf. 21:265–275.
- Cai CR, Shu BR, Zhu H, Yuan X, Yong XQ. 2020. Modeling land use change by considering regional heterogeneous driving mechanism. China Land Sci. 34(11):38–47.
- Chen XZ, Fan SL, Lin XD, Huang YH. 2017. Spatial simulation and analysis of land use and land cover change of Longhai City based on Logistic-CA-Markov model. J Fujian Agric For Univ. 46(6):685–691.
- Chu L, Zhang XR, Wang TW, Li ZX, Cai CF. 2018. Spatial-temporal evolution and prediction of urban landscape pattern and habitat quality based on CA-Markov and InVEST model. Chinese J Appl Ecol. 29(12):4106–4118.
- Dai RF, Ma L. 2018. Review on land change modeling approaches. Prog Geogr. 37(1):152–162.
- Davey TM, Selvey LA. 2020. Relationship between land use/land-use change and human health in Australia: a scoping study. Int J Environ Res Public Health. 17(23):8992. doi: 10.3390/ijerph17238992.
- David NP. 2015. Factors affecting municipal land use cooperation. Land Use Policy. 42:170–182. doi: 10.1016/j.landusepol.2014.07.013.
- De Jong L, De Bruin S, Knoop J, van Vliet J. 2021. Understanding land-use change conflict: a systematic review of case studies. J Land Use Sci. 16(3):223–239. doi: 10.1080/1747423X.2021.1933226.
- Dempsey JA, Plantinga AJ, Kline JD, Lawler JJ, Martinuzzi S, Radeloff VC, Bigelow DP. 2017. Effects of local land-use planning on development and disturbance in riparian areas. Land Use Policy. 60:16–25. doi: 10.1016/j.landusepol.2016.10.011.
- Fawcett T. 2006. An introduction to ROC analysis. Pattern Recog Lett. 27(8):861–874. doi: 10.1016/j.patrec.2005.10.010.
- Feng WB, Lin MZ, Gong JZ, Zhao JM, Zhong L, Liu HY. 2022. Spatiotemporal differentiation of habitat quality in Zhongshan City based on Flus-InVEST model. Ecol Sci. 41(3):16–23.
- He YT, Wang SY, Yuan ZJ, Zheng MG, Huang B, Liang C. 2020. Land use change and its response to urbanization in the Pearl River Delta. Ecol Environ Sci. (2):303–310.
- Hou X, Chang B, Yu X. 2004. Land use change in Hexi corridor based on CA-Markov methods. Nongye Gongcheng Xuebao. 20(5):286–291.
- Houghton RA, Skole DL, Nobre CA, Hackler JL, Lawrence KT, Chomentowski WH. 2000. Annual fluxes of carbon from deforestation and regrowth in the Brazilian Amazon. Nature. 403(6767):301–304. doi: 10.1038/35002062.
- Hu N, Legara EF, Lee KK, Hung GG, Monterola C. 2016. Impacts of land use and amenities on public transport use, urban planning and design. Land Use Policy. 57:356–367. doi: 10.1016/j.landusepol.2016.06.004.
- Jamali AA, Behnam A, Almodaresi SA, He S, Jaafari A. 2023. Exploring factors influencing urban sprawl and land-use changes analysis using systematic points and random forest classification. Environ Dev Sustain. [accessed 2023 July 28]. doi: 10.1007/s10668-023-03633-y.
- Kim JH. 2011. Linking land use planning and regulation to economic development: a literature review. J Plan Liter. 26(1):35–47. doi: 10.1177/0885412210382985.
- Lauf S, Haase D, Hostert P, Lakes T, Kleinschmit B. 2012. Uncovering land-use dynamics driven by human decision-making–a combined model approach using cellular automata and system dynamics. Environ Modell Softw. 27–28:71–82. doi: 10.1016/j.envsoft.2011.09.005.
- Lerner DN, Harris B. 2009. The relationship between land use and groundwater resources and quality. Land Use Policy. 26: s 265–S273. doi: 10.1016/j.landusepol.2009.09.005.
- Li C, Gao BP, Wu YM, Zheng KJ, W Y. 2022. Dynamic simulation of landscape ecological risk in mountain towns based on PLUS model. J Zhejiang Univ Sci B. 23(1):84–88. doi: 10.1631/jzus.B2100508.
- Li J, Cao Y, Li Y, Chu J, Wang Y, Ma M. 2023. Using EL-CA model to predict multi-scenario land sustainable use simulation and urban development. J Exp Nanosci. 18(1):2170352. doi: 10.1080/17458080.2023.2170352.
- Li SF, Hong ZL, Xue XP, Zhang FJ, Shi W. 2022. Multi-scenario simulation of LUCC in Binzhou City based on Logistic-CA-Markov coupling model. Res Soil Water Conserv. 29(4):292–299.
- Lin MZ, Ge ZP, Ji ST, Xie GW. 2016. Ecological risk assessment and land use change in Zhongshan City. Ecol Sci. 35(5):96–104.
- Liu SH, He SJ. 2002. A spatial analysis model for measuring the rate of land use change. J Nat Resour. 17(5):533–539. (in Chinese).
- Liu HY, Lin MZ, Zhou RB, Zhong L. 2021. Spatial and temporal evolution of habitat quality in Guangdong-Hong Kong-Macao Greater Bay Area based on InVEST model. Ecol Sci. 40(3):82–91.
- Liu J, Kuang W, Zhang Z, Xu X, Qin Y, Ning J, Zhou W, Zhang S, Li R, Yan C, et al. 2014. Spatiotemporal characteristics, patterns, and causes of land-use changes in China since the late 1980s. J Geogr Sci. 24(2):195–210. doi: 10.1007/s11442-014-1082-6.
- Liu JH, Hu TG, Pan XJ, Zhang DR, Zhng L, Li Y. 2018. Simulating coastal wetland changes in Hangzhou Bay using Markov-CLUES coupling model. Ecol Environ Sci. 27(7):1359–1368.
- Liu JY. 1997. Study on national resources & environment survey and dynamic monitoring using remote sensing. J Rem Sens. (3):225–230.
- Liu X, Liang X, Li X, Xu X, Ou J, Chen Y, Li S, Wang S, Pei F. 2017. A future land use simulation model (FLUS) for simulating multiple land use scenarios by coupling human and natural effects. Landscape Urban Plann. 168:94–116. doi: 10.1016/j.landurbplan.2017.09.019.
- Liu Z, Liu S, Jin H, Qi W. 2017. Rural population change in China: spatial differences, driving forces and policy implications. J Rural Stud. 51:189–197. doi: 10.1016/j.jrurstud.2017.02.006.
- Liu Z, Wang S, Fang C. 2023. Spatiotemporal evolution and influencing mechanism of ecosystem service value in the Guangdong-Hong Kong-Macao Greater Bay Area. J Geogr Sci. 33(6):1226–1244. doi: 10.1007/s11442-023-2127-5.
- Long H. 2014. Land use policy in China: introduction. Land Use Policy. 40:1–5. doi: 10.1016/j.landusepol.2014.03.006.
- Luo D, Xu YQ, Shao XM, Wang J. 2008. Advances and prospects of spatial optimal allocation of land use. Prog Geogr. 28(05):791–797.
- Luo G, Yin C, Chen X, Xu W, Lu L. 2010. Combining system dynamic model and CLUE-S model to improve land use scenario analyses at regional scale: a case study of Sangong watershed in Xinjiang, China. Ecol Complexity. 7(2):198–207. doi: 10.1016/j.ecocom.2010.02.001.
- Mohamed A, Worku H. 2020. Simulating urban land use and cover dynamics using cellular automata and Markov chain approach in Addis Ababa and the surrounding. Urban Clim. 31:100545. doi: 10.1016/j.uclim.2019.100545.
- Mooney HA, Duraiappah A, Larigauderie A. 2013. Evolution of natural and social science interactions in global change research programs. Proc Natl Acad Sci USA. 110 Suppl 1(Suppl 1):3665–3672. doi: 10.1073/pnas.110748411.
- Nouri J, Gharagozlou A, Arjmandi R, Faryadi S, Adl M. 2014. Predicting urban land use changes using a CA–Markov model. Arab J Sci Eng. 39(7):5565–5573. doi: 10.1007/s13369-014-1119-2.
- Petek F. 2005. Typology of Slovenia’s Alpine Region with emphasis on land use and changes in land use. AGS. 45(1):33–52. doi: 10.3986/AGS45102.
- Pontius RG Jr., Schneider LC. 2001. Land-cover change model validation by an ROC method for the Ipswich watershed, Massachusetts, USA. Agric Ecosyst Environ. 85(1–3):239–248. doi: 10.1016/S0167-8809(01)00187-6.
- Rounsevell MDA, Reay DS. 2009. Land use and climate change in the UK. Land Use Policy. 26:S160–S169. doi: 10.1016/j.landusepol.2009.09.007.
- Ruddiman WF. 2013. The anthropocene. Annu Rev Earth Planet Sci. 41(1):45–68. doi: 10.1146/annurev-earth-050212-123944.
- Shi PJ, Wang JA, Feng WL, Ye T, Ge Y, Chen J, Liu J. 2006. Response of eco-environmental security to land use/cover changes and adjustment of land use policy and pattern in China. Adv Earth Sci. (2):111–119. 10.11867/j.issn.1001-8166.2006.02.0111.
- Turner BL II, Skole D, Sanderson S, Fischer G, Fresco L, Leemans R, editors. 1995. Land-use and land-cover change. Science/Research plan. (IGBP Report; No. 35). IGBP. https://www.ihdp.unu.edu/file/get/8605.
- Turner BL, Lambin EF, Reenberg A. 2007. The emergence of land change science for global environmental change and sustainability. Proc Natl Acad Sci USA. 104(52):20666–20671. doi: 10.1073/pnas.0704119104.
- Wang B, Cheng W. 2022. Effects of land use/cover on regional habitat quality under different geomorphic types based on InVEST model. Rem Sens. 14(5):1279. doi: 10.3390/rs14051279.
- Wang M, Cai L, Xu H, Zhao S. 2019. Predicting land use changes in northern China using logistic regression, cellular automata, and a Markov model. Arab J Geosci. 12(24):1–12. doi: 10.1007/s12517-019-4985-9.
- Wang SY, Liu JY. 2001. Analysis on spatial-temporal features of land use in China. Acta Geogr Sin. 56(6):631–639. (in Chinese).
- Wang SY, Liu JY, Zhang ZX, Zhou QB, Wang CY. 2002. Spatial pattern change of land use in China in recent 10 years. Acta Geogr Sin. (5):523–530.
- Wang XL, Bao YH. 1999. Study on the methods of land use dynamic change research. Prog Geogr. (1):83–89.
- Wang Y, Li GB. 2022. Research on the mechanism of rural spatial involution in the transition period. City Plan Rev. 46(1):69–76.
- Wu CJ. 1991. On the research core of geography: human-earth relationship territory system. Econ Geogr. 11(3):1–6.
- Wu D, Li H, Ai N, Huang T, Gu JS. 2020. Predicting spatiotemporal changes in land use and habitat quality based on CA-Markov: A case study in central Ningxia, China. Chin J Eco-Agric. 28(12):1969–1978. doi: 10.13930/j.cnki.cjea.200221. (in Chinese).
- Wu XX, Liu XQ, Liang X, Chen GL. 2018. Multi-scenarios simulation of urban growth boundaries in Pearl River Delta based on FLUS-UGB. J Geo-Inform Sci. 20(4):532–542.
- Xiang Q, Kan A, Yu X, Liu F, Huang H, Li W, Gao R. 2023. Assessment of topographic effect on habitat quality in mountainous area using InVEST model. Land. 12(1):186. doi: 10.3390/land12010186.
- Xiao P, Zhou Y, Li M, Xu J. 2023. Spatiotemporal patterns of habitat quality and its topographic gradient effects of Hubei Province based on the InVEST model. Environ Dev Sustain. 25(7):6419–6448. doi: 10.1007/s10668-022-02310-w.
- Xiao WP, Gong JZ, Wei XG. 2019. Spatio-temporal change and its driving factors of dike-pond landscape in Zhongshan, 1980–2015. Ecol Sci. 38(6):64–73.
- Xu GH, Ge QS, Gong P, Fang XQ. 2013. Global change and human sustainable development: challenges and countermeasures. Sci Chin Press. 58(21):2100–2106.
- Xu JY, Zhang ZX, Zhao XL, Liu B, Yi L. 2015. Spatial-temporal characteristics and driving forces of urban sprawl for major cities of the Pearl River Delta region in recent 40 years. Acta Sci Nat Univ Pek. 51(6):1119–1131.
- Yang R, Xu Q, Li L. 2016. Spatial urban-rural transformation and its driving factors in the Pearl River Delta region. Geogr Res. 35(12):2261–2272.
- Yin NN, Tang J, Yang YW, Gao XJ, Song SH, Hu Q. 2023. Variations of shoreline and land use in Guangdong-Hong Kong-Macao Greater Bay Area from 1989 to 2021. Marine Geology Frontiers. 39(5):1–11. doi: 10.16028/j.1009-2722.2022.158. (in Chinese)
- Yohannes H, Soromessa T, Argaw M, Dewan A. 2021. Spatio-temporal changes in habitat quality and linkage with landscape characteristics in the Beressa watershed, Blue Nile basin of Ethiopian highlands. J Environ Manage. 281:111885. doi: 10.1016/j.jenvman.2020.111885.
- Yu ZL, Zhao MS, Gao YF, Wang T, Zhao ZD, Wang SH. 2023. Land use simulation and multi-scenario prediction based on CLUE-S and PLUS models in Huaibei City Online First. J Agric Resour Environ. 1–15.
- Yuan XS, Zhou J, Hu BB, Gao Q. 2023. Multi-scenario simulation and prediction of ecological-productive-living spaces in Guangdong-Hong Kong-Macao Greater Bay Area based on FLUS model. Sci Geogr Sin. 43(3):564–574.
- Zeng LY, Wang J, Wang HY. 2009. Analysis and simulation of cultivated land conversion and distribution in Beijing mountainous areas based on GIS and logistic regression model. Acta Sci Nat Univ Pek. 45(1):165–170.
- Zhang MB. 2013. Analysis on construction land increasing in Reunt 20 years in Zhongshan City based on GIS. Hubei Agric Sci. 52(6):1284–1286.
- Zhang R, Wang YM, Chang JX, Li YY. 2019. Response of land use change to human activities in the Yellow River Basin based on water resources division. J Nat Resour. 34(2):274–287. doi: 10.31497/zrzyxb.20190205.
- Zhang XJ, Zhou QG, Wang ZL, Wang FH. 2017. Simulation and prediction of land use change in Three Gorges Reservoir Area based on MCE-CA-Markov. Trans Chinese Soc Agric Eng. 33(19):268–277.
- Zhang YY, Lu FT, Mai JK, Wang YY. 2021. Analysis of landscape ecological risk evolution based on land use/cover change. Geospat Inform. 19(9):44–49 + 157.
- Zheng JC, Xie BG, You XB. 2022. Evolution of habitat quality and its influencing factors in the different terrain gradient of the Guangdong-Hong Kong-Macao Greater Bay Area from 1980 to 2020. Econ Geogr. 42(8):41–50.
- Zhongshan Statistical Bureau. 2011. Zhongshan statistical yearbook 2011. Zhongshan: Zhongshan Statistics Bureau (中山市统计年鉴). [cited 2023 Aug 21]. http://stats.zs.gov.cn/zwgk/tjxx/tjnj/content/post_1342237.html.
- Zhongshan Statistical Bureau. 2012. Zhongshan statistical yearbook 2012. Zhongshan: Zhongshan Statistics Bureau (中山市统计年鉴). [cited 2023 Aug 21]. http://stats.zs.gov.cn/zwgk/tjxx/tjnj/content/post_1342238.html.
- Zhongshan Statistical Bureau. 2022. Zhongshan statistical yearbook 2022. Zhongshan: Zhongshan Statistics Bureau (中山市统计年鉴). [cited 2023 Aug 21]. http://stats.zs.gov.cn/zwgk/tjxx/tjnj/content/post_2184419.html.
- Zhu HY, Li XB. 1997. Discussion on the method of regional land use change index model. Acta Geogr Sin. (5):643–650.