
 ?Mathematical formulae have been encoded as MathML and are displayed in this HTML version using MathJax in order to improve their display. Uncheck the box to turn MathJax off. This feature requires Javascript. Click on a formula to zoom.
Abstract
Fire was a serious natural disturbance to forest ecosystems. In this study, a national-scale forest fire risk model (RF_NTL) was proposed in mainland China by incorporating a new human activity factor (NTL) from nighttime light data. For objective verification of model’s performance, the logistic regression model (LR) and random forest model (RF) were also built in this paper. Results showed that the RF_NTL model fitted with an AUC value up to 0.95, which was superior to the conventional LR model and RF model. The RF_NTL model also had good generalization ability and stability on annual and monthly scales, helping to accurately forecast forest fire risk. Moreover, the spatial distribution of forest fire risk based on RF_NTL model was detailed and reasonable on a national scale. Forest fire high-risk areas in China were mainly concentrated in the northeast and southwest regions. This study could provide references for future relevant research.
1. Introduction
Forests, known as the ‘lungs of the earth’, were essential for human survival. It played a vital role in climate regulation and carbon cycling (Pourtaghi et al. Citation2016; Li et al. Citation2022). As one of the common disturbances, forest fires seriously affected the biodiversity, function, and structure of forest ecosystems, which might even harmed lives and regional economy (Su et al. Citation2019; Sannigrahi et al. Citation2020). Thus, researchers worldwide have pursued a series of studies on reducing the risk of forest fires. From 2017 to 2021, China incurred an average of more than 1,900 forest fires annually, leading to devastated forest areas of approximately 13,000 hectares and economic losses amounting to hundreds of millions of dollars according to the China Forestry Statistical Yearbook (http://www.stats.gov.cn/sj/ndsj/). With the rapid development of human society, the ecological environment has become increasingly harsh, posing significant challenges to forest ecological management in China.
Forest fire risk could be defined as the likelihood or potential extent of forest fires occurring within a certain forest area (Vallejo-Villalta et al. Citation2019). The occurrence of forest fire could be influenced by the interaction of multiple factors. Specifically, meteorological conditions were considered primary factors contributing to the occurrence of forest fires, because they could change the water content of combustibles through temperature, precipitation, and humidity (Cui et al. Citation2022). Furthermore, topographic differences could change the composition and distribution of vegetation, affecting forest fires’ occurrence and spread (Ma et al. Citation2020). The moisture content of combustibles would directly affect the occurrence risk and burned areas of forest fires (Wu et al. Citation2021).
Moreover, intense human activities would enhance the occurrence probability of forest fires (Wu et al. Citation2014; Kim et al. Citation2019; Kolanek et al. Citation2021). Thus, human activities were usually considered as one of important factors for modeling the risk of forest fires. For example, Martınez (Martínez et al. Citation2009) analysed the human factors influencing the forest fire risk in Spain, and built a human fire ignition model using logistic regression analysis. You (You et al. Citation2017) used human factors (e.g. proximity to settlement and road) to construct a forest fire risk index to measure the occurrence probability of forest fires. Pourtaghi (Pourtaghi et al. Citation2016) utilized the distance to roads factor to characterize human activities and analysed its importance to forest fire risk. Naderpour (Naderpour et al. Citation2021) used human factors (e.g. road density, land cover, distance from the road, and distance from the river) to explore a model of forest fire risk. Zheng (Zheng et al. Citation2020) modeled the forest fire risk in cloud-rich areas by introducing human activity factors.
Nevertheless, previous studies usually considered human factors based on indirect assessments of human activities (e.g. GDP and population density) or accessibility to forest areas (e.g. distance to roads and distance to settlements). GDP and Population density are commonly measured at the administrative unit level, making them less suitable for fine-scale spatial analysis. Although residential information reflected from Landsat and MODIS land classification can reflect human habitation to some extent, abandoned facilities are difficult to represent. In other words, these abandoned facilities can create uncertainties for exacting the human activity factor. Nighttime light data captured nocturnal man-made light on the Earth’s surface and gave unique observations of human activities (Elvidge et al. Citation1997; Cao et al. Citation2019). As a new type of remote sensing data compared to products from visible, near-infrared, and radar sensors, nighttime light data could intuitively reflect differences in human activity and provide information closely related to urban development (e.g. roads and residential areas) (Tan et al. Citation2018; Lan et al. Citation2020; Lu et al. Citation2021; Zhang et al. Citation2023). Compared to GDP and Road data, nighttime light remote sensing data presented distinct advantages including its high resolution, convenient accessibility, and wide coverage. Recently, nighttime light intensity information has been used to characterize human activities and discuss its impact on forest fire occurrence (Chen and Jin Citation2022; Zhang et al. Citation2023), it has not yet been used to construct a new human activity factor for forest fires. Thus, the nighttime light data was selected in this study to calculate the human activity factor.
However, the nighttime light intensity dynamically changes in practice. This means that, without further processing, the direct use of unstable nighttime light sources would introduce uncertainties to the model’s prediction results. Thus, this study proposed a new human activity factor for modeling the forest fire risk at the national scale. The main aims of this study were as follows: (1) to calculate a new human activity factor using nighttime light data and evaluate its influence on forest fire risk, (2) to build a forest fire risk predicting model for China based on nightime lights and map the forest fire risk, and (3) to analyse the spatial and temporal variation of forest fires in China from 2001 to 2020.
2. Study area and data
2.1. Study area
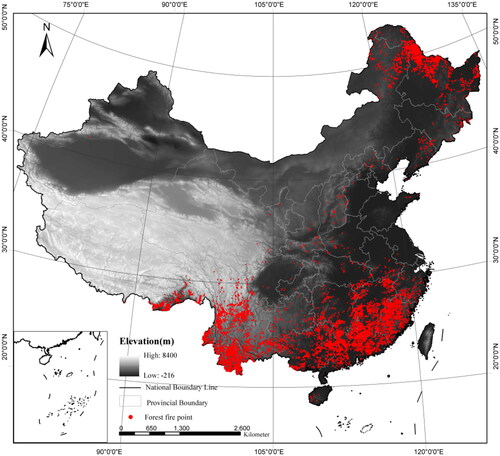
In this study, mainland China was selected as a study area located in the eastern Asia. China was a vast country with a distance of about 5000 km from east to west. It mainly includes five types of terrain: mountains, plains, basins, hills, and plateaus. This area has a variable climate, with a predominantly monsoonal climate in the east, a temperate continental climate in the northwest, and an alpine climate in the Qinghai-Tibet Plateau region. Meanwhile, China has abundant forest resources with 21.63% forest cover, mainly in the northeast (e.g. coniferous and mixed coniferous forests), south (e.g. pine and fir forests and broadleaf evergreen forests), and southwest (e.g. subalpine coniferous and mixed coniferous forests). Recently, hundreds to thousands of hectares of forests in China have been vulnerable to fire each year. More studies were needed to predict the risk of forest fires in China to reduce losses caused by forest fires.
2.2. Forest fire data
Forest fire data used in this study were obtained from the MOD14A1 product of MODIS. The original MOD14A1 product provided daily information (e.g. latitude, longitude, time, and confidence level) about fire occurrence with a 1 km resolution, but not fire type. Furthermore, fire where the land type was forest was identified as forest fire by overlaying the land use type data (MCD12Q1). Then, 160871 forest fire data were applied in this study (see in ). When constructing a forest fire risk model, in addition to forest fire data, a certain quantity of non-forest fire data were also required. This study established a buffer zone of 5 km based on forest fire points and then randomly created non-fire point data in the forest area outside the buffer zone to reduce the spatial auto-correlation between forest fire point and forest non-fire point data (Kalabokidis et al. Citation2007; Guo et al. Citation2017a; Su et al. Citation2018). Finally, 241307 non-fire data were randomly created at a ratio of 1:1.5 (Guo et al. Citation2017b), since non-fire data were needed to build the following model.
Figure 1. Distribution of forest fire points in China, 2001–2020.
2.3. Risk factors
Ten risk factors were considered in this study as modeling drivers of forest fire risk, which could be classified into four categories: meteorology, topography, combustibles, and human activities. The specific information was shown in . showed the distribution of the ten risk factors.
Figure 2. Risk factors of forest fires ((a) Night light image of China in 2020, (b) 20-20 h precipitation distribution graph of China on March 30, 2020, (c) Average temperature distribution graph of China on March 30, 2020, (d) Average relative humidity distribution graph of China on March 30, 2020, (e) Average wind speed distribution graph of China on March 30, 2020, (f) Elevation distribution graph of China, (g) Slope distribution graph of China in (h) Distribution of slope direction in China, (i) Distribution of NDVI in China on March 30,2020, and (j) Distribution of NMDI in China on March 30, 2020).
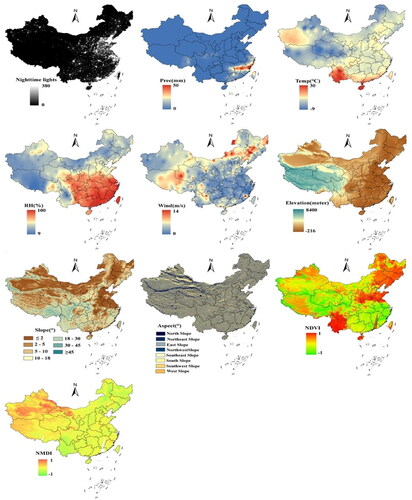
Table 1. Risk factors of forest fire.
2.3.1. Nighttime light data
Human activities could affect forest fire occurrence, indicating a need to incorporate human activity factors in modeling forest fire risk. In recent studies of urban expansion simulation and carbon emission estimation, nighttime light data have been used to characterize the intensity of human activities (Yang et al. Citation2020; Liu et al. Citation2021). Due to the time span of the research being from 2001 to 2020, and the existing nighttime light dataset not covering such a long time range, this study utilized two different sources of nighttime light datasets. The Operational Line Scan System (OLS) instrument on board Defence Meteorological Satellite Program (DMSP) satellite provided a global annual stable light product from 1992 to 2013 (Lv et al. Citation2020). From 2001 to 2013, this study downloaded DMSP-OLS annual stable nighttime light images through the website of NOAA's NCEI (https://www.ngdc.noaa.gov/eog/dmsp/downloadV4composites/). The Colorado School of Mines generated a global annual stable composite light dataset (2012-2021) based on the monthly synthetic data that were generated from low light image day/night band data collected by the Visible Infrared Imaging Radiometer Suite (VIIRS) aboard the Suomi-NPP satellite (Elvidge et al. Citation2021). From 2014 to 2020, this study obtained VIIRS annual average nighttime light imageries at the website of the Colorado School of Mines (https://payneinstitute.mines.edu/eog/).
2.3.2. Meteorology
In this work, meteorological factors selected for modeling the forest fire risk included: 20 h-20 h precipitation (Prec), daily average temperature (temp), daily average relative humidity (rh), and daily average wind speed (wind). These daily meteorological datasets were obtained from the Chinese Surface Climate Daily Value Dataset (V3.0) of the National Meteorological Science Data Centre (http://data.cma.cn/). Meteorological station data existed without monitoring and invalid data, which were excluded in this study. The inverse distance weight interpolation (IDW) method was first utilized to interpolate the Chinese daily weather station point data into raster data with a spatial resolution of 1 km for 2001-2020. Then we derived daily meteorological variables for fire and non-fire points based on the ‘extract value to point’ method on ArcGIS 10.6 software.
2.3.3. Topography
The topographic factors used in this study include: elevation, slope, and aspect, which were calculated using DEM data in China. The DEM data were obtained from the ‘Geospatial Data Cloud’ platform (https://www.gscloud.cn/) and were processed with SRTM3 V4.1 data with a spatial resolution of 90 m. All pre-processing steps (e.g. merging and clipping) were performed in ArcGIS 10.6 software. Besides, to characterize the impact of slope direction factors on forest fire occurrence better, this paper divided the slope direction into north slope (0°–22.5°, 337.5°–360°), northeast slope (22.5°–67.5°), east slope (67.5°–112.5°), southeast slope (112.5°–157.5°), south slope (157.5°–202.5°), southwest slope (205°– 247.5°), west slope (247.5°–292.5°), northwest slope (292.5°–337.5°).
2.3.4. Combustibles
This study selected normalized difference vegetation index (NDVI) and normalized multi-band drought index (NMDI) as combustible factors for modeling the forest fire risk. Specifically, NDVI could represent vegetation growth status (Chen et al. Citation2022). NMDI characterized vegetation water content (Wang and Qu Citation2007). For calculating the daily NDVI and NMDI value from 2001 to 2020, the MOD09GA dataset with a spatial resolution of 500 m was applied in this study, which was from the NASA website (https://earthdata.nasa.gov/). This study needed the pre-processing of the MOD09GA product, such as splicing, re-projection, and clipping.
The formula for NDVI was as follows:
(1)
(1)
The formula for NMDI was as follows:
(2)
(2)
The
in EquationEqs. (1)
(1)
(1) and Equation(2)
(2)
(2) correspond to the surface reflectance at the central wavelength of 0.645, 0.86, 1.64, and 2.13 µm bands in the MODO9GA product.
3. Methodology
3.1. Calculation of human activity factor
The DMSP-OLS annual stable lighting dataset had been processed through multiple filters to eliminate lighting interference caused by aurora borealis, wildfires, moonlight, and clouds, but there was still a problem of over-saturation in the data (Zhong et al. Citation2020). The VIIRS annual average night light data has also undergone multiple filtering processes, which zero out biomass burning, auroras, and background light, but other noise (such as gas flares) still existed (Nechaev et al. Citation2021).
To reduce the instability of VIIRS annual average night light data, this paper performed maximum value processing (assuming that the maximum pixel values of nighttime light images were located in Shanghai and Beijing, the most developed cities in China, and assigning image elements above the maximum pixel values to 0 (Nechaev et al. Citation2021)) and noise filtering (reassigning image element values below 0.6nw/cm/sr to 0). As DMSP-OLS and VIIRS nighttime lighting data were obtained from different types of sensors on different satellites, the two data had different magnitudes. To ensure the continuity and the same magnitude of the two data, this study normalized the two dataset.
In order to explore the influence of human activities reflected by nighttime lights on the occurrence of forest fires, a new method was proposed in this study. The method searched for nighttime light pixels with DN values greater than 0 in a 5 km radius centered on the forest. If no eligible image element was found, the search radius was gradually expanded in 5 km increments until an eligible image element was found. Subsequently, the intensity of human activity within this radius was calculated.
(3)
(3)
Where i was the number of pixels and DNi was the pixel value of each pixel.
3.2. RF_NTL model
Random forest is a typical ensemble learning algorithm that can address regression or classification problems (Breiman Citation2001; Probst and Boulesteix Citation2017; Liu and Sun Citation2019). Random forest algorithm is widely applied and has high accuracy and can process high-dimensional or huge amount of datasets. In this study, random forest algorithm was used to build a forest fire risk model (RF_NTL) for mainland China based on risk factors (i.e. human activity, meteorology, topography, and combustibles) and analysed the influence of these factors on the occurrence of forest fires. In fact, the dependent variable in this study was a binary variable (i.e. forest fire occurrence and forest fire non-occurrence), and hence random forests was used for classification. In classification, Random forest extracted multiple samples in the dataset by bootstrap resampling method to construct various decision trees, and then obtained the classification results by voting (Chan and Paelinckx Citation2008). Random forest classification algorithms could provide the probability of forest fire occurrence with a value between 0 and 1. In order to demonstrate more visually the spatial distribution of forest fire risk, the probability of forest fires occurrence was classified into five forest fire risk levels: very low risk (0–0.2), low risk (0.2–0.4), moderate risk (0.4–0.6), high risk (0.6–0.8), and very high risk (0.8–1).
In this study, the Scikit-learn Package in Python was used to construct the RF_NTL model and rank the importance value of each variable. The Random Forest algorithm had two important parameters that need to be defined (i.e. the number of trees (ntree) and the number of variables at each split (mtry)). According to the previous literature (Hong et al. Citation2018; Rihan et al. Citation2019), this study set mtry as the number of variables, and ntree was set to 901 by the grid searching method. Except for these two parameters, the other parameters were default values.
Variable importance was derived from Random forest by evaluating the degree of it’s contribution to a model’s accuracy (Guo et al. Citation2016b). The higher the importance of a variable, the more it contributes to the accuracy of the model prediction. Moreover, to eliminate the bias of the model, 80% of the total sample data was used for model training, and the remaining 20% was used for validation.
3.3. Model accuracy evaluation
A validation experiment was designed to validate that the introduction of nighttime light data has improved the accuracy of forest fire risk prediction. We built two forest fire risk models (RF, LR) based on random forest and logistic regression algorithms using the forest fire risk factors, excluding the human activity factor (NTL) used for the RF_NTL model. Then, this study compared and analysed the forest fire prediction accuracy of LR, RF, and RF_NTL model. In particular, the variables for the RF and LR models included meteorological factors (Prec, Wind, Temp, and RH), topographic factors (Elevation, Slope, and Aspect), and combustible factors (NDVI and NMDI). The RF_NTL model variables included the human activity factor (NTL), meteorological factors (Prec, Wind, Temp, and RH), topographic factors (Elevation, Slope, and Aspect), and combustible factors (NDVI and NMDI).
Accuracy and ROC curve evaluation metrics were employed to evaluate the model’s accuracy. Accuracy indicates the proportion of classified samples correctly predicted by the model to the total samples. The ROC curve was used to measure the model accuracy via the area under the curve (AUC). AUC values less than 0.7 represented poor model accuracy, values between 0.7 and 0.8 represented average model accuracy, values between 0.8 and 0.9 represented high model accuracy, and values above 0.9 represented remarkable model accuracy (Milanović et al. Citation2020). In other words, the closer the AUC value is to 1, the higher the model accuracy is.
4. Results
4.1. Spatial and temporal distribution characteristics of forest fire points
showed that the number of forest fires in China varied widely across the years. From 2001 to 2020, the highest forest fires occurred in 2004 (12404), and the smallest number of forest fires were observed in 2018 (4015). Meanwhile, demonstrated a seasonal pattern of forest fires in China. Specifically, forest areas in China were prone to fire from January to April, and the number of forest fires in China was small from June to September.
Figure 3. Spatial and temporal distribution of forest fires in China.
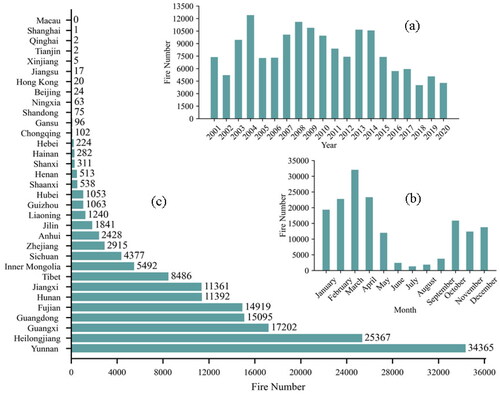
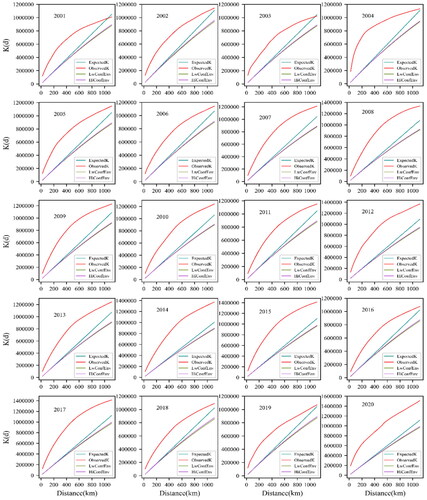
Furthermore, using a toolbox of ArcGIS 10.6 software, the Ripley’s K function (99% confidence) was applied to investigate the spatial aggregation characteristics of forest fire occurrence. This function was used to determine whether elements showed statistically significant clustering or dispersion over a specific distance range and had widely implemented in forest fire spatial distribution studies (Vadrevu and Badarinath Citation2009; Guo et al. Citation2016a; Su et al. Citation2018). displayed that the spatial distribution of forest fires in China exhibited a significant aggregation characteristic. Results in and showed that forest fires in the study area were mainly distributed in Yunnan Province and Heilongjiang Province, which was mainly related to the rich vegetation and unique weather situation in these regions.
Figure 4. K function results for 2001-2020 (red line represents ObservedK, blue indicates ExpectedK, purple represents HiConfEnv, green represents LwConfEnv (ripley’s K tool outputs the values of Expected K, LwConfEnv, HiConfEnv, observed K, etc. If the observed K is greater than Expected K and observed K is greater than LwConfEnv, the point data at that distance display the remarkable clustering feature. If the Observation K is smaller than the expectation K and the Observation K is smaller than HiConfEnv, the point data spatial distribution is significantly discreet)).
4.2. Descriptive statistics
showed descriptive statistics the relationship between the number of forest fires and risk factors in China from 2001 to 2020. It is worth noting from that the number of forest fires decreased as the distance to the nighttime light increased. Forest areas within a 5 km radius of the nighttime light had the highest number of forest fires. also displayed that the number of forest fires in China decreased with an increase in precipitation (). However, it increased initially with the increase in temperature (), average relative humidity (), and wind speed (), reaching a peak and then decreasing with further increase. The highest number of forest fires was in the precipitation interval of 0–2.5 mm, the temperature interval of 15 °C–20 °C, the average relative humidity interval of 60%–70%, and the wind speed interval of 1 m/s–2 m/s.
Figure 5. Descriptive statistics of risk factors in forest fire data from 2001 to 2020.
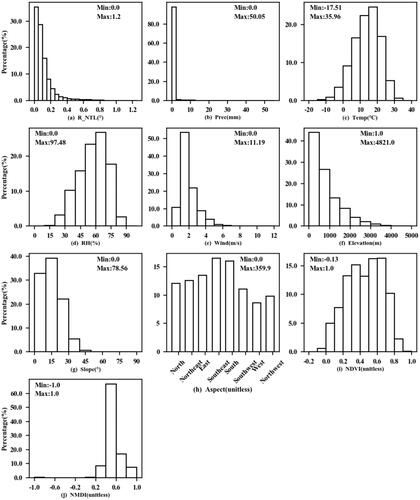
Moreover, topographic factors influenced the occurrence of forest fires. showed that the number of forest fires was higher on the south-facing slope compared to the north-facing slope. The number of forest fires decreased with an increase in elevation, and areas with higher slope had fewer forest fires. To be specific, the number of forest fires was very low in areas with altitudes higher than 3500 m above sea level. Areas with slopes below 30° and southern slopes had a high number of forest fires.
Furthermore, combustibles were the material basis for forest fires. displayed that the number of forest fires increased with increasing NDVI and NMDI, and then decreased. The interval with the most forest fires was 0.3–0.7 of NDVI and the most forest fires were in the interval 0.4–0.6 of NMDI. That is, areas with rich and dry vegetation were prone to forest fires.
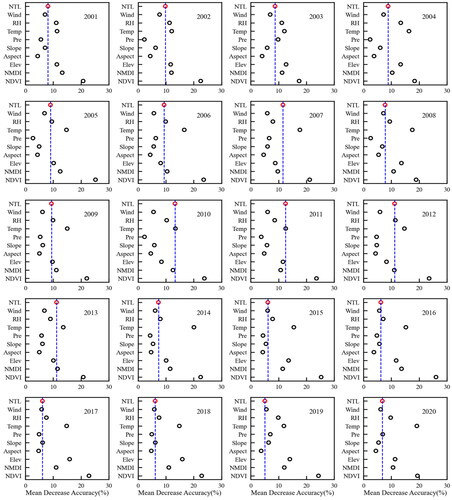
4.3. Importance of risk factor
In the RF_NTL model, the importance of risk factors (NTL, Prec, Wind, Temp, RH, Elevation, Slope, Aspect, NDVI, and NMDI) would be ranked. A higher factor of importance means a greater contribution to model performance. presented the importance rank of risk factors for each year from 2001 to 2020. showed that NDVI had the greatest influence on forest fire occurrence and NTL was in the middle of importance among all factors. For the RF_NTL model, NTL had an important influence on forest fire occurrence compared with other factors.
Figure 6. Ranking of driving factors importance.
4.4. Model evaluation
showed the ROC curves for the LR model, RF model, and RF_NTL model. The AUC value of RF_NTL model was 0.95, which was close to 1. The RF_NTL accuracy was 87%, approximately 13% higher than LR model and 5.63% superior to RF model (). Logistic regression is a non-integrated algorithm that is not good at dealing with nonlinear relationship problems. The relationship between forest fire occurrence and risk factors was not simple linear, which was the reason why the LR model had lower accuracy. The RF_NTL model had taken into account the influence of human activities on forest fire occurrence, so the accuracy of the RF_NTL model was higher than that of the RF model. Also, the RF_NTL model had higher accuracy than the LR and RF models, confirming that the introduction of NTL could improve the accuracy of forest fire risk prediction.
Figure 7. ROC curves (red indicates ROC curves for LR, blue indicates ROC curves for RF_NTL, and yellow indicates ROC curves for RF).
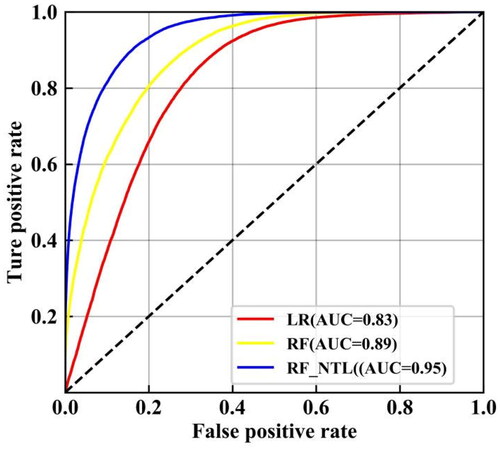
Table 2. Model performance.
4.5. Temporal analysis of forest fire risk based on the RF_NTL model
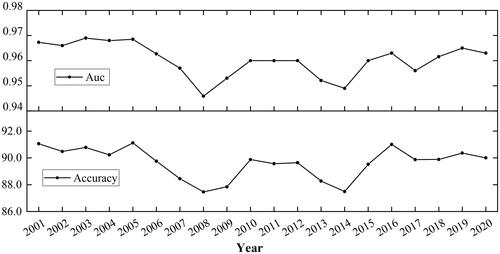
Model stability is a key factor in evaluating its reliability and predictive accuracy. This study further evaluated the performance of the proposed model (i.e. RF_NTL) from monthly and yearly scales. The RF_NTL model predicted high accuracy on different months and years without large fluctuations. Specifically, according to monthly and yearly scales, forest fire data were divided into 12 and 20 sample sets. For each sample set, 80% was used for model training, and 20% was applied for model evaluation. showed that the accuracy of the proposed model on a monthly scale was between 87% and 91%, and the AUC was from 0.94 to 0.97. displayed that, for the proposed model on an annual scale, the accuracy lay between 86% and 92%, with an AUC between 0.94 and 0.97.
Figure 8. Evaluation of RF_NTL based on a monthly scale.
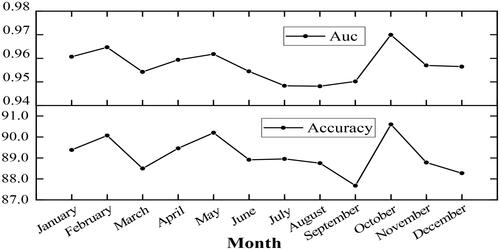
Figure 9. Evaluation of RF_NTL based on an annual scale.
4.6. Spatial distribution of forest fire risk based on the RF_NTL model
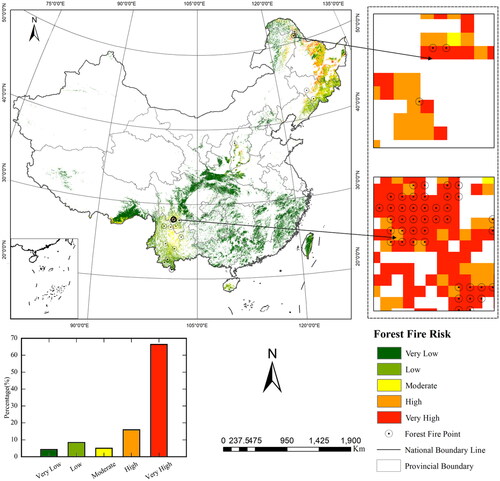
Based on the RF_NTL model, this study had constructed multi-year forest fire risk results for mainland China. It was found that high-risk forest fire areas were mainly concentrated in the northeast and southwest regions, which was consistent with the historical distribution of forest fires. These regions had abundant forest resources and were susceptible to extreme weather conditions. For further analysis, we selected the forest fire risk map of mainland China on March 30, 2020 for detailed research.
showed that some forest areas in southern Tibet, southwest Sichuan, north Yunnan, south-central and northwest Shanxi, eastern Shaanxi, northeast Liaoning, central Jilin, north-central and eastern Heilongjiang, and eastern Inner Mongolia had high risk (level 4). For areas in southwest Sichuan, northwest Shanxi, northeast Liaoning, north-central Jilin, north-central and east Heilongjiang, and east Inner Mongolia, the risk level of forest fires was very high risk (level 5). On that day, 65.83% of the forest fires fell in very high-risk areas (level 5), and a small number of forest fires were found in very low-risk areas (level 1), but less than 5%. According to a report from China’s emergency information (https://www.emerinfo.cn/2020-04/07/c_1210547746.htm), the national forest fire risk on this day (March 30, 2020) was in north Heilongjiang, northeast Inner Mongolia, southern Tibet, south, and north Yunnan. The spatial distribution of forest fire risk shown in was detailed and reasonable.
Figure 10. Spatial distribution of forest fire risk in China.
5. Discussion
Previous studies on modeling forest fire risk in China mainly focused on Chinese northern forests (e.g. Daxing’an Mountains (Chen et al. Citation2015)) and subtropical forests (e.g. Fujian Province (Guo et al. Citation2016b; Zeng et al. Citation2022)). Incorporating a new factor calculated from nighttime light data, this study has proposed a national-scale forest fire risk model based on the random forest algorithm. Verification results demonstrated that the accuracy of the proposed model was 87%, with an AUC value of 0.95. The usage of nighttime light data to assess human activity intensity for forest fire risk prediction was feasible and could be applied to other larger regions of the globe.
At an annual scale from 2001 to 2020, the accuracy of proposed model exceeded 86%, and its AUC exceeded 0.94. Meanwhile, the accuracy of proposed model exceeded 87%, and its AUC exceeded 0.94 from January to December. These results indicated that the proposed model has good generalization ability and stability in modeling the forest fire risk. Moreover, it could be seen from that the proposed model could effectively assess the spatial distribution of forest fire risk in China, helping the fire prevention management department to formulate effective and targeted measures.
In this study, nighttime light data was employed to characterize human activities for the modeling forest fire risk. The results of factor importance ranking indicated that the importance of the NTL was higher than that of slope, aspect, precipitation, and wind. Thus, the influence of human activities on forest fire occurrence could not be ignored. Previous studies have shown that human activities significantly impact forest fire occurrence (Ganteaume et al. Citation2013; Liu et al. Citation2018; Vigna et al. Citation2021). The global pattern of forest fire occurrence suggested that wildfire occurrence was closely related to human activities such as, agricultural burning, purposeful burning, and land use change. Meanwhile, showed that the accuracy of the proposed model was improved by 6% after incorporating nighttime light data.
Human activities were one of the major factors contributing to forest fires. However, modelling these factors in space and time was often considered challenging. Previous studies usually have chosen factors such as, distance to roads, distance to settlements, population GDP, and population density as human activity factors for the modeling forest fire risk (Su et al. Citation2018; Li et al. Citation2020; Xiong et al. Citation2020).
For roads and settlements, previous studies usually used Euclidean distance to calculate the distance to roads and settlements (Puri et al. Citation2011; Woo et al. Citation2017; Nikhil et al. Citation2021). However, the spatial distribution of roads and settlements was sometimes not detailed enough. At the same time, roads and settlements would change, which means that a large uncertainty appeared when topographic maps calculated human activity indicators could affect forest fire risk modeling performance. Or, the density analysis method was applied to calculate the density of roads and settlements based on topographic maps. For population GDP and population density, GDP and population data were generally statistical rather than spatial. Some studies obtained the number of people per square kilometre from population data and administrative boundaries (Mourão and Martinho Citation2014; Kolanek et al. Citation2021). However, these data not only suffered from spatial detail but also lacked real-time updateability. The number of births and deaths in the population varied widely yearly. However, nighttime light data could characterize human activities well and was a continuous spatial data. More notably, the results of risk factors importance rank showed that NTL was more important than some meteorological factors, topographic factors, and combustible factors. Therefore, it was reasonable and practical to use the human activity factor calculated using nighttime light data as one of the forest fire risk factors.
Meanwhile, among the meteorological factors, average temperature influenced on forest fire occurrence most. The number of forest fires in mainland China initially increased as temperatures rose, but gradually decreased as temperatures continued to rise (). Usually, high temperatures occurred in the summer, while China experienced abundant rainfall and humid air during the summer, resulting in a low risk of wildfires. Additionally, occurrences of abnormally high temperatures were rare, resulting in a low number of forest fires. Compared with the other variables, NDVI among the combustible factors was the most important and had the most significant effect on forest fire occurrence. Some research also showed that vegetation had an important influence on forest fire occurrence (Chuvieco et al. Citation2004; Pourtaghi et al. Citation2015). We also confirmed this idea. In general, the higher the vegetation coverage, the more fuel was available, making the area susceptible to forest fires. The elevation of topographic factors had a greater influence on the occurrence of forest fires. Forest fires mainly occurred in low-elevation areas between 0 and 1000 meters (). Forest fires were rarely found in high elevation areas where human activities were less frequent.
Due to the large time span of the study, this research used the DMSP-OLS nighttime light and VIRRS nighttime light datasets. When using nighttime lights datasets from different sources, issues such as data quality, time span, consistency, and integration methods need to be considered to ensure the reliability and accuracy of the study. Currently, there was a lack of standardized methods for processing the two types of nighttime light datasets, as indicated by the existing research. In addition, due to the difficulty in obtaining long-term national lightning data, this study did not consider the impact of lightning on forest fires and only selected temperature, humidity, precipitation, and wind speed as meteorological factors for forest fire occurrence. Therefore, future research can explore the impact of lightning on forest fires and further address the integration issues of nighttime lights datasets to improve the accuracy of forest fire risk prediction.
6. Conclusion
This study investigated the impact of a new human activity indicator (NTL) calculated using nighttime light data on the occurrence of forest fires. The results showed that NTL had significant effects on forest fire occurrence, so using nighttime light data to characterize human activities was an efficient and reasonable method. Based on the NTL, meteorology, topography, and combustibles, this study built a national-scale forest fire prediction model (RF_NTL) for the mainland China. Compared with traditional random forest and logistic regression models, the RF_NTL model had better performance in forest fire risk modeling. In addition, the RF_NTL model showed high accuracy and good generalization ability and stability on annual scale and monthly scale. Meanwhile, the forest fire risk distribution map made by RF_NTL model was reasonable and detailed. Thus, this study proposed a human activity factor calculated with nighttime light, which provided guidance for the selection of human activity factors in future forest fire risk researches. At the same time, the model proposed in this study was expected to provide important guidance to the relevant authorities in developing effective fire management measures under the context of the continuing impact by human activities on forest fires.
Authors’ contributions
Ming Chen: Methodology, Investigation, Data curation, Roles/Writing - original draft. Yongqian Wang: Resources, Supervision. Zhong Zheng: Conceptualization, Resources, Writing - Review & Editing. Xingyue You: Writing - Review& Editing. Yaoqiang Zeng: Writing - Review& Editing.
Disclosure statement
The authors report there are no competing interests to declare.
Data availability statement
The data that support the findings of this study are available from the corresponding author, ZZ, upon reasonable request.
Additional information
Funding
References
- Breiman L. 2001. Random forests. Mach Learn. 45(1):5–32. doi: 10.1023/A:1010933404324.
- Cao X, Hu Y, Zhu X, Shi F, Zhuo L, Chen J. 2019. A simple self-adjusting model for correcting the blooming effects in DMSP-OLS nighttime light images. Remote Sens Environ. 224:401–411. doi: 10.1016/j.rse.2019.02.019.
- Chan JC-W, Paelinckx D. 2008. Evaluation of Random Forest and Adaboost tree-based ensemble classification and spectral band selection for ecotope mapping using airborne hyperspectral imagery. Remote Sens Environ. 112(6):2999–3011. doi: 10.1016/j.rse.2008.02.011.
- Chen B, Jin Y. 2022. Spatial patterns and drivers for wildfire ignitions in California. Environ Res Lett. 17(5):055004. doi: 10.1088/1748-9326/ac60da.
- Chen F, Du Y, Niu S, Zhao J. 2015. Modeling forest lightning fire occurrence in the daxinganling mountains of northeastern china with MAXENT. Forests. 6(12):1422–1438. doi: 10.3390/f6051422.
- Chen J, Wang X, Yu Y, Yuan X, Quan X, Huang H. 2022. Improved prediction of forest fire risk in central and northern china by a time-decaying precipitation model. Forests. 13(3):480. doi: 10.3390/f13030480.
- Chuvieco E, Cocero D, Riaño D, Martin P, Martínez-Vega J, de la Riva J, Pérez F. 2004. Combining NDVI and surface temperature for the estimation of live fuel moisture content in forest fire danger rating. Remote Sens Environ. 92(3):322–331., doi: 10.1016/j.rse.2004.01.019.
- Cui L, Luo C, Yao C, Zou Z, Wu G, Li Q, Wang X. 2022. The influence of climate change on forest fires in Yunnan Province, Southwest China detected by GRACE satellites. Remote Sens. 14(3):712. doi: 10.3390/rs14030712.
- Elvidge CD, Baugh KE, Kihn EA, Kroehl HW, Davis ER, Davis CW. 1997. Relation between satellite observed visible-near infrared emissions, population, economic activity and electric power consumption. Int J Remote Sens. 18(6):1373–1379. doi: 10.1080/014311697218485.
- Elvidge CD, Zhizhin M, Ghosh T, Hsu F-C, Taneja J. 2021. Annual time series of global VIIRS nighttime lights derived from monthly averages: 2012 to 2019. Remote Sens. 13(5):922. doi: 10.3390/rs13050922.
- Ganteaume A, Camia A, Jappiot M, San-Miguel-Ayanz J, Long-Fournel M, Lampin C. 2013. A review of the main driving factors of forest fire ignition over Europe. Environ Manage. 51(3):651–662. doi: 10.1007/s00267-012-9961-z.
- Guo F, Su Z, Tigabu M, Yang X, Lin F, Liang H, Wang G. 2017a. Spatial modelling of fire drivers in urban-forest ecosystems in China. Forests. 8(6):180. doi: 10.3390/f8060180.
- Guo F, Su Z, Wang G, Sun L, Lin F, Liu A. 2016a. Wildfire ignition in the forests of southeast China: identifying drivers and spatial distribution to predict wildfire likelihood. Appl Geogr. 66:12–21. doi: 10.1016/j.apgeog.2015.11.014.
- Guo F, Su Z, Wang G, Sun L, Tigabu M, Yang X, Hu H. 2017b. Understanding fire drivers and relative impacts in different Chinese forest ecosystems. Sci Total Environ. 605-606:411–425. doi: 10.1016/j.scitotenv.2017.06.219.
- Guo F, Wang G, Su Z, Liang H, Wang W, Lin F, Liu A. 2016b. What drives forest fire in Fujian, China? Evidence from logistic regression and Random Forests. Int J Wildland Fire. 25(5):505–519. doi: 10.1071/WF15121.
- Hong H, Tsangaratos P, Ilia I, Liu J, Zhu A-X, Xu C. 2018. Applying genetic algorithms to set the optimal combination of forest fire related variables and model forest fire susceptibility based on data mining models. The case of Dayu County, China. Sci Total Environ. 630:1044–1056. doi: 10.1016/j.scitotenv.2018.02.278.
- Kalabokidis KD, Koutsias N, Konstantinidis P, Vasilakos C. 2007. Multivariate analysis of landscape wildfire dynamics in a Mediterranean ecosystem of Greece. Area. 39(3):392–402. doi: 10.1111/j.1475-4762.2007.00756.x.
- Kim SJ, Lim C-H, Kim GS, Lee J, Geiger T, Rahmati O, Son Y, Lee W-K. 2019. Multi-temporal analysis of forest fire probability using socio-economic and environmental variables. Remote Sens. 11(1):86. doi: 10.3390/rs11010086.
- Kolanek A, Szymanowski M, Raczyk A. 2021. Human activity affects forest fires: the impact of anthropogenic factors on the density of forest fires in Poland. Forests. 12(6):728. doi: 10.3390/f12060728.
- Lan F, Gong X, Da H, Wen H. 2020. How do population inflow and social infrastructure affect urban vitality? Evidence from 35 large-and medium-sized cities in China. Cities. 100:102454. doi: 10.1016/j.cities.2019.102454.
- Li Y, Feng Z, Chen S, Zhao Z, Wang F. 2020. Application of the artificial neural network and support vector machines in forest fire prediction in the Guangxi Autonomous Region, China. Discrete Dyn Nat Soc. 2020:1–14. doi: 10.1155/2020/5612650.
- Li Z, Bi S, Hao S, Cui Y. 2022. Aboveground biomass estimation in forests with random forest and Monte Carlo-based uncertainty analysis. Ecol Indic. 142:109246. doi: 10.1016/j.ecolind.2022.109246.
- Liu D, Sun K. 2019. Random forest solar power forecast based on classification optimization. Energy. 187:115940. doi: 10.1016/j.energy.2019.115940.
- Liu J, Xiao B, Li Y, Wang X, Bie Q, Jiao J. 2021. Simulation of dynamic urban expansion under ecological constraints using a long short term memory network model and cellular automata. Remote Sens. 13(8):1499. doi: 10.3390/rs13081499.
- Liu Q, Shan Y, Shu L, Sun P, Du S. 2018. Spatial and temporal distribution of forest fire frequency and forest area burnt in Jilin Province, Northeast China. J for Res. 29(5):1233–1239. doi: 10.1007/s11676-018-0605-x.
- Lu D, Wang Y, Yang Q, Su K, Zhang H, Li Y. 2021. Modeling spatiotemporal population changes by integrating DMSP-OLS and NPP-VIIRS nighttime light data in Chongqing, China. Remote Sens. 13(2):284. doi: 10.3390/rs13020284.
- Lv Q, Liu H, Wang J, Liu H, Shang Y. 2020. Multiscale analysis on spatiotemporal dynamics of energy consumption CO2 emissions in China: utilizing the integrated of DMSP-OLS and NPP-VIIRS nighttime light datasets. Sci Total Environ. 703:134394. doi: 10.1016/j.scitotenv.2019.134394.
- Ma W, Feng Z, Cheng Z, Chen S, Wang F. 2020. Identifying forest fire driving factors and related impacts in China using random forest algorithm. Forests. 11(5):507. doi: 10.3390/f11050507.
- Martínez J, Vega-Garcia C, Chuvieco E. 2009. Human-caused wildfire risk rating for prevention planning in Spain. J Environ Manage. 90(2):1241–1252. doi: 10.1016/j.jenvman.2008.07.005.
- Milanović S, Marković N, Pamučar D, Gigović L, Kostić P, Milanović SD. 2020. Forest fire probability mapping in eastern Serbia: logistic regression versus random forest method. Forests. 12(1):5. doi: 10.3390/f12010005.
- Mourão PR, Martinho VD. 2014. The choices of the fire—Debating socioeconomic determinants of the fires observed at Portuguese municipalities. Forest Policy Econ. 43:29–40. doi: 10.1016/j.forpol.2014.01.007.
- Naderpour M, Rizeei HM, Ramezani F. 2021. Forest fire risk prediction: a spatial deep neural network-based framework. Remote Sens. 13(13):2513. doi: 10.3390/rs13132513.
- Nechaev D, Zhizhin M, Poyda A, Ghosh T, Hsu F-C, Elvidge C. 2021. Cross-sensor nighttime lights image calibration for DMSP/OLS and SNPP/VIIRS with residual U-net. Remote Sens. 13(24):5026. doi: 10.3390/rs13245026.
- Nikhil S, Danumah JH, Saha S, Prasad MK, Rajaneesh A, Mammen PC, Ajin R, Kuriakose SL. 2021. Application of GIS and AHP method in forest fire risk zone mapping: a study of the Parambikulam tiger reserve, Kerala, India. J Geovis Spat Anal. 5(1):14. doi: 10.1007/s41651-021-00083-w.
- Pourtaghi ZS, Pourghasemi HR, Aretano R, Semeraro T. 2016. Investigation of general indicators influencing on forest fire and its susceptibility modeling using different data mining techniques. Ecol Indic. 64:72–84. doi: 10.1016/j.ecolind.2015.12.030.
- Pourtaghi ZS, Pourghasemi HR, Rossi M. 2015. Forest fire susceptibility mapping in the Minudasht forests, Golestan province, Iran. Environ Earth Sci. 73(4):1515–1533. doi: 10.1007/s12665-014-3502-4.
- Probst P, Boulesteix A-L. 2017. To tune or not to tune the number of trees in random forest. J Mach Learn Res. 18:6673–6690. doi: 10.48550/arXiv.1705.05654.
- Puri K, Areendran G, Raj K, Mazumdar S, Joshi P. 2011. Forest fire risk assessment in parts of Northeast India using geospatial tools. J For Res. 22(4):641–647. doi: 10.1007/s11676-011-0206-4.
- Rihan, W., Zhao, J., Zhang, H., Guo, X., Ying, H., Deng, G., Li, H., 2019. Wildfires on the Mongolian Plateau: identifying drivers and spatial distributions to predict wildfire probability. Remote Sens, 20. 11, 2361. doi: 10.3390/rs11202361.
- Sannigrahi S, Pilla F, Basu B, Basu AS, Sarkar K, Chakraborti S, Joshi PK, Zhang Q, Wang Y, Bhatt S, et al. 2020. Examining the effects of forest fire on terrestrial carbon emission and ecosystem production in India using Remote Sens approaches. Sci Total Environ. 725:138331. doi: 10.1016/j.scitotenv.2020.138331.
- Su Z, Hu H, Wang G, Ma Y, Yang X, Guo F. 2018. Using GIS and Random Forests to identify fire drivers in a forest city, Yichun, China. Geomat Nat Haz Risk. 9(1):1207–1229. doi: 10.1080/19475705.2018.1505667.
- Su Z, Tigabu M, Cao Q, Wang G, Hu H, Guo F. 2019. Comparative analysis of spatial variation in forest fire drivers between boreal and subtropical ecosystems in China. For Ecol Manage. 454:117669. doi: 10.1016/j.foreco.2019.117669.
- Tan M, Li X, Li S, Xin L, Wang X, Li Q, Li W, Li Y, Xiang W. 2018. Modeling population density based on nighttime light images and land use data in China. Appl Geogr. 90:239–247. doi: 10.1016/j.apgeog.2017.12.012.
- Vadrevu KP, Badarinath K. 2009. Spatial pattern analysis of fire events in Central India–A case study. Geocarto Int. 24(2):115–131. doi: 10.1080/10106040802230837.
- Vallejo-Villalta I, Rodríguez-Navas E, Márquez-Pérez J. 2019. Mapping forest fire risk at a local scale—a case study in Andalusia (Spain). Environments. 6(3):30. doi: 10.3390/environments6030030.
- Vigna I, Besana A, Comino E, Pezzoli A. 2021. Application of the socio-ecological system framework to forest fire risk management: a systematic literature review. Sustainability. 13(4):2121. doi: 10.3390/su13042121.
- Wang L, Qu JJ. 2007. NMDI: a normalized multi‐band drought index for monitoring soil and vegetation moisture with satellite Remote Sens. Geophys Res Lett. 34: L20405. doi: 10.1029/2007gl031021.
- Woo H, Chung W, Graham JM, Lee B. 2017. Forest fire risk assessment using point process modelling of fire occurrence and Monte Carlo fire simulation. Int J Wildland Fire. 26(9):789–805. doi: 10.1071/WF17021.
- Wu Z, He HS, Yang J, Liu Z, Liang Y. 2014. Relative effects of climatic and local factors on fire occurrence in boreal forest landscapes of northeastern China. Sci Total Environ. 493:472–480. doi: 10.1016/j.scitotenv.2014.06.011.
- Wu Z, Li M, Wang B, Quan Y, Liu J. 2021. Using artificial intelligence to estimate the probability of forest fires in Heilongjiang, northeast China. Remote Sens. 13(9):1813. doi: 10.3390/rs13091813.
- Xiong Q, Luo X, Liang P, Xiao Y, Xiao Q, Sun H, Pan K, Wang L, Li L, Pang X. 2020. Fire from policy, human interventions, or biophysical factors? Temporal–spatial patterns of forest fire in southwestern China. For Ecol Manage. 474:118381. doi: 10.1016/j.foreco.2020.118381.
- Yang D, Luan W, Qiao L, Pratama M. 2020. Modeling and spatio-temporal analysis of city-level carbon emissions based on nighttime light satellite imagery. Appl Energy. 268:114696. doi: 10.1016/j.apenergy.2020.114696.
- You W, Lin L, Wu L, Ji Z, Yu J, Zhu J, Fan Y, He D., 2017. Geographical information system-based forest fire risk assessment integrating national forest inventory data and analysis of its spatiotemporal variability. Ecol Indic. 77:176–184. doi: 10.1016/j.ecolind.2017.01.042.
- Zeng A, Yang S, Zhu H, Tigabu M, Su Z, Wang G, Guo F. 2022. Spatiotemporal Dynamics and Climate Influence of Forest Fires in Fujian Province, China. Forests. 13(3):423. doi: 10.3390/f13030423.
- Zhang X, Lan M, Ming J, Zhu J, Lo S. 2023. Spatiotemporal Heterogeneity of Forest Fire Occurrence Based on Remote Sensing Data: an Analysis in Anhui, China. Remote Sens. 15(3):598. doi: 10.3390/rs15030598.
- Zheng Z, Gao Y, Yang Q, Zou B, Xu Y, Chen Y, Yang S, Wang Y, Wang Z. 2020. Predicting forest fire risk based on mining rules with ant-miner algorithm in cloud-rich areas. Ecol Indic. 118:106772. doi: 10.1016/j.ecolind.2020.106772.
- Zhong Y, Lin A, He L, Zhou Z, Yuan M. 2020. Spatiotemporal dynamics and driving forces of urban land-use expansion: a case study of the Yangtze River economic belt, China. Remote Sens. 12(2):287. doi: 10.3390/rs12020287.