
 ?Mathematical formulae have been encoded as MathML and are displayed in this HTML version using MathJax in order to improve their display. Uncheck the box to turn MathJax off. This feature requires Javascript. Click on a formula to zoom.
Abstract
As one of the worst ecological disasters in the world’s oceans, red tide seriously threatens marine ecology. Red tide monitoring is essential for preserving the ocean ecosystem. However, traditional photogrammetric processing workflows, e.g. SfM (Structure from Motion) and MVS (Multi-view Stereo) based image orientation and dense matching, do not apply to offshore images due to the low texture of ocean color. The primary contribution of this study is a UAV (Unmanned Aerial Vehicle)-based photogrammetric solution for red tide monitoring and direct geo-localization. First, a direct geo-localization model has been created, which solely uses onboard sensor data for the 3D coordinate calculation of 2D image targets based on the collinear equation. Second, two UAVs are chosen as photogrammetric systems that can supply the necessary data for the direct geo-localization model, including high-resolution images, camera intrinsic and extrinsic parameters. Third, a human annotation technique has been utilized to identify red tide regions whose ground polygons can be further estimated using the direct geo-localization model, taking into account how difficult it is to detect red tides automatically. Finally, the accuracy of direct geo-localization and the viability of the proposed solution has been evaluated and verified using real UAV datasets. The experimental results show that the direct geo-localization precision is better than 20 m when only onboard sensor data is used. The suggested workflow is appropriate for monitoring red tides, which can provide critical information for managing marine ecosystems. The executable toolkit would be made publicly available at https://github.com/json87/PhotoDigitizer.
1. Introduction
Red tide, also referred to as algal blooms, is one of the major ecological disasters in the world’s oceans and are brought on by the frenzied growth of bacteria, protozoa, or phytoplankton. It poses a serious threat to the world’s marine ecology (Maze et al. Citation2015). As a result, it is critical to regularly monitor red tide in order to assess, forecast, and maintain the security of the marine ecosystem and its ability to support economic activity.
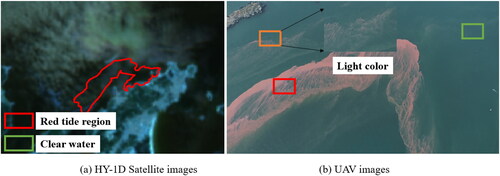
As seen in , the alteration in ocean color is primarily to blame for the occurrence of red tide. It offers optical image-based remote sensing (RS) red tide monitoring. Due to the rapid advancement of onboard sensors, such as the Chinese GaoFen-1 Wide Field of View (GF-1 WFV) and the HaiYang 1D Coastal Zone Imagery (HY-1D CZI), and the capability of high-orbit satellite platforms for large-scale observation, satellite optical images have been used extensively in the literature for red tide monitoring (Liu et al. Citation2022). The main concept is to create a mapping model that links the spectrum reflectance of RS photos to the presence of red tide. Sakuno et al. (Citation2019) created a red tide detection model using the Sentinel-2 MSI (Multispectral Instrument) images by merging the data of bands 4 and 5. They then validated the model for red tide monitoring over a period of five months. Shin et al. (Citation2021) adopted the PlanetScope images with a spatial resolution of 3 m for red tide monitoring in consideration of the constrained spatial resolutions of low and medium RS sensors. An U-Net based deep learning model was trained and used in research to forecast the location of red tides, and the findings are encouraging when compared to traditional hand-crafted techniques. Similarly, in order to overcome the problem of adapting deep learning models for red tide detection from low spatial resolution to medium spatial resolution images, Zhao et al. (Citation2021) created the RDU-Net CNN (Convolutional Neural Network) model based on the U-Net architecture. HY-1D CZI images were used to train and validate the model. However, satellite platforms and used images have some limitations. The fixed orbits of satellites limit their capacity to respond quickly enough to acquire data effectively. At the same time, their highly high height reduces the spatial resolution of RS images. For the purpose of monitoring red tides, it is therefore necessary to increase data acquisition efficiency and image resolution.
Figure 1. RS images captured from the HY-1D satellite and UAV platforms.
Over the past decade, Unmanned Aerial Vehicles (UAVs) have undergone significant advancements in photogrammetry and remote sensing, primarily due to their cost-effectiveness and versatile data acquisition capabilities. The use of these applications with UAVs facilitates the construction of 3D models. It enables comprehensive observation and analysis of various types of ranging from forest resource evaluation (Lin et al. Citation2015; Ecke et al. Citation2022) to the geological disasters that occur worldwide, such as debris flow, rockfall, flooding, earthquakes, coseismic ruptures, and landslides (Francioni et al. Citation2020; Cirillo et al. Citation2024), and transmission line inspection (Jiang et al. Citation2017). UAV imagery has emerged as one of the most valuable sources of remote sensing (RS) data, particularly notable for its application in red tide monitoring (Shin et al. Citation2021). The availability of UAVs equipped with consumer-grade cameras has revolutionized data acquisition in photogrammetry and remote sensing, offering cost-effective solutions for diverse applications. Through the comprehensive utilization of various photographic lenses, along with oblique photography techniques capturing images from multiple angles, high-resolution imagery can be rapidly acquired and precisely geolocated using RTK and PPK photogrammetric surveys in certain cases (Štroner et al. Citation2021; Cirillo et al. Citation2022). These methodologies enable the generation of 3D point clouds with exceptional accuracy, as well as orthophoto maps and digital terrain models (James and Robson Citation2012), effectively minimizing systematic errors in topographic models (James and Robson Citation2014). Cheng et al. (Citation2020) suggested a UAV-based solution to monitor coastal algal blooms to avoid the impact of weather conditions on satellite images. High-resolution UAV images were spatially registered to create an overview of test sites, and the radiometric correction was carried out to generate preferred pixel values for algal bloom regression. High spatial resolution UAV images were employed in Jiang et al. (Citation2020b) to identify green tide, and a green-tide index, known as RGB-FAI (red-green-blue floating algae index) was created by exploiting the red and blue bands of RGB images. Kim et al. (Citation2020a) evaluated the potential of UAV platforms and multispectral sensors to map red tide intensity, in which a 5-band camera was utilized to take images, and the RBR (red-to-blue band ratio) algorithm was used to calculate the intensity values. To address the problem of band registration of multispectral images, Kim et al. (Citation2020b) used multispectral sensors in water monitoring, in which images were captured using a UAV fitted with a multispectral camera, and the correspondences between image bands were determined using the radiometric distribution of pixels. To overcome the limitations of satellite-based systems, UAVs show tremendous possibilities for effective data collecting and quick emergency reactions in red tide monitoring.
Although UAV platforms feature flexible data acquisitions and high spatial resolutions, there are several clear drawbacks when it comes to extensive red tide monitoring. On the one hand, the energy sources used, such as lithium batteries, limit the endurance of UAV platforms, which are usually less than 30 min for the majority of market-available rotor-wing UAVs. For the collection of outdoor data, many flying campaigns may be necessary; on the other hand, the configured dynamical system typically restricts the flight height of UAV platforms, which is close to 100 m for commonly used rotor-wing UAVs (Colomina and Molina Citation2014). When compared to satellite images, collected images have a limited amount of ground coverage. In the absence of these two elements, the gathered UAV images cannot pinpoint the location of red tide since they are not geo-referenced (Helgesen et al. Citation2019). For extensive red tide monitoring, image registration and geo-localization are therefore necessary.
SfM (Structure from Motion) (Jiang et al. Citation2020a) and MVS (Multi-view Stereo) (Dall¡¯Asta et al. Citation2017) are the commonly used techniques in the fields of photogrammetry and computer vision to resume camera poses and generate dense point clouds, which are then used to achieve image registration and geo-localization of UAV images. To successfully align photos and perform dense matching, it is necessary to establish enough and precise correspondences between overlapping images. However, because most of UAV images used for red tide monitoring are obscured by low-texture ocean water, as seen in , it becomes difficult to monitor red tides. In other words, red tide monitoring cannot use the traditional workflow for UAV images. Fortunately, POS (Positioning and Orientation system), which can be used to implement camera extrinsic orientation, is integrated with the majority of market-available UAV platforms. Additionally, pre-calibrated parameters can be used to establish camera intrinsic orientation. As a result, this study proposes a workflow for monitoring and geo-localizing red tides using UAV-based photogrammetry. In conclusion, the main contributions of this study are as follows: (1) we design a workflow to achieve the image orientation of UAV images and the geometric calculation of red tide regions by using onboard POS data and camera parameters. It does not rely on the SfM-MVS based workflow and avoids the low-texture drawback of recorded images; (2) we analyze the accuracy of the direct geo-referencing solution by using widely used UAV platforms, and evaluate the geo-referencing accuracy for the direct geo-localization of the proposed solution; and (3) we put the proposed solution to red tide monitoring and geo-localization in practice, and verify its validation and response ability for red tide monitoring. The establish workflow for monitoring red tides is shown in .
Figure 2. The workflow for red tide monitoring and geo-localization.
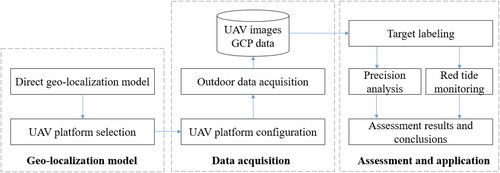
This paper presents a UAV-based photogrammetric solution for red tide monitoring. This paper is organized as follows. Section 2 gives the details of the proposed solution in terms of the direct geo-localization model design, the selection of UAV platforms, and the calculation of red tide geometry. By using real UAV datasets, the precision of the direct geo-localization model and the applicability of the solution are evaluated and verified in Section 3, which is followed by the discussion in Section 4. Finally, Section 5 presents the conclusions of this study and further studies in the future.
2. Methodologies
This paper proposes a workflow for red tide monitoring and direct geo-localization based on onboard POS data and camera parameters. To achieve this goal, three major issues should be carefully addressed, i.e. the direct geo-localization model, UAV photogrammetric system, and geometric calculation of red tide. The details of each case are presented as follows.
2.1. Direct geo-localization model
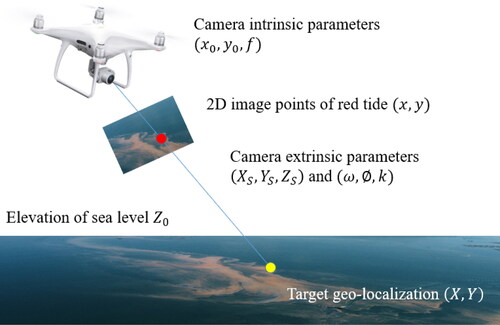
The direct geo-localization model is based on the principle of the collinear equation in the field of photogrammetry, which describes the projection relationship from 3D scene points to 2D image points through camera projection centers (Mikhail et al. Citation2001). The principle of the direct geo-localization model is illustrated in , and the formula of the direct geo-localization model is presented in EquationEquation (1)(1)
(1)
(1)
(1)
where, (x, y) is the 2D image point of the target;
are camera intrinsic parameters, i.e. the principle point
and the focal length f;
are the elements of the rotation matrix that is calculated from camera orientation parameters, i.e. omega, phi, and kappa
is the camera position parameters; Z0 is the elevation of the plane that the target locates at; and (x, y) is the calculated 3D scene point of the target.
and
consist of camera extrinsic parameters. According to the direct geo-localization model, three items should be given, including 2D image points of red tide, the camera intrinsic parameters and extrinsic parameters, and the elevation of the sea level. The elevation of the sea level Z0 can be obtained from hydrological stations or calculated by in-field surveying.
Figure 3. The principle of the direct geo-localization model.
2.2. UAV photogrammetric system
2.2.1. UAV platform selection
Considering the required data for direct geo-localization, the DJI Phantom 4 RTK (Real-Time Kinematic) and the DJI M300 UAVs have been selected as the photogrammetric system for data acquisition. For photogrammetry, the used camera is critical to the final productions. In this study, the default cameras configured with the UAVs have been used due to two main reasons. On the one hand, it enables the application of the proposed solution; on the other hand, the configured cameras can provide all necessary data.
For the DJI Phantom 4 RTK UAV, the maximum flight speed and wind speed resistance are 14.0 m/s and 10.0 m/s for the UAV aircraft, which is essential for offshore data acquisition campaigns. Due to the usage of batteries, the flight duration is approximately 30 min for one flight. The Phantom 4 RTK UAV is equipped with one FC6310R camera with a resolution of 5472 by 3648 pixels and a high-precision positioning sensor that supports multiple GNSS (Global Navigation Satellite System) systems. The nominal positioning accuracy with the RTK-enabled mode is 1.0 and 1.5 cm in the horizontal and vertical directions, respectively. The DJI M300 RTK has the same GNSS configuration and positioning accuracy, while the other items differ. A Zenmuse P1 camera with a resolution of 8192 by 5460 pixels has been used for image recording. These configurations enable the collection of high-resolution images with necessary POS data.
2.2.2. Calculation of camera intrinsic parameters
According to the direct geo-localization model, the camera intrinsic parameters are mandatorily required to determine the position and orientation of imaging rays relative to the camera coordinate system (c-system), which are recorded in the EXIF (Exchangeable Image File Format) data of UAV images. For the used DJI UAVs, camera intrinsic parameters are provided under laboratory pre-calibration, along with the well-known Brown distortion coefficients. In addition, there are two types of working modes, i.e. dewarp mode and non-dewarp mode. The former uses pre-calibration parameters to undistort images; the latter stores original images along with distortion coefficients. In this study, we use the Brown camera model (Fryer and Brown Citation1986), as shown in EquationEquation (2)
(2)
(2) , with the corresponding parameters for the intrinsic orientation of imaging rays
(2)
(2)
where, (x, y) is coordinate in the distorted image;
is the offset from (x, y) to
is the correction value of (x, y);
and
are respectively the radial and tangent distortion parameters. For the non-dewarp mode, the distortion parameters are obtained from EXIF data; for the dewarp mode, their values are set as zero since images have been undistorted.
2.2.3. Calculation of camera extrinsic parameters
For geo-localization, extrinsic parameters are required to determine the position and orientation of imaging rays relative to the surveying coordinate system (E-system). For the used UAV, onboard POS system records camera positions
in the WGS-84 coordinate system and orientation angles
in the navigation system (n-system). Thus, the original data cannot be directly used for geometric calculation.
In the field of photogrammetry, orientation angles are defined in the E-system, which differ from the recorded orientation angles
in the n-system (Zhao et al. Citation2013). By using the Earth Centered Earth Fixed coordinate system (e-system), orientation angles
can be converted to the E-system as represented by EquationEquation (3)
(3)
(3)
(3)
(3)
where
is the rotation matrix from the n-system to the IMU body system (b-system) using the recorded angles
is the rotation matrix from the e-system to the n-system, which is determined by the recorded latitude and longitude
is the rotation matrix from E-system to the e-system, which is determined by the origin
of the E-system. is the rotation matrix from the c-system to the E-system, which defines the orientation angles
of cameras in the E-system. For the details of the above-mentioned transformations, the readers can refer to Jiang and Jiang (Citation2017). Finally,
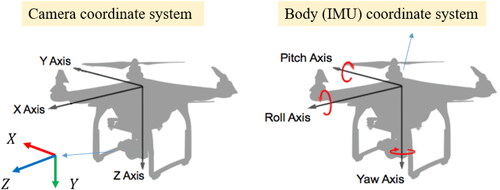
is the rotation matrix from the b-system to the c-system. For the used DJI UAVs, their relationship is shown in and can be calculated by using EquationEquation (4)
(4)
(4)
(4)
(4)
Figure 4. The camera and body coordinate systems of the DJI Phantom 4 RTK UAV.
Besides, camera positions in the WGS-84 coordinate system are also converted to the E-system with the origin
The transformation is expressed by EquationEquation (5)
(5)
(5)
(5)
(5)
where,
is the transformation from the WGS-84 coordinate system to the e-system;
is the converted position in the e-system. In this study, the origin
of the E-system is defined by using the recorded latitude and longitude
of each image as images are processed individually. After the conversion of camera positions
and orientation angles
camera extrinsic parameters
can be obtained and utilized for the direct geo-localization of 2D image points.
2.3. Geometric calculation for red tide
After obtaining the elevation of sea level Z0 and camera intrinsic parameters and camera extrinsic parameters
the geographic coordinates of red tide can be calculated using the direct geo-localization model. In practice, except for the high-resolution RGB images, the geo-location and overlap region of red tide are interesting to the users, which provide the basic geographic data for red tide monitoring. To calculate this information, red tide regions must be completely and accurately extracted from the RGB images. Although sea color changes obviously, there are large proportions of regions with light and mixed color, as illustrated in . It becomes difficult to detect these regions using automatic methods, e.g. the U-Net model (Ronneberger et al. Citation2015).
Figure 5. The comparison of the automatic and manual labels of red tide.
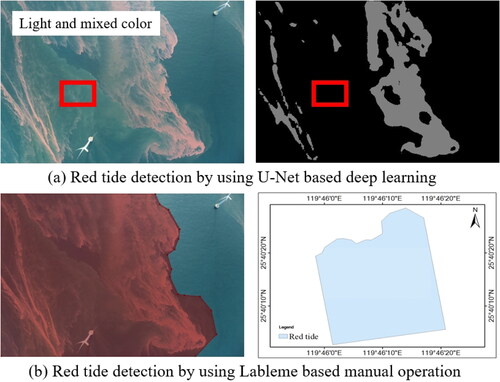
In contrast, to using the automatic methods, this study tends to the manual operation for red tide detection since it can be a more practical solution to solve the issue. In this study, the well-known labeling tool, termed Labelme (Labelme Citation2022), is selected for the manual annotation of red tide regions, as shown in . Labelme allows users to draw the regions of red tide using polygons and store the endpoints in the JSON (JavaScript Object Notation) file format. After annotating the regions of red tide, the geographic coordinates of endpoints are calculated based on the direct geo-localization model, which is converted into the Shapefile format and can be rendered and analyzed in the GIS (Geographic Information System) software package ArcMap (ArcGIS Citation2022) for further application, e.g. area calculation and overlap analysis.
2.4. Implementation of the proposed solution
Based on the above-mentioned techniques, this study implements the overall solution for red tide monitoring, as shown in . The proposed solution is achieved by using the C++ programming language. The details are described as follows:
Figure 6. The implementation of the proposed solution for red tide monitoring.
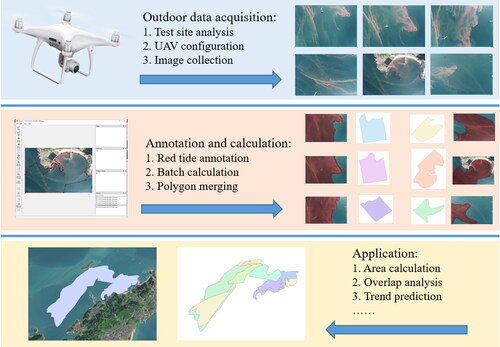
For outdoor data acquisition, the materials of test sites are first analyzed, such as the wind speed and temperature of offshore and the rough location of red tide. These data facilitate the settings for acquisition campaigns. By setting proper flight trajectories, UAV images can be collected under automatic or manual operations.
For indoor data processing, images that cover the region of red tide are annotated by using the Labelme software package, and the coverage polygons with geo-reference information are generated in a batch manner. For the used DJI Phantom 4 RTK UAV, the required camera intrinsic and extrinsic parameters are stored in the EXIF data of images. The used tag labels are presented in Appendix A.
To obtain the overall ground overlap, the individually generated polygons are further merged by using the ArcMap GIS software packages. The generated polygons could be utilized for further GIS analysis, e.g. area calculation of red tide regions, overlap analysis with other data for visualization, and trend prediction.
3. Experiments and results
The experiments are conducted from the aspects of precision analysis and application of the proposed solution for red tide monitoring. In the precision analysis for direct geo-localization, one test site on the shore has been selected, and the digital orthographic map (DOM) and digital surface map (DSM) have been generated with the aid of ground control points, which provide ground-truth data for precision comparison. In the application for red tide monitoring, two UAV acquisition campaigns have been executed to collect high-resolution images, and the proposed solution has been used for the geometric calculation of red tide. The details of the tests are presented in the following sections.
3.1. Precision analysis for direct geo-localization
3.1.1. Test sites and datasets
This study has chosen one test site on the shore for precision analysis. The test site locates in Minqing County, Fujian province, which is close to the Minjiang River. The majority of the test site is covered by bare ground, and in the central region, there exists a country that consists of some low-height village houses.
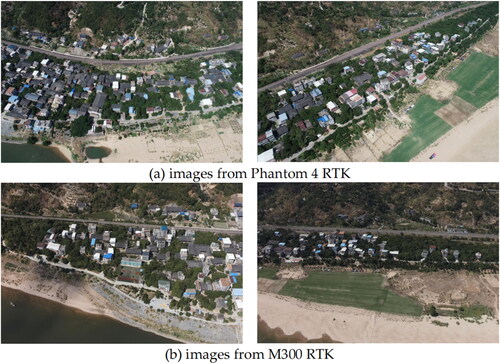
For data acquisition, two UAV platforms have been used, i.e. the DJI Phantom 4 RTK and DJI M300 RTK. The former is equipped with the DJI FC6310R camera with dimensions of 5472 by 3648 pixels; the latter carries the DJI Zenmuse P1 camera with dimensions of 8192 by 5460 pixels. For comparison, these two acquisition campaigns are conducted by using the same flight height, which is 300 meters relative to the ground. It is determined by UAV platforms and flying environments, such as wind speed and carrying capacity. The collected images are presented in , which are further processed by using the classical photogrammetric software package, termed Agisoft Metashape (Agisoft Citation2022), to generate the DOM and DSM.
Figure 7. The illustration of collected UAV images by using the selected UAV platforms.
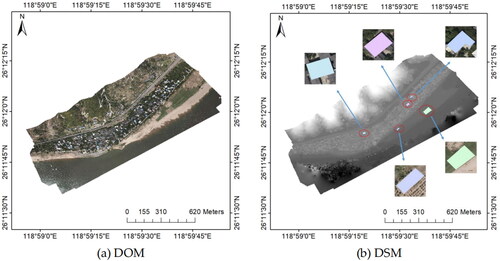
For the precision of the direct geo-localization model, five ground targets are selected and annotated from the DOM data presented in , including two targets on the ground and three targets on house roofs. The coordinates of these ground targets are manually measured from the geo-referenced DOM image. The targets are located on varying elevation planes, whose values are obtained from the DSM image shown in .
Figure 8. The DOM and DSM for precision analysis.
3.1.2. Results and analysis
Based on the proposed direct geo-localization model, the footprints of the selected targets are calculated and presented in . The images in the first row indicate the annotation of selected targets on the photos, and the images in the second and third rows show the calculated footprints of these targets by using data from the DJI Phantom 4 RTK and M300 RTK UAVs. It is clearly shown that an obvious offset exists between the calculated footprints and selected targets due to the errors from camera intrinsic and extrinsic parameters. However, using the direct geo-localization model, we can still obtain the footprints of the selected targets that are close to the ground-truth locations, as presented in .
Figure 9. Polygon annotation and geometry calculation from UAV images.
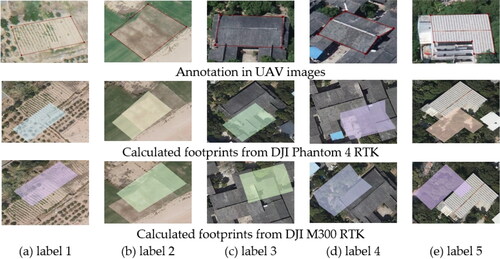
To present a quantitative evaluation for direct geo-localization, this study has conducted the statistic of geometry calculation for these two UAV platforms, including offsets between vertex coordinates and differences between footprint areas. The results are presented in and , in which shows the statistic of geometry calculation for the DJI Phantom 4 RTK UAV, and shows the statistic of geometry calculation for the DJI M300 RTK UAV. We can conclude: (1) based on the proposed direct geo-localization model, the offset between vertex coordinates is approximately 20 m in the XY plane for these two UAV platforms; (2) the differences between footprint areas are less than 9.2% and 7.7% for the DJI Phantom 4 RTK and M300 RTK UAVs; (3) the area difference for the targets locating on house roofs is smaller than that of targets locating on the ground since targets on the house roofs have more consistent altitude, which is also applied to red tide monitoring on the sea. In a word, the used UAV platforms, i.e. DJI Phantom 4 RTK and M300 RTK UAVs, can achieve an accuracy of about 20 m for direct geo-localization and the residual better than 9.2% for area estimation in red tide monitoring based on the direct geo-referencing model.
Table 1. The statistic of geometry calculation for the DJI Phantom 4 RTK UAV images. The coordinate and area differences are respectively in the unit of meters and square meters; the percentage is the ratio of area difference to the ground-truth area.
Table 2. The statistic of geometry calculation for the DJI M300 RTK UAV images. The coordinate and area differences are respectively in the unit of meters (m) and square meters (m2); the percentage is the ratio of area difference to the ground-truth area.
3.2. Application for red tide monitoring
3.2.1. Test sites and datasets
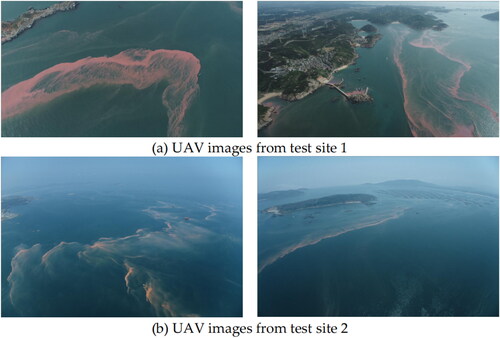
By using the proposed solution, this study has conducted two practical tasks for red tide monitoring over the sea near Fujian province, as shown in . In April 2022, there was some red tide occurring near the Pingtan sea region in Fujian province, and we conducted two acquisition campaigns to collect UAV images. The first one occurred on April 22, 2022, near the Fengtian village, in which red tide is featured with bronzing color and located from the direction of the northeast to southwest. As shown in , the boundary between red tide and seawater is evident, which can facilitate manual annotation. The second one occurred on April 13, 2022, near Changjiang Ao, which locates from the direction of north to south. In contrast to the first one, red tide in this test site has a low density and light color, as presented in , which causes difficulties in separating them from seawater. For data acquisition, the DJI Phantom 4 RTK UAV has been utilized in these two test sites. The imaging angle of onboard cameras is set as negative 20 degrees to obtain large ground coverage.
Figure 10. The location of these two test sites.
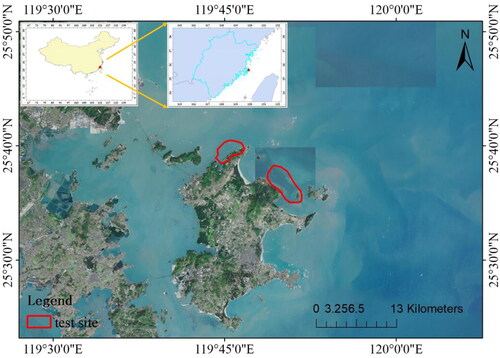
Figure 11. The illustration of collected UAV images for red tide monitoring.
3.2.2. Results and analysis
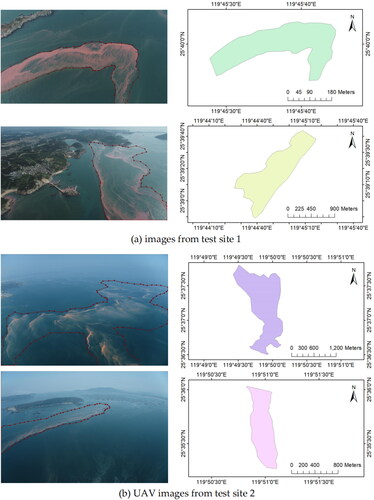
In the first step of the proposed solution, red tide regions are annotated using the Labelme software package. Due to the redundancy of captured images, a subset of images are extracted from original UAV images, which are annotated for red tide regions, as shown in . For test site 1, the boundary of red tide is obvious, and the regions can be easily annotated, as presented in . For test site 2, the boundary of red tide is not obviously clear since the light color causes mixing with seawater. However, due to the high resolution of collected UAV images, red tide regions can still be successfully annotated, as shown in . In this step, there are 15 images selected from the original datasets, and the time costs for the annotation of red tide regions are approximately 30 min for these two datasets. The generated individual ground-coverage polygons are shown on the right side in . We can see that the shape of these polygons is consistent with the annotation in the corresponding images.
Figure 12. The annotation and geometric calculation of UAV images.
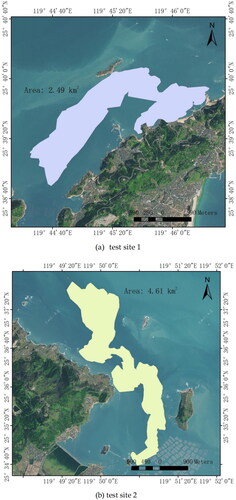
After the geometric calculation of all annotated images, the ground-coverage polygons are then merged to generate the overall region of red sides. Considering that the precision of direct geo-localization is about 20 m for the proposed solution, a buffer operation is executed for the merged polygon to ensure enough coverage of red tide. The results are presented in . From the generated map, we can clearly see that: (1) for test site 1, the area of red tide regions intruded by the red tide is about 2.49 square kilometers, whose spatial spans in the north-south and west-east directions are 3.69 kilometers and 2.44 kilometers, respectively; (2) for test site 2, the area of red tide regions is near 4.61 square kilometers, which locates along the north-south direction with the spatial span of 5.86 kilometers. Noticeably, the sea farms in the right-bottom region have been polluted by red tide. In a word, the proposed UAV-based photogrammetric solution and the designed software packages can be a suitable way for the regular monitoring of red tide and provide useful data for the management of marine ecosystems.
Figure 13. The generated map for red monitoring of the two test sites.
4. Discussion
4.1. UAV platform and direct geo-localization precision
The proposed solution depends on the camera intrinsic and extrinsic parameters to build the direct geo-localization model and calculate the geometry of annotated red tide regions. The camera intrinsic parameters mainly consist of the focal length and principal point; the camera extrinsic parameters include the positioning and orientation data of captured images. For the used DJI Phantom 4 RTK and DJI M300 RTK, onboard cameras have been well calibrated in the laboratory, which can be directly read from the EXIF data from images. Besides, almost market-available UAVs are equipped with POS sensors for automatic navigation. In this study, the used UAVs can achieve high-precision positioning due to the usage of RTK. As presented in Section 3.1, the precision of the direct geo-localization model is about 20 m in the horizontal direction, mainly because of the low orientation accuracy of onboard IMU (Inertial Measurement Unit) instruments. For red tide monitoring, the precision is acceptable due to two main reasons. On the one hand, the red tide region changes rapidly due to varying ocean environments; on the other hand, the red tide region is usually determined via human checking, whose error is generally large. Thus, the geo-localization error of 20 m is accepted for red tide monitoring considering these complex factors.
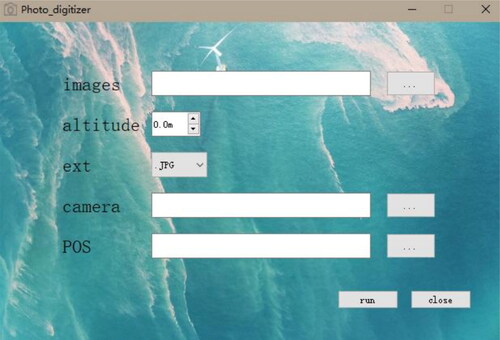
To improve the precision of geometric calculation, two solutions can be used from the aspects of sensor integration and data processing. On the one hand, high-precision and lightweight IMU can be used in UAV photogrammetric systems. This solution requires high economic costs and the redesign of UAV platforms; on the other hand, bundle adjustment can be executed to resume accurate orientation angles instead of the usage of low-precision data from onboard IMU instruments (Jiang et al. Citation2022). This solution requires that enough correspondences can be matched, which is difficult for offshore UAV images. Considering the first solution, this study has developed a software package for geometric calculation, which support parsing parameters from EXIF data or reading from external files ().
Figure 14. The software package developed for geometric calculation in this study.
4.2. Manual annotation and automatic detection of red tide region
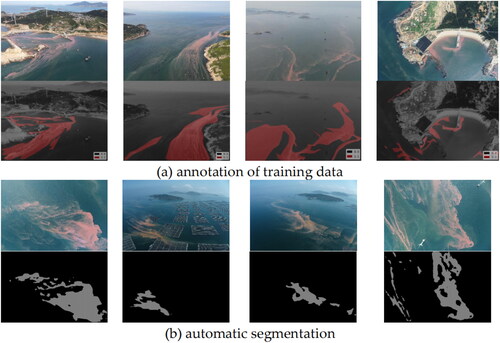
In the workflow of the proposed solution, red tide regions are manually annotated in the used Labelme software package 1 https://github.com/labelmeai/labelme. Although red tide causes the color change of sea waters, the density of colors and the mixing with waters make it difficult for the automatic detection of red tide regions. To assess the ability of automatic detection, this study has also used deep learning techniques for red tide detection because of the successful usage of CNN models. First, training images captured from different locations and with varying conditions samples are collected, which are used to create training samples using annotation in Labelme, as presented in . Second, the well-known CNN model, termed U-Net (Ronneberger et al. Citation2015), is trained from scratch using the labeled training images. Finally, the trained model is applied to some other images, and the segmentation results are shown in . We can see that red tide with noticeable color changes, e.g. the first and fourth columns, can be well segmented from seawater. However, other red tides with light color would be ignored in the segmentation, e.g. the results shown in the second and third columns. Thus, this study uses manual annotation to detect red tide.
Figure 15. The annotation of training data and automatic segmentation.
4.3. Calculation complexity and its replicability for related applications
The proposed solution only uses UAV images and onboard POS data for the geo-localization of red tides. In contrast to the typical SfM-MVS based methods, the calculation complexity is negligible since it only involves the intersection of 3D points based on the colinear equation. Within the proposed solution, the only time-consuming step is the annotation of red tide regions from UAV images, as described in Section 4.2. In practice, this issue can be resolved from two aspects. On the one hand, oblique photogrammetry can be used as it can cover a larger region in one image; on the other hand, the UAV trajectory can be elegantly designed to record as less images as possible to cover the whole red tide region. Thus, the proposed solution can easily scale to large regions and perform red tide monitoring efficiently.
Apart from red tide monitoring, the proposed solution can also be extended to other applications. The core idea of the proposed solution is to use onboard sensor data for direct geo-localization. In practice, many other situations require direct geo-localization ability, such as landslide monitoring in geology. These applications need the automatic detection and efficient geo-localization of interesting targets. In general, these requirements are identical to the purpose of red tide monitoring. In a word, the proposed solution can also extend to other related applications for direct geo-localization.
5. Conclusion
This study proposes an overall workflow for red tide monitoring from the aspects of direct geo-localization model design, UAV platform selection, and geometric calculation. Because the classical photogrammetric processing solution is not appropriate for offshore UAV images, the direct geo-localization model depends sorely on onboard data for the geometric calculation, i.e. pre-calibrated camera intrinsic parameters and converted camera extrinsic parameters. To assess the precision of the direct geo-localization model, two commonly used UAV platforms have been evaluated, including the DJI Phantom 4 RTK and M300 RTK UAVs, by using images from one ground test site. The results demonstrate that the precision is approximately 20 m. Two practical tasks based on the defined workflow have already been completed, demonstrating that the proposed UAV-based photogrammetric workflow is appropriate for red tide monitoring and can deliver valuable data for marine ecosystem management. However, the proposed solution still uses manual annotation for red tide regions. In order to improve the efficiency of the proposed solution, more research would concentrate on the automatic detection of red tide regions.
Disclosure statement
No potential conflict of interest was reported by the author(s).
Additional information
Funding
References
- Agisoft. 2022. Agisoft metashape homepage; [accessed: 2022 Dec 4]. http://www.agisoft.com.
- ArcGIS. 2022. Arcgis desktop homepage; [accessed: 2022 Dec 4]. https://desktop.arcgis.com/zh-cn/desktop/.
- Cheng K, Chan SN, Lee JH. 2020. Remote sensing of coastal algal blooms using unmanned aerial vehicles (UAVS). Mar Pollut Bull. 152:110889. doi:10.1016/j.marpolbul.2020.110889.
- Cirillo D, Cerritelli F, Agostini S, Bello S, Lavecchia G, Brozzetti F. 2022. Integrating post-processing kinematic (PPK)–structure-from-motion (SFM) with unmanned aerial vehicle (UAV) photogrammetry and digital field mapping for structural geological analysis. IJGI. 11(8):437. doi:10.3390/ijgi11080437.
- Cirillo D, Zappa M, Tangari AC, Brozzetti F, Ietto F. 2024. Rockfall analysis from UAV-based photogrammetry and 3D models of a cliff area. Drones. 8(1):31. doi:10.3390/drones8010031.
- Colomina I, Molina P. 2014. Unmanned aerial systems for photogrammetry and remote sensing: a review. ISPRS J Photogramm Remote Sens. 92:79–97. doi:10.1016/j.isprsjprs.2014.02.013.
- Dall¡¯Asta E, Forlani G, Roncella R, Santise M, Diotri F, di Cella UM. 2017. Unmanned aerial systems and DSM matching for rock glacier monitoring. ISPRS J Photogramm Remote Sens. 127:102–114. doi:10.1016/j.isprsjprs.2016.10.003.
- Ecke S, Dempewolf J, Frey J, Schwaller A, Endres E, Klemmt HJ, Tiede D, Seifert T. 2022. UAV-based forest health monitoring: a systematic review. Remote Sens. 14(13):3205. doi:10.3390/rs14133205.
- Francioni M, Antonaci F, Sciarra N, Robiati C, Coggan J, Stead D, Calamita F. 2020. Application of unmanned aerial vehicle data and discrete fracture network models for improved rockfall simulations. Remote Sens. 12(12):2053. doi:10.3390/rs12122053.
- Fryer JG, Brown DC. 1986. Lens distortion for close-range photogrammetry. Photogramm Eng Remote Sens. 52:51–58.
- Helgesen HH, Leira FS, Bryne TH, Albrektsen SM, Johansen TA. 2019. Real-time georeferencing of thermal images using small fixed-wing uavs in maritime environments. ISPRS J Photogramm Remote Sens. 154:84–97. doi:10.1016/j.isprsjprs.2019.05.009.
- James MR, Robson S. 2012. Straightforward reconstruction of 3d surfaces and topography with a camera: accuracy and geoscience application. J Geophys Res. 117(F3). doi:10.1029/2011JF002289.
- James MR, Robson S. 2014. Mitigating systematic error in topographic models derived from UAV and ground-based image networks. Earth Surf Processes Landf. 39(10):1413–1420. doi:10.1002/esp.3609.
- Jiang S, Jiang C, Jiang W. 2020a. Efficient structure from motion for large-scale UAV images: a review and a comparison of SFM tools. ISPRS J Photogramm Remote Sens. 167:230–251. doi:10.1016/j.isprsjprs.2020.04.016.
- Jiang S, Jiang W. 2017. On-board GNSS/IMU assisted feature extraction and matching for oblique UAV images. Remote Sens. 9(8):813. doi:10.3390/rs9080813.
- Jiang S, Jiang W, Huang W, Yang L. 2017. UAV-based oblique photogrammetry for outdoor data acquisition and offsite visual inspection of transmission line. Remote Sens. 9(3):278. doi:10.3390/rs9030278.
- Jiang S, Li Q, Jiang W, Chen W. 2022. Parallel structure from motion for UAV images via weighted connected dominating set. IEEE Trans Geosci Remote Sens. 60:1–13. doi:10.1109/TGRS.2022.3222776.
- Jiang X, Gao M, Gao Z. 2020b. A novel index to detect green-tide using UAV-based RGB imagery. Estuarine Coastal Shelf Sci. 245:106943. doi:10.1016/j.ecss.2020.106943.
- Kim W, Jung S, Kim K, Ryu JH, Moon Y. 2020a. Mapping red tide intensity using multispectral camera on unmanned aerial vehicle: a case study in Korean south coast. In: IGARSS 2020-2020 IEEE International Geoscience and Remote Sensing Symposium, IEEE; p. 5612–5615.
- Kim W, Jung S, Moon Y, Mangum SC. 2020b. Morphological band registration of multispectral cameras for water quality analysis with unmanned aerial vehicle. Remote Sens. 12(12):2024. doi:10.3390/rs12122024.
- Labelme. 2022. Labelme homepage; [accessed: 2022 Dec 4]. http://labelme.csail.mit.edu/Release3.0.
- Lin Y, Jiang M, Yao Y, Zhang L, Lin J. 2015. Use of UAV oblique imaging for the detection of individual trees in residential environments. Urban For Urban Green. 14(2):404–412. doi:10.1016/j.ufug.2015.03.003.
- Liu R, Xiao Y, Ma Y, Cui T, An J. 2022. Red tide detection based on high spatial resolution broad band optical satellite data. ISPRS J Photogramm Remote Sens. 184:131–147. doi:10.1016/j.isprsjprs.2021.12.009.
- Maze G, Olascoaga M, Brand L. 2015. Historical analysis of environmental conditions during Florida red tide. Harmful Algae. 50:1–7. doi:10.1016/j.hal.2015.10.003.
- Mikhail EM, Bethel JS, McGlone JC. 2001. Introduction to modern photogrammetry. New York, NY: John Wiley & Sons.
- Ronneberger O, Fischer P, Brox T. 2015. U-net: convolutional networks for biomedical image segmentation. In: International Conference on Medical Image Computing and Computer-Assisted Intervention, Springer; p. 234–241.
- Sakuno Y, Maeda A, Mori A, Ono S, Ito A. 2019. A simple red tide monitoring method using sentinel-2 data for sustainable management of brackish lake Koyama-ike, Japan. Water. 11(5):1044. doi:10.3390/w11051044.
- Shin J, Jo YH, Ryu JH, Khim BK, Kim SM. 2021. High spatial-resolution red tide detection in the southern coast of Korea using u-net from planetscope imagery. Sensors. 21(13):4447. doi:10.3390/s21134447.
- Štroner M, Urban R, Seidl J, Reindl T, Brouček J. 2021. Photogrammetry using UAV-mounted GNSS RTK: georeferencing strategies without gcps. Remote Sens. 13(7):1336. doi:10.3390/rs13071336.
- Zhao H, Zhang B, Wu C, Zuo Z, Chen Z. 2013. Development of a coordinate transformation method for direct georeferencing in map projection frames. ISPRS J Photogramm Remote Sens. 77:94–103. doi:10.1016/j.isprsjprs.2012.12.004.
- Zhao X, Liu R, Ma Y, Xiao Y, Ding J, Liu J, Wang Q. 2021. Red tide detection method for hy- 1d coastal zone imager based on u- net convolutional neural network. Remote Sensing. 14(1):88. doi:10.3390/rs14010088.
Appendix A.
Abbreviations
The following abbreviations are used in this manuscript:
| UAV | = | Unmanned Aerial Vehicle |
| SfM | = | Structure from Motion |
| MVS | = | Multi-view Stereo |
| RS | = | Remote Sensing |
| CNN | = | Convolutional Neural Network |
| RTK | = | Real-Time Kinematic |
| GNSS | = | Global Navigation Satellite System |
| POS | = | Positioning and Orientation system |
| EXIF | = | Exchangeable Image File Format |
| JSON | = | JavaScript Object Notation |
| GIS | = | Geographic Information System |
| DOM | = | Digital Orthographic Map |
| DSM | = | Digital Surface Map |
| IMU | = | Inertial Measurement Unit |
| RBR | = | Red-to-Blue Band Ratio |
Appendix B.
Meta data in EXIF
Table B.1. The used tag labels in the EXIF data of UAV images.