
 ?Mathematical formulae have been encoded as MathML and are displayed in this HTML version using MathJax in order to improve their display. Uncheck the box to turn MathJax off. This feature requires Javascript. Click on a formula to zoom.
Abstract
Timely and accurate extraction of crop planting units plays a critical role in crop yield estimation, soil management, food supplies, and disaster warnings. However, precisely mapping crop types is challenging in smallholder farming systems due to heterogeneous and mixed pixels, where field sizes are small, and crop types are very diverse. In this paper, the crop type system of Huocheng County in northwest China as an example area, crop classification feature variables are constructed using Sentinel-2 remote sensing images, and combining the ReliefF algorithm, three feature selection classification models are established by 3092 crop type sampling points data. The crop planting units are extracted using pixel-based and object-based classification methods, respectively, and unmanned aerial vehicle (UAV) data assess the accuracy as ground truth. The Sentinel-2 image based smallholder crops classification results indicate that: The effective combination of optimal input feature variables selection and classification models significantly improves crop classification accuracy. This is particularly evident when integrating this approach into pixel-based classification, addressing challenges such as low pixel classification accuracy in regions of this type. The validation results from UAV data also confirm these findings. At validation points 2, 3, and 4, pixel-based classification demonstrates significantly higher accuracy compared to object-based classification, with pixel-based classification accuracy improving by 9.16%, 7.83%, and 31.83%, respectively. Although the UAV validation accuracy does not reach a high level, pixel-based classification remains the optimal choice for smallholder crop classification. This method offers new insights and references for research related to the classification of smallholder crops with complex planting structures.
1. Introduction
The accurate identification and extraction of crop units are the basis of agricultural supervision and management. The Food and Agriculture Organization (FAO) of the United Nations, in its “Global Strategy to Improve Agricultural and Rural Statistics, Phase 2, 2020–2025” identified remote sensing as an essential component of its research agenda (Canton Citation2021), calling for new data and methodologies to enable high-accuracy, high-refresh crop mapping, and crop yield estimation (Fritz et al. Citation2013, Ali Mekouar Citation2017, Bizier and Rahija Citation2017) While the potential of satellite remote sensing in providing agricultural production information has been acknowledged since the mid-1970s (Frey et al. Citation1967, Macdonald Citation1984), the spectral characteristics of crops are susceptible to factors such as crop types, soil background, and cultivation activities. This susceptibility is particularly pronounced in regions with complex planting structures, where intra-class spectral variability poses a significant challenge to remote sensing monitoring (Wang et al. Citation2023).
In recent years, satellite remote sensing imagery from platforms such as MODIS and Landsat has been widely applied in crop classification and mapping. For instance, Vintrou et al. (Citation2012), Ping and Zang (Citation2016) utilized MODIS imagery for crop mapping and accuracy assessment, achieving satisfactory research outcomes. Similarly, Cai et al. (Citation2018). Peña and Brenning (Citation2015) and Tatsumi et al. (Citation2015) employed Landsat imagery for crop classification and mapping, also obtaining high classification accuracy. Despite their significant progress and contributions to the field of crop classification and mapping, challenges remain in accurately identifying small, scattered farmlands smaller than 2.56 hectares. These small fields often appear as mixed pixels of different crop types in satellite imagery. With spatial resolutions exceeding 100 meters for MODIS and ranging from 30 to 100 meters for Landsat, these satellites face limitations in resolving small crop types due to their spatial and temporal resolutions.
The European Space Agency launched the Sentinel-2A and Sentinel-2B satellites in 2015 and 2017, respectively. The Sentinel-2 satellites are equipped with a MultiSpectral Instrument (MSI) at an altitude of 786 km, covering 13 spectral bands with a swath width of 290 km (Řezník et al. Citation2020, Wang et al. Citation2022, Zualkernan et al. Citation2023). The ground resolutions are 10, 20, and 60 m. Compared to MODIS and Landsat-8, Sentinel-2 has three unique red-edge bands in the 705-865 nm range (Hollstein et al. Citation2016). Sentinel-2 imagery is the only optical data that includes three bands in the red-edge range, which is crucial for vegetation monitoring. Additionally, studies have shown that for the same area, the pixel sampling of Sentinel-2 is approximately ten times that of Landsat-8, attributed to its higher revisit frequency (revisit period of 5 days) (Drusch et al. Citation2012).
Recent studies have demonstrated the significant potential of Sentinel-2 satellite remote sensing imagery in complex planting structures and scattered smallholder crops. For instance, Hegarty-Craver et al. (Citation2020) used Sentinel-1 and Sentinel-2 data to classify cropland in Rwanda, achieving an overall classification accuracy of 83%, with maize accuracy reaching 91%. Similarly, Ibrahim et al. (Citation2021) utilized Sentinel-2 imagery to map crop types and planting systems in Nigeria, achieving an overall accuracy of 84% for crop identification. Khan et al. (Citation2023) employed Sentinel-2 imagery for early identification of crop types in smallholder farming systems in Punjab, Pakistan, with classification accuracies of 93.77% for major crops such as rice, wheat, and sugarcane. Additionally, Ren et al. (Citation2022) conducted crop mapping and rotation monitoring of smallholder farming systems in the mountainous regions of Inner Mongolia, China, using Sentinel-1/2 imagery. Their results showed that most crop types could be accurately identified, with an F1 score of up to 0.9, and Sentinel-2 imagery performing exceptionally well in the classification of soybeans and maize. However, it is noted that current research on complex smallholder crop structures predominantly focuses on regions in East, Southern, and West Africa. Research on smallholder crops in Western China remains relatively limited, highlighting the urgent need to develop crop classification methods suitable for these areas.
Machine learning algorithms such as Random Forest, Decision Tree, and Support Vector Machine (SVM) are popular in crop classification and mapping studies due to their high accuracy and ability to handle complex datasets (Mountrakis et al. Citation2011). These algorithms can produce ideal classification results even with a large number of input variables and training samples (Pal Citation2005, Ghimire et al. Citation2012, Rodriguez-Galiano et al. Citation2012). Therefore, we chose to use Random Forest, Decision Tree, and SVM, employing Relief for feature selection to ultimately identify the optimal algorithm for pixel-based and object-oriented classification methods. The selection of feature variables is crucial for improving crop classification accuracy (Jia and Li Citation2013). Additionally, some studies have shown that incorporating texture features into machine learning can improve the classification accuracy of smallholder systems with complex planting structures and scattered distribution. Therefore, in addition to spectral features and vegetation index features, we also included texture features in our classification process.
Using machine learning models for crop classification requires extensive training and validation sample datasets to train the classifiers, and these models are particularly sensitive to mislabeled data (Lu and Weng Citation2007, Elmes et al. Citation2020). This is especially true for smallholder crops with complex planting structures and scattered distributions, where the quality and quantity of samples can significantly impact the classification results (Lu et al. Citation2004, Maxwell et al. Citation2018). To mitigate this issue, we utilized handheld GPS and UAV imagery to accurately collect sample data, thereby enhancing classification accuracy. Based on this context, this study aims to address the following questions:
Among the feature variables constructed based on the characteristics of Sentinel-2 remote sensing imagery, which ones can be considered as optimal input variables?
Which type of machine model, when combined with the ReliefF algorithm, can accurately identify different crop types?
Can the selected optimal feature selection models, when combined with pixel-based and object-oriented methods, improve the accuracy of crop identification? Which method holds a comparative advantage?
Can the accuracy of crop identification through pixel-based and object-oriented classification methods be verified using UAV imagery?
2. Study area and data source
2.1. Study area
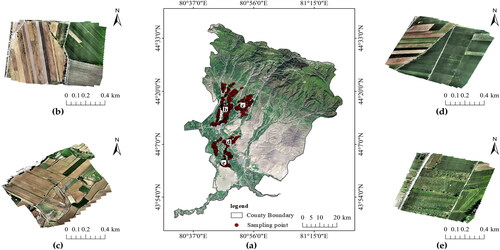
Huocheng County is located in the Ili Kazakh Autonomous Prefecture, Xinjiang Uygur Autonomous Region, China, situated in the northwest part of the Ili River Valley (80°11′∼81°24′ E, 43°39′∼44°50′ N). The elevation in the region ranges from 530 to 4283 m above sea level (see ). The northern and northeastern parts of the area consist of mountains and foothills, with the terrain gradually decreasing from north to south. The Beizhen Tao Mountain and Koguqin Mountain are in the northwest and northeast, respectively. The central region features loess hills, the southern part is the alluvial plain of the Ili River, and the southwestern part is a desert area. The region experiences a temperate continental semi-arid climate, with an annual average sunshine duration of 2550–3000 h, an average annual temperature of 9.1 °C, and an average annual precipitation of 219 mm (Qian et al. Citation2016). Due to its unique natural conditions, the area has abundant irrigated agricultural zones, resulting in a significant advantage in the development of agriculture and animal husbandry. With a diverse range of crops, Huocheng County has become the most critical production base for grain, oilseeds, fruits, and other agricultural products in Xinjiang.
Figure 1. Spatial distribution map of the study area and validation plots. In (a), the study area is depicted, with b-e representing the spatial distribution of four validation plots. The red dots indicate ground survey sampling points. The left and right sides of (b, c, d, and e) indicate the schematic diagrams of the four validation samples taken by the UAV.
2.2. Sentinel-2 data
Sentinel-2 satellites, part of the European Copernicus program, are multispectral imaging satellites comprising two identical units, Sentinel-2A and Sentinel-2B. These satellites offer a maximum spatial resolution of 10 meters. The coordinated observations by the twin satellites reduce the revisit interval to 5 days, which is advantageous for acquiring images during critical crop growth stages and providing more detailed information on field plots. Each satellite is equipped with a MultiSpectral Instrument (MSI) that features 13 spectral bands, covering the visible, near-infrared, and short-wave infrared spectral ranges (443–2,190 nm), allowing for high-frequency, continuous, and dynamic monitoring of the Earth’s surface (Mansaray et al. Citation2020).
This study utilized the Google Earth Engine (GEE) cloud platform (https://earthengine.google.com) to acquire a total of three Level-2A Sentinel-2 multispectral images of the study area, captured from July to August 2022. Since Sentinel-2 data undergo radiometric calibration and orthorectification, only atmospheric correction was necessary. Subsequently, cloud removal was performed to ensure less than 10% cloud cover. Given the inconsistency in spatial resolution among the utilized bands, the 20-meter resolution bands of the Sentinel-2 data were resampled to a 10-meter resolution to ensure uniformity in calculations. Finally, the images were clipped to meet the study requirements ().
Table 1. Basic parameters of remote sensing imagery.
2.3. Unmanned Aerial Vehicle (UAV) data
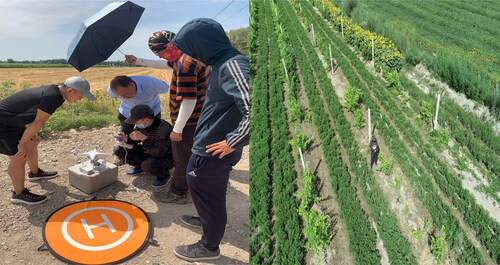
In the study area, four sample plots were selected, distributed as uniformly as possible, and containing a rich variety of crop types with a minimal proportion of artificial features to enhance representativeness (). The image acquisition process was conducted using a DJI Phantom 4 Pro fixed-wing UAV (). Aerial images of the four sample plots were captured on July 26, 27, 28, and 29, 2022. This UAV can fly for 30 min, has a maximum ascent speed of 6 m/s, a maximum horizontal flight speed of 72 km/h, can withstand wind speeds of up to 10 m/s, and has an effective pixel count of 12.4 million (Li et al. Citation2018). During image acquisition, the weather was clear with no clouds, wind speed was at level 2, and the flight parameters were set to a flight altitude of 100 m, forward overlap of 70%, side overlap of 80%, and a capture angle of 90°. The collected images were processed for stitching and orthorectification using Pix4D mapper software.
Figure 2. Image acquisition process during UAV flight.
2.4. Field sampling data
To comprehensively understand the types and spatial distribution of land features in the study area, the research team conducted field sampling during the crop growing season in 2022 (July 26th to July 31st). A total of 3092 ground samples were collected, including seven types of crops (corn, cotton, sunflower, pumpkin, radish, safflower, wheat, and stevia), as well as orchards, grasslands, forests, water bodies, and construction land, among others. During the sampling process, a handheld GPS (Garmin Oregon 450) was used for precise geolocation and photographic documentation, with a positional accuracy of less than 15 meters. Additionally, interviews with local farmers were conducted to record information on crop growth cycles, growth environments, and irrigation methods in the area, in order to obtain more accurate data. The collected samples were divided into training and validation sets in a 7:3 ratio ().
Table 2. Sample category information in the study area.
3. Research methods
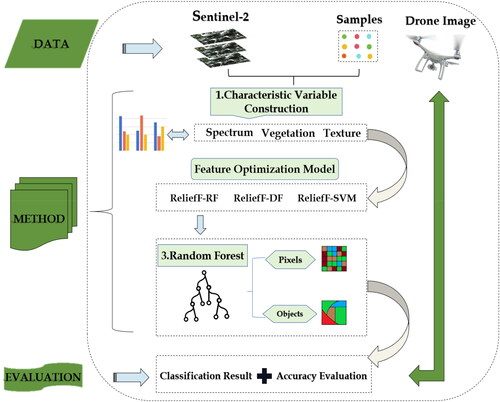
In this study, preprocessing was first conducted on Sentinel-2 satellite images and UAV imagery. Leveraging the Google Earth Engine (GEE) platform, 28 feature factors, including spectral features, vegetation index features, and texture features, were constructed based on Sentinel-2 satellite images and field sampling data. The ReliefF algorithm was combined with three models: Random Forest (RF), Decision Tree (DT), and Support Vector Machine (SVM), to select the optimal feature variables. The classification accuracy was evaluated through a confusion matrix, and the best feature selection model was determined. Subsequently, the study explored the classification performance of the best feature selection model in pixel-based and object-based classifications. UAV imagery data was utilized to validate the performance of the two methods in crop identification. The specific workflow is illustrated in .
Figure 3. Workflow of crop remote sensing identification method.
3.1. Characteristic variable construction
3.1.1. Spectral feature construction
Spectral features are extracted based on the spectral information from different bands. Sentinel-2 data includes a total of 13 bands. This study selected 10 of these bands, which are commonly used for land type detection, surface monitoring, vegetation monitoring, and environmental monitoring. The selected bands are B2, B3, B4, B5, B6, B7, B8, B8a, B11, and B12.
3.1.2. Vegetation index construction
Vegetation indices play a crucial role in the remote sensing identification of crops, providing comprehensive information when multiple indices are used for analysis. Considering the geographical environment, crop types, and red-edge bands of Sentinel-2 data in the study area, a total of 10 vegetation indices were selected for this study (detailed information is shown in ). NDVI is an indicator for measuring surface coverage and vegetation growth status; EVI is used to improve the accuracy and stability of vegetation cover estimation; LSWI is used to detect water content in vegetation; SAVI is a simplified difference vegetation index typically used to detect vegetation growth conditions. LCI is used to measure chlorophyll content; REVI describes vegetation growth status through the ratio of red and near-infrared bands. RENVI705、RENDVI740 and RENDVI783 are based on specific red-edge bands and are used to characterize information on vegetation cover and growth status.
Table 3. Feature construction data set.
3.1.3. Texture feature construction
Texture features capture the spatial structure differences in grayscale, which can supplement spectral features and vegetation indices in crop identification and monitoring, thereby enhancing classification accuracy. These features are crucial for distinguishing different crop types. GLCM is a commonly used method for texture feature extraction. Using the GEE platform, principal component analysis was performed on the 10 bands of the original images, and the first principal component was extracted to calculate the gray-level co-occurrence matrix (GLCM) function. To reduce dimensionality and redundancy, nine texture feature factors were extracted (Chen et al. Citation2023), with detailed information provided in . ENT represents the degree of non-uniformity or complexity in the image texture; VAR measures the variation in pixel intensity within the image; DENT indicates the complexity of the texture; IDM measures local homogeneity within the image; SAVG represents the average of the sum of pixel intensities; CONTRAST reflects the sharpness and the depth of texture grooves in the image; CORR measures the similarity of spatial gray-level co-occurrence matrix elements in the row or column direction, with higher values indicating greater local grayscale correlation in the image; DVAR represents the variance of pixel intensity differences; ASM measures the uniformity of the texture.
3.2. Building feature selection model based on ReliefF algorithm
There are various methods for feature selection, generally categorized into two types: filter and wrapper (Langley Citation1994). The ReliefF (Relief Feature Selection) algorithm, a typical filter method, belongs to the category of feature weight algorithms and is an evolution of the Relief algorithm. It is known for its high computational efficiency and good classification performance. ReliefF can effectively filter multidimensional features faced by the classification surface and make full use of the information from the sub-quality categories of the training sample set (Kononenko et al. Citation1997). Therefore, the ReliefF algorithm is considered one of the most effective filter-based feature selection methods (Yan et al. Citation2016). The specific formula is as follows:
(1)
(1)
In the above equation, diff(A, R1, R2) represents the difference between samples R1 and R2 on feature A. Mj(C) represents the j-the nearest neighbor sample in class C ∉ class(R). The expression is as follows:
(2)
(2)
The purpose of constructing feature selection models is to identify the most discriminative and relevant features from the feature variable dataset. This aims to enhance the model’s performance and generalization ability while reducing the risk of overfitting. Therefore, this study employs the following feature selection models:(1) Random Forest (RF): Proposed by Breiman, RF is a non-parametric machine learning algorithm consisting of multiple decision trees. It is data-driven and known for its fast classification speed, robustness, accuracy, and effectiveness in addressing overfitting issues. RF is widely applicable in various remote sensing recognition studies (Breiman Citation2001). (2) Decision Tree (DT): The DT algorithm splits sample data based on fields that provide maximum information gain. It prunes or merges leaves of the decision tree to enhance classification accuracy. Ultimately, it determines the optimal threshold for each leaf, obtaining the importance scores for each feature parameter (Hong-Chao et al. Citation2010). (3) Support Vector Machines (SVM): This method utilizes the principle of structural risk minimization to enhance the generalization ability of the classification model by minimizing model generalization error while ensuring minimal error (Cherkassky and Ma Citation2004).
3.3. Crop remote sensing identification methods
3.3.1. Pixel-based classification
This study, inspired by the research of Le’an Qu et al. (Citation2021), implemented Relief-RF classification based on pixels using the Google Earth Engine (GEE) cloud computing platform. When using the RF algorithm in GEE, two parameters, number of trees and minleaf, need to be configured. For the number of trees parameter, we started with 10 and gradually increased it to 100, then further increased it to 1000. For the minleaf parameter, we started with 5 and increased it by 1 in each iteration, reaching 25. Finally, through repeated experimental comparisons, we set number of trees to 500 and minleaf to 15 in all models.
3.3.2. Object-based classification
Remote sensing image segmentation is a prerequisite for object-oriented classification. In this study, the SNIC (Simple Non-Iterative Clustering) image segmentation algorithm available in GEE was selected. Derived from Simple Linear Iterative Clustering (SLIC), SNIC inherits SLIC's advantages such as ease of implementation, high computational efficiency, and control over compactness and the number of super pixels. Additionally, SNIC exhibits non-iterative characteristics, fast processing speed, and minimal memory usage (Luo et al. Citation2021). Considering the impact of segmentation scale on results, the study explored the sensitivity of model accuracy to segmentation scale. Ten Seeds parameters were selected in GEE for the SNIC algorithm, representing seed pixel distances of 10, 20, 30, 40, 50, 60, 70, 80, 90, and 100 pixels. Ten segmented images were generated for model training and accuracy validation. The seed pixel distance yielding the highest accuracy was chosen as the optimal seed pixel distance. Furthermore, taking into account the characteristics of land cover types in the study area, parameters such as 'Compactness’ were set to 0, 'Connectivity’ was set to 8, and 'Neighborhood size’ was set to 256.
3.4. Accuracy assessment methods
In this study, the accuracy assessment was conducted through visual interpretation of the orthorectified and stitched images obtained from the unmanned aerial vehicle (UAV). Ground features were identified, and a digitized app Radish was employed to outline the image boundaries and generate vector layers. Subsequently, the classification results of both pixel-based and object-based methods were selected. The agricultural land areas were then calculated based on the UAV vectorized images to serve as ground truth for evaluating the identification performance of different methods. Simultaneously, the confusion matrix was utilized to assess the classification results of the two methods. The evaluation criteria included Overall Accuracy (OA), User’s Accuracy (UA), Producer’s Accuracy (PA), Kappa Coefficient (KC), and F1 Score. The formulas are as follows:
(3)
(3)
(4)
(4)
(5)
(5)
(6)
(6)
(7)
(7)
In the formula: n is the number of categories; N is the total number of validation samples; is the number of correctly classified samples in each category and is the value on row
and column
is the total number of validation samples classified by the classifier into a particular category and
is the total number of validation samples in a particular category.
4. Results and analysis
4.1. Feature importance analysis
4.1.1. Spectral feature analysis
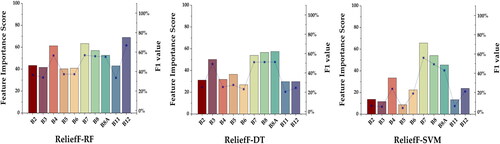
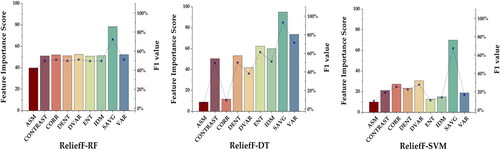
The importance scores of spectral feature factors, as shown in , reveal the following insights (Figure RF): Band 12 (B12) has the highest importance, followed by bands B4, B7, B8, and B8A, while the remaining bands exhibit lower importance. In Figure DT, B8A stands out as the most important, followed by B3, B7, and B8, with other bands having relatively lower importance. In Figure SVM, B7 demonstrates the highest importance, followed by B4, B8, and B8A, while the importance of the remaining bands is comparatively lower. Consequently, the study determines that the visible and near-infrared bands (B3, B4, B7, B8, and B8A) and the shortwave infrared band (B12) of Sentinel-2 remote sensing imagery are selected as preferred spectral feature factors.
Figure 4. Spectral feature importance score.
4.1.2. Vegetation index feature analysis
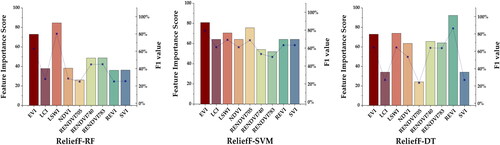
Based on the importance scores of vegetation index feature factors, as depicted in , the following observations can be made (Figure RF): Land Surface Water Index (LSWI) has the highest importance, followed by Enhanced Vegetation Index (EVI), while the importance of other feature factors is relatively lower. In Figure DT, only Leaf Chlorophyll Index (LCI), Normalized Difference Vegetation Index 1 (RENDVI705), and Soil-adjusted Vegetation Index (SVI) have lower importance, with the rest of the feature factors exhibiting higher importance. In Figure SVM, EVI holds the highest importance, followed by LSWI, Difference Normalized Vegetation Index 1 (REDNVI705), Red Edge Vegetation Index (REVI), and Soil-adjusted Vegetation Index (SAVI), whereas the importance of other feature factors is comparatively lower. Based on the frequency of occurrence of feature factors with higher importance across the three models, the study selects conventional vegetation indices (EVI, LSWI, and NDVI) and red-edge vegetation indices (RENDVI740, RENDVI783 and REVI) as preferred vegetation index feature factors.
Figure 5. Vegetation feature importance score.
4.1.3. Texture feature analysis
Based on the importance scores of texture feature factors, as shown in , the following observations can be made (Figure RF): SAVG has the highest importance, while the importance of other feature factors is relatively lower. In Figure DT, SAVG has the highest importance, followed by CONTRAST, DENT, ENT, IDM and VAR, with the importance of other feature factors being lower. In Figure SVM, SAVG has the highest importance, followed by CONTRAST and DENT, while the importance of other feature factors is generally lower. Based on the consistent prominence of these feature factors across the three models, the study selects SAVG, CONTRAST, DENT, ENT and IDM as preferred texture feature factors.
Figure 6. Texture feature importance score.
4.2. Comparison and analysis of classification results from different models
This study evaluates the crop identification and extraction effectiveness of different feature selection models (). The results indicate that the OAs of the three feature selection models are all above 95%, and the Kappa values are all above 0.93. The OA and Kappa values of the ReliefF-RF model are higher than the other two models, while the OA and Kappa values of the ReliefF-DT model are lower than the other two models. Looking at the classification of individual crops by the three models, cotton, wheat, safflower flower, and Radish have higher PA but lower UA, indicating the occurrence of misclassification in all three models, especially in the classification of safflower flower and Radish, where misclassification is most severe.
Table 4. Classification accuracy of feature optimization model.
To present the classification results of the three models in crop identification and extraction more intuitively, provides the spatial distribution and local details of the classification results of the three models. From the figure, we can observe that the overall spatial distribution patterns of the three models are relatively consistent with minor differences. However, there are still some differences in local classification details among the three models. In the local classification details of ReliefF-RF, it can be observed that the classification results of RF are generally consistent with the original farmland image, especially in distinguishing wheat and safflower flowers, where the classification results are significantly better than the other two models. However, in the local classification details of ReliefF-DT and ReliefF-SVM, there are many misclassifications and omissions, such as misclassifying roads and buildings as crops and omitting wheat and safflower flowers. This leads to lower classification accuracy for these two models. The occurrence of omissions or misclassifications during the recognition process may be due to the impact of the spatial resolution of Sentinel-2 remote sensing images on the algorithm, making it difficult to accurately identify land features, especially in handling complex terrain, mixed pixels, or situations with significant seasonal variations, where omissions and misclassifications may be more pronounced.
Figure 7. Classification results of feature optimization model based on ReliefF in 2022.
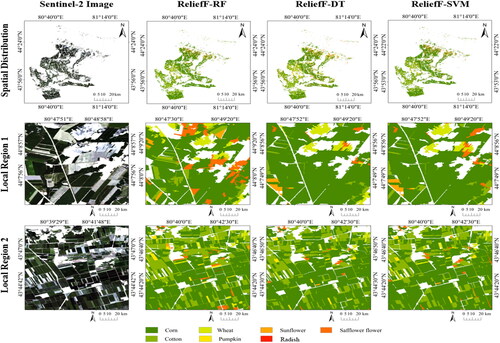
In summary, compared to ReliefF-DT and ReliefF-SVM models, the classification results of the ReliefF-RF model are closer to the true distribution of farmland, and the extraction results are significantly better than the other two models. Additionally, it achieves higher classification accuracy. Therefore, the ReliefF-RF method is identified as the optimal feature selection model in this study.
4.3. Comparative analysis of pixel based and object-oriented classification results
According to the classification accuracy provided in , both classification methods exhibit an overall accuracy exceeding 95%, and the Kappa coefficients are both above 0.94. Specifically, for pixel-based classification, the accuracy for all crops, except pumpkins, has Producer’s Accuracy (PA) and User’s Accuracy (UA) exceeding 93%, with an Overall Accuracy (OA) of 96.20% and a Kappa coefficient of 0.9462. Similarly, for object-based classification, the accuracy for all crops, except pumpkins, has PA and UA exceeding 93%, with an OA of 96.09% and a Kappa coefficient of 0.9447. Therefore, although there is minimal difference in classification accuracy between the two methods, the pixel-based method still outperforms the object-based classification method in terms of accuracy.
Table 5. Pixel and object-oriented classification accuracy.
In order to visually compare the classification differences between the two methods, this study selected two local areas from the overall classification results for a detailed comparison (see and ). Through visual interpretation, it is evident that both classification methods perform well in identifying certain crops. shows that, despite the presence of fewer misclassifications or omissions in local area 2, the classification results exhibit a high level of detail. They clearly outline the boundaries of farmland, allowing for accurate discrimination of crops. The classification results closely resemble the actual spatial distribution of crops, indicating that this method effectively utilizes information from Sentinel-2 remote sensing imagery, including spectral, vegetation index, and texture information. This has effectively suppressed the “salt-and-pepper” noise phenomenon, resulting in improved classification outcomes.
Figure 8. Local region classification result map based on pixel.
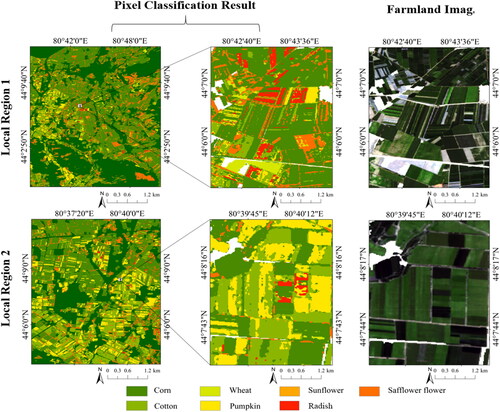
Figure 9. The result map of local region classification based on object-oriented.
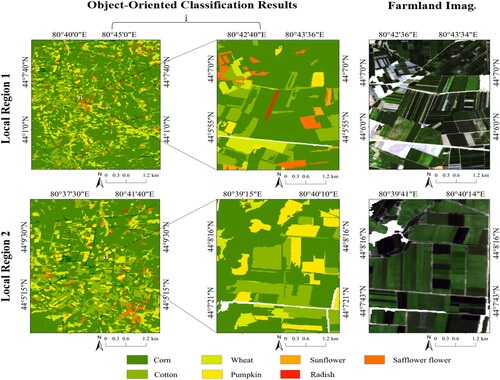
From , it is apparent that, compared to the pixel-based classification method, the object-based classification method exhibits a lower level of classification detail. Both local areas 1 and 2 suffer from significant misclassifications and omissions. For instance, there are instances where roads and buildings are misclassified as crops, making it difficult to accurately depict crop boundary information. However, the object-based method performs relatively well in delineating small and fragmented farmlands.
In summary, both in terms of pixel-based classification accuracy and local classification performance, when employing the same feature selection model, the pixel-based method outperforms the object-based classification method. Moreover, pixel-based classification adequately captures the shape and boundary information of farmlands, resulting in more detailed crop classification results.
4.4. Accuracy comparison analysis based on unmanned aerial vehicle image data
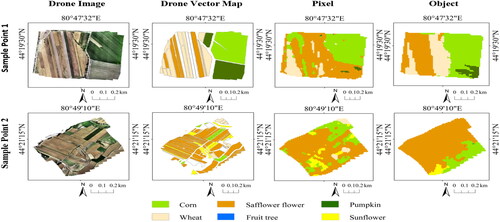
In order to comprehensively and quantitatively evaluate the impact of different classification methods on the accuracy of crop identification, this study utilizes UAV (Unmanned Aerial Vehicle) vectorized image data to conduct an accuracy comparison analysis between pixel-based and object-based classification methods. As shown in , the accuracy of object-based classification is superior to pixel-based classification in plot 1; however, in plots 2 and 3, pixel-based classification demonstrates higher accuracy compared to object-based classification. In plot 4, the accuracy is 0 for object-based classification since there were no crop identifications in the results. The results indicate that, except for plot 1, the accuracy of pixel-based classification in plots 2, 3, and 4 has improved by 9.16%, 7.83%, and 31.83%, respectively, compared to object-based classification. Therefore, it can be concluded that pixel-based classification achieved the optimal classification accuracy in this study, except for plot 1.
Table 6. UAV data verification accuracy.
From , it can be observed that object-based classification performs the best in plot 1. However, both pixel-based and object-based classifications exhibit misclassification and omission phenomena. This occurs due to significant spectral overlap and similarity in Sentinel-2 remote sensing images for different crops. When identifying corn, its spectral characteristics are notably distinct from other crops, making accurate classification easier. However, wheat and safflower have relatively similar spectral features, with comparable reflectance in certain bands, leading to confusion between them. In plot 2, although pixel-based classification shows noticeable “salt-and-pepper noise,” the classification result is still optimal. The classification of wheat and safflower is particularly effective, possibly because these crops dominate the agricultural field, enabling their accurate differentiation. However, misclassification and omission phenomena are still present in both pixel-based and object-based classifications. In object-based classification, misclassification of corn, safflower, and sunflowers is more severe, possibly due to their spectral similarities in addition to the smaller areas occupied by corn and sunflowers, resulting in poorer classification performance.
Figure 10. Verification classification results based on UAV quality data.
From , it is evident that, in plot 3, pixel-based classification still exhibits “salt-and-pepper noise,” but overall, the classification result is significantly better than that of object-based classification. Moreover, object-based classification only identifies corn, safflower, and pumpkin, failing to accurately recognize other crops. In plot 4, the pixel-based classification performs best for corn, while fruit trees are misclassified as corn due to their similarity in certain bands. Red flowers, with a lower proportion in this farmland and indistinguishable spectral features compared to corn, also contribute to misclassification. However, object-based classification fails to identify any crops in this area, preventing a comparative analysis.
Figure 11. Verification classification results based on UAV quality data.
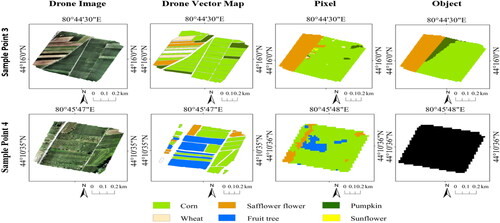
In summary, the comparison and validation of vector data obtained from interpreting UAV images using two methods reveal that the pixel-based random forest classification results are closer to the true distribution of crops. Despite the overall modest validation accuracy, it’s important to note that the UAV image resolution used in this study is 2.7 m, while Sentinel-2 remote sensing image resolution ranges from 10 to 30 m. The substantial difference in spatial resolution between the two datasets makes it challenging for Sentinel-2 remote sensing images to accurately differentiate certain similar land cover types. Consequently, the final results are inevitably influenced by this resolution disparity. However, considering the overall classification performance, the validation accuracy is sufficient to demonstrate the reliability of the pixel classification method. It can serve as a valuable reference for subsequent related research.
5. Discussions
Previous research on crop classification in areas with complex cropping structures, particularly smallholder crops, has mostly been conducted in regions such as Southern Africa, East Africa, and West Africa. Additionally, there has been limited research on the optimal features for enhancing crop remote sensing identification (Wang et al. Citation2019). In this study, based on Sentinel-2 satellite imagery, drone imagery, and on-site sampling survey data, we successfully extracted and evaluated crop information in smallholder crop areas with complex cropping structures using different crop remote sensing identification methods, guided by feature selection. The research results have addressed the challenge of low pixel classification accuracy to some extent, effectively suppressing the occurrence of “salt and pepper” noise, and achieving high-precision crop information extraction, which holds significant implications for crop classification. Simultaneously, it provides new insights and references for crop classification and extraction in smallholder crop areas characterized by complex cropping structures and fragmented farmlands.
5.1. Impact analysis of feature variables and selected models on identification results
The selection of feature variables and classification models is a critical factor influencing the accuracy of crop identification. In recent years, with the advancement of remote sensing technology, numerous scholars have developed a series of new methods that fully utilize various features such as spectral and texture information for classification. These methods have, to some extent, improved the accuracy of crop classification (Yanan et al. Citation2021). For instance, Trivedi et al. (Citation2023) incorporated spectral and texture features and employed a Random Forest classifier with 10-fold cross-validation and recursive feature elimination for feature selection and model building. Their results indicated that this method achieved a classification accuracy of up to 96%. Lin et al. (Citation2015) observed that the addition of shape and texture information led to significantly higher classification accuracy compared to purely spectral information, particularly by effectively delineating the boundaries of easily confused building areas, resulting in a 9.32% increase in classification accuracy.
Therefore, this study extensively utilized various feature variables, including spectral, vegetation, and texture features, in combination with feature selection models and both pixel-based and object-based classification methods for crop remote sensing identification. Analysis results from pixel-based and object-based classifications revealed that the pixel-based classification method outperformed the object-based method, with the Overall Accuracy (OA) and Kappa values of pixel-based classification being 0.11% and 0.0015 higher, respectively. This finding contrasts with the conclusions of Belgiu and Csillik (Citation2018) and Tassi et al. (Citation2021), indicating that the integration of multi-feature optimization models with pixel-based classification can mitigate issues related to mixed pixels resulting from fragmented agricultural landscapes and complex terrains, thereby effectively improving crop identification accuracy. These results provide further reference for crop classification using multi-feature optimization models.
5.2. Advantages of using UAV images for validation
This study integrates Sentinel-2 remote sensing imagery and UAV imagery to classify and extract crop information in areas with complex cropping structures, specifically targeting smallholder crops. On one hand, it leverages the wide coverage and unique red-edge band advantages of Sentinel-2 imagery; on the other hand, it utilizes the high spatial resolution and flexibility of UAV imagery. To achieve more accurate crop identification, four sample plots were established within the study area to validate the accuracy of crop identification using both pixel-based and object-based classification methods. Comparative analysis of pixel-based and object-based classifications revealed that, except for sample plot 1, the accuracy of pixel-based classification in sample plots 2, 3, and 4 increased by 9.16%, 7.83%, and 31.83%, respectively, compared to object-based classification. Moreover, pixel-based classification better highlights the true physical boundaries of farmland, making it more suitable for crop classification in areas with complex cropping structures typical of smallholder crops. This study convincingly demonstrates that validation using UAV imagery results in more accurate crop identification and showcases the potential application of UAV imagery in crop remote sensing studies. This approach is not only applicable to crop classification but also to other types of remote sensing classification research, especially in regions with complex cropping structures characteristic of smallholder farms.
Although our approach achieved high classification accuracy for smallholder crops, several uncertainties remain. First, to avoid interference from non-crop areas, we used Sentinel-2 satellite remote sensing imagery with a resolution of 10-20 meters. However, since this study focused on optimizing a single temporal image, the classification results may lack spatiotemporal representativeness. Existing research indicates that the optimal features for specific land cover types vary with different regions, times within the same region, and spatial distributions. Therefore, future research will explore the differences in feature variables and optimization models across different regions and periods to evaluate the applicability and robustness of our conclusions.
Additionally, although the classification methods achieved high accuracy levels, the validation accuracy using UAV imagery was relatively low, with the highest and lowest values being 70.43% and 28.73%, respectively, indicating that it did not reach a high level. We believe this result can be explained more deeply from the perspective of spatial resolution. The UAV imagery used in the study has a higher resolution (2.7 meters) compared to Sentinel-2 remote sensing imagery (10–30 meters), providing more detailed land feature information. However, the study area’s complex cropping structure, severe farmland fragmentation, and spectral similarity among multiple crops limit the ability of Sentinel-2 imagery to distinguish between similar land cover types accurately, thereby affecting the validation accuracy. Therefore, in future research, we will consider using higher-resolution satellite imagery, such as GF-2, for crop classification extraction to further improve crop identification accuracy and UAV validation accuracy.
6. Result
This study focuses on the complex planting structures of smallholder crops in Huocheng County, western China. With the support of Sentinel-2 satellite remote sensing imagery, unmanned aerial vehicle (UAV) imagery, and 3092 field survey data points, the study constructs feature variables. It utilizes the ReliefF algorithm in conjunction with three models, namely Random Forest (RF), Decision Tree (DT), and Support Vector Machine (SVM), to select optimal feature variables. The study investigates the strengths and weaknesses of different feature selection models in crop identification research. Furthermore, it explores the performance of the best feature selection model in pixel-based and object-based classification and validates the classification results using UAV imagery. The findings are as follows:
According to the feature importance scores of ReliefF-RF, ReliefF-DT, and ReliefF-SVM, visible annear-infrared bands (B3, B4, B7, B8, and B8A), short-wave infrared band (B12), conventional vegetation indices (EVI, LSWI, and NDVI), red-edge vegetation indices (RENDVI740, RENDVI783, and REVI), and texture feature factors (SAVG, CONTRAST, DENT, ENT and IDM) can be considered as optimal input feature variables.
ReliefF-RF classification achieves an overall accuracy (OA) of 95.38% and Kappa of 0.93, demonstrating better crop recognition ability compared to ReliefF-DT and ReliefF-SVM models.
Pixel-based classification attains an OA of 96.20% and Kappa of 0.94; object-oriented classification achieves an OA of 96.09% and Kappa of 0.94. Pixel-based classification achieves the highest classification accuracy in this study.
Except for validation plot 1, the pixel-based classification accuracy improves by 9.16%, 7.83%, and 1.83% in validation plots 2, 3, and 4, respectively, compared to object-oriented classification. This suggests that combining feature selection models with pixel-based classification for crop remote sensing identification has a clear advantage over object-oriented classification.
In the realm of remote sensing classification for smallholder crops with intricate planting structures, this study introduces novel insights and references regarding the effectiveness of various feature selection models and classification methods.
Acknowledgments
The authors wish to thank the referees for providing helpful suggestions for the improvement of the manuscript.
Data availability statement
The Sentinel-2 remote sensing image data used in this study were obtained from (https://earthengine.google.com). Unmanned aerial vehicle (UAV) sampling data and on-site sampling data were collected during field investigations conducted by the research team.
Disclosure statement
No potential conflict of interest was reported by the author(s).
Additional information
Funding
References
- Ali Mekouar M. 2017. 15. Food and agriculture organization of the United Nations (FAO). Yearbook of Int Environ Law. 28:506–520. doi: 10.1093/yiel/yvy073.
- Belgiu M, Csillik O. 2018. Sentinel-2 cropland mapping using pixel-based and object-based time-weighted dynamic time warping analysis. Remote Sens Environ. 204:509–523. doi: 10.1016/j.rse.2017.10.005.
- Bizier V, Rahija M. 2017. Twenty-fifth session. Food and Agriculture Organization of the United Nations. Entebbe, Uganda. Retrieved from https://www.fao.org/3/bt858e/bt858e.pdf
- Breiman L. 2001. Random forests. Machine Learning. 45(1):5–32. doi: 10.1023/A:1010933404324.
- Cai Y, Guan K, Peng J, Wang S, Seifert C, Wardlow B, Li Z. 2018. A high-performance and in-season classification system of field-level crop types using time-series landsat data and a machine learning approach. Remote Sens Environ. 210:35–47. doi: 10.1016/j.rse.2018.02.045.
- Canton H. 2021. Food and agriculture organization of the United Nations—FAO. In: The Europa directory of international organizations 2021. Abingdon-on-Thames, Oxfordshire, UK: Routledge; p. 297–305.
- Chen J, Li H, Liu Y, Chang Z, Han W, Liu S. 2023. Remote sensing recognition of agricultural crops based on sentinel—2 data with multi—feature optimization. Remote Sens. Nat. Resour. 13(4):1–9.
- Cherkassky V, Ma Y. 2004. Practical selection of svm parameters and noise estimation for SVM regression. Neural Netw. 17(1):113–126. doi: 10.1016/S0893-6080(03)00169-2.
- Drusch M, Del Bello U, Carlier S, Colin O, Fernandez V, Gascon F, Hoersch B, Isola C, Laberinti P, Martimort P, et al. 2012. Sentinel-2: Esa’s optical high-resolution mission for GMES operational services. Remote Sens Environ. 120:25–36., doi: 10.1016/j.rse.2011.11.026.
- Elmes A, Alemohammad H, Avery R, Caylor K, Eastman J, Fishgold L, Friedl M, Jain M, Kohli D, Laso Bayas J, et al. 2020. Accounting for training data error in machine learning applied to earth observations. Remote Sensing. 12(6):1034. doi: 10.3390/rs12061034.
- Frey HT, Mannering JV, Burwell RE. 1967. Agricultural application of remote sensing: the potential from space platforms. Washington, DC: Economic Research Service, US Department of Agriculture.
- Fritz S, See L, You L, Justice C, Becker‐Reshef I, Bydekerke L, Cumani R, Defourny P, Erb K, Foley J, et al. 2013. The need for improved maps of global cropland. EoS Transactions. 94(3):31–32., doi: 10.1002/2013EO030006.
- Ghimire CP, Bruijnzeel LA, Lubczynski MW, Bonell M. 2012. Rainfall interception by natural and planted forests in the middle mountains of central Nepal. J Hydrol. 475:270–280. doi: 10.1016/j.jhydrol.2012.09.051.
- Hegarty-Craver M, Polly J, O’neil M, Ujeneza N, Rineer J, Beach RH, Lapidus D, TeMPle DS. 2020. Remote crop mapping at scale: using satellite imagery and uav-acquired data as ground truth. Remote Sens. 12(12):1984. doi: 10.3390/rs12121984.
- Hollstein A, Segl K, Guanter L, Brell M, Enesco M. 2016. Ready-to-use methods for the detection of clouds, cirrus, snow, shadow, water and clear sky pixels in sentinel-2 msi images. Remote Sens. 8(8):666. doi: 10.3390/rs8080666.
- Hong-Chao QI, Yuan Q, Tian XU. 2010. The study of the northwest arid zone land-cover classification based on c5. 0 decision tree algorithm at Wuwei City, Gansu Province. Remote Sens Technol Appl. 24(5):648–653.
- Ibrahim ES, Rufin P, Nill L, Kamali B, Nendel C, Hostert P. 2021. Mapping crop types and cropping systems in Nigeria with sentinel-2 imagery. Remote Sens. 13(17):3523. doi: 10.3390/rs13173523.
- Jia K, Li QZ. 2013. Review of features selection in crop classification using remote sensing data. Resour Sci. 35(12):2507–2516.
- Khan HR, Gillani Z, Jamal MH, Athar A, Chaudhry MT, Chao H, He Y, Chen M. 2023. Early identification of crop type for smallholder farming systems using deep learning on time-series sentinel-2 imagery. Sensors. 23(4):1779. doi: 10.3390/s23041779.
- Kononenko I, Šimec E, Robnik-Šikonja M. 1997. Overcoming the myopia of inductive learning algorithms with relieff. Appl Intelligence. 7(1):39–55. doi: 10.1023/A:1008280620621.
- Langley P. 1994. Selection of relevant features in machine learning. In Proceedings of the AAAI Fall Symposium on Relevance (pp. 1–5). New Orleans, LA: AAAI Press.
- Li M, Huang Y, Li X, Peng D, Xie J. 2018. Extraction of rice planting information based on remote sensing image from uav. Transact Chinese Soc Agricul Engin. 34(4):108–114.
- Lin N, Jiang Q, Yang J. 2015. Classifications of agricultural land use based on high-spatial resolution zy1-02c remote sensing images. Transact Chinese Soci Agricul Machin. 46(1):278–284.
- Lu D, Mausel P, Brondízio E, Moran E. 2004. Change detection techniques. Int J Remote Sens. 25(12):2365–2401. doi: 10.1080/0143116031000139863.
- Lu D, Weng Q. 2007. A survey of image classification methods and techniques for improving classification performance. Int J Remote Sens. 28(5):823–870. doi: 10.1080/01431160600746456.
- Luo C, Qi B, Liu H, Guo D, Lu L, Fu Q, Shao Y. 2021. Using time series sentinel-1 images for object-oriented crop classification in google earth engine. Remote Sens. 13(4):561. doi: 10.3390/rs13040561.
- Macdonald RB. 1984. A summary of the history of the development of automated remote sensing for agricultural applications. IEEE Trans Geosci Remote Sensing. GE-22(6):473–482. doi: 10.1109/TGRS.1984.6499157.
- Mansaray LR, Wang F, Huang J, Yang L, Kanu AS. 2020. Accuracies of support vector machine and random forest in rice mapping with sentinel-1a, landsat-8 and sentinel-2a datasets. Geocarto Int. 35(10):1088–1108. doi: 10.1080/10106049.2019.1568586.
- Maxwell AE, Warner TA, Fang F. 2018. Implementation of machine-learning classification in remote sensing: an applied review. Int J Remote Sens. 39(9):2784–2817. doi: 10.1080/01431161.2018.1433343.
- Mountrakis G, Im J, Ogole C. 2011. Support vector machines in remote sensing: a review. ISPRS J Photogrammetr Remote Sens. 66(3):247–259. doi: 10.1016/j.isprsjprs.2010.11.001.
- Pal M. 2005. Random forest classifier for remote sensing classification. Int J Remote Sens. 26(1):217–222. doi: 10.1080/01431160412331269698.
- Peña MA, Brenning A. 2015. Assessing fruit-tree crop classification from landsat-8 time series for the maipo valley, chile. Remote Sens Environ. 171:234–244. doi: 10.1016/j.rse.2015.10.029.
- Ping Y-P, Zang S-Y. 2016. Crop identification based on modis ndvi time-series data and phenological characteristics. J Nat Resourc. 31(3):503–513.
- Qian C, Kang L, Juan L, Gui-Xiang X, Qi S, Hong-Zhang SI, Xin-Feng Y. 2016. Study on the Daxigou wild apricot fruit phenotypic diversity in Huocheng County, Xinjiang. Xinjiang Agricult Sci. 53(5):791.
- Qu LA, Chen Z, Li M, Zhi J, Wang H. 2021. Accuracy improvements to pixel-based and object-based lulc classification with auxiliary datasets from google earth engine. Remote Sens. 13(3):453. doi: 10.3390/rs13030453.
- Ren T, Xu H, Cai X, Yu S, Qi J. 2022. Smallholder crop type mapping and rotation monitoring in mountainous areas with sentinel-1/2 imagery. Remote Sens. 14(3):566. doi: 10.3390/rs14030566.
- Řezník T, Pavelka T, Herman L, Lukas V, Širůček P, Leitgeb Š, Leitner F. 2020. Prediction of yield productivity zones from landsat 8 and sentinel-2A/B and their evaluation using farm machinery measurements. Remote Sens. 12(12):1917. doi: 10.3390/rs12121917.
- Rodriguez-Galiano VF, Ghimire B, Rogan J, Chica-Olmo M, Rigol-Sanchez JP. 2012. An assessment of the effectiveness of a random forest classifier for land-cover classification. ISPRS J Photogramm Remote Sens. 67:93–104. doi: 10.1016/j.isprsjprs.2011.11.002.
- Tassi A, Gigante D, Modica G, Di Martino L, Vizzari M. 2021. Pixel-vs. Object-based landsat 8 data classification in google earth engine using random forest: the case study of maiella national park. Remote Sens. 13(12):2299. doi: 10.3390/rs13122299.
- Tatsumi K, Yamashiki Y, Torres M, Taipe CLR. 2015. Crop classification of upland fields using random forest of time-series landsat 7 etm + data. Comput Electron Agricul. 115:171–179. doi: 10.1016/j.compag.2015.05.001.
- Trivedi MB, Marshall M, Estes L, De Bie C, Chang L, Nelson A. 2023. Cropland mapping in tropical smallholder systems with seasonally stratified sentinel-1 and sentinel-2 spectral and textural features. Remote Sens. 15(12):3014. doi: 10.3390/rs15123014.
- Vintrou E, Desbrosse A, Bégué A, Traoré S, Baron C, Seen DL. 2012. Crop area mapping in West Africa using landscape stratification of modis time series and comparison with existing global land products. Int J Appl Earth Obs Geoinf. 14(1):83–93. doi: 10.1016/j.jag.2011.06.010.
- Wang J-Y, Cai Z-W, Wang W-J, Wei H-D, Wang C, Li Z-X, Li X-N, Hu Q. 2023. Integrating multi-source gaofen images and object-based methods for crop type identification in South China. Scientia Agricultura Sinica. 56(13):2474–2490.
- Wang W, Tang J, Zhang N, Xu X, Zhang A, Wang Y. 2022. Automated detection method to extract pedicularis based on UAV images. Drones. 6(12):399. doi: 10.3390/drones6120399.
- Wang X, Qiu P, Li Y, Cha MX. 2019. Crops identification in kaikong river basin of xinjiang based on time series landsat remote sensing images. Trans Chin Soc Agric Eng. 35:180–188.
- Yan X, Qigang J, Bin W, Yuanhua L, Shu L, Can C. 2016. Object based land-use classification based on hybrid feature selection method of combining relief f and pso. Transact Chinese Soc Agricultural Engin (Transactions of the CSAE). 32(4):211–216.
- Yanan S, Xianyue L, Haibin S. 2021. Classification of land use in hetao irrigation district of inner mongolia using feature optimal decision trees. Transact Chinese Soc Agricultural Engin (Transactions of the CSAE). 37(13):242–251.
- Zualkernan I, Abuhani DA, Hussain MH, Khan J, Elmohandes M. 2023. Machine learning for precision agriculture using imagery from unmanned aerial vehicles (UAVs): A survey. Drones. 7(6):382. doi: 10.3390/drones7060382.