
 ?Mathematical formulae have been encoded as MathML and are displayed in this HTML version using MathJax in order to improve their display. Uncheck the box to turn MathJax off. This feature requires Javascript. Click on a formula to zoom.
Abstract
The extraction of urban road features provides indispensable support to numerous high-accurate applications such as autonomous driving and urban high-definition mapping. However, approaches mainly focus on road connectivity, while often overlooking finer details of urban road constituent structures. Data that captures road details, such as LiDAR, may not be always readily available. This article proposes an operational framework for mapping fine-grained urban road features by integrating open-source data (OSD). The geometric measurement method is successively presented using projective geometry and prior knowledge for urban road sections. And a feature generation strategy is introduced to achieve and express the fine-grained road features. Compared with the corresponding large-scale topographic map (LTM) and available optical remote sensing image (AORSI), the proposed method regenerated fine-grained features of urban roads with m-level. It provides a cost-effective innovative and alternative method to acquiring fine-grained road datasets in other data-scarce regions.
1. Introduction
Urban road features are the digital expression of urban road function components and the key to analyzing and reconstructing urban road networks. The high-precision and fine-grained extraction of urban road features can provide a data basis for the accurate modelling of urban terrain (Yang et al. Citation2020), the high-precision expression of urban maps (Tao, Zhang, et al. Citation2020; Kong et al. Citation2023), autonomous driving (Bao et al. Citation2021) and traffic safety (Hu et al. Citation2020).
Various techniques have been employed to extract urban road information and have yielded relatively satisfactory results based on optical remote sensing (ORS) data (Chen et al. Citation2022; Hu et al. Citation2023; Qiu et al. Citation2023), especially very high resolution (VHR) images (Guan et al. Citation2022; Shao et al. Citation2021; Yang et al. Citation2019; Zhou et al. Citation2022). However, the accuracy of road boundary, the connectivity of road surface and granularity of urban road features extraction need to be further improved due to tree occlusion, building shadows, weather (such as cloud) conditions, data resolution and other constraints (Lian et al. Citation2020; Chen et al. Citation2022; Zhou et al. Citation2022; Lu et al. Citation2022; Shao et al. Citation2021). Furthermore, much of the current research have centred on individual road network components, such as road centrelines or road surfaces. Although several studies have successfully mapped various road elements using ORS (Verma et al. Citation2021; Lu et al. Citation2022), some aspects remain unexplored. For instance, while Lu et al. (Citation2022) addressed road connectivity from the perspective of road centrelines, boundaries and road surface, they did not delve into finer subdivision elements or features. Similarly, Verma et al. (Citation2021) relied on an existing urban road feature database within a limited experimental area, which has not been extensively constructed.
Advancements in near-ground acquisition technology have enabled vehicle-mounted and hand-held LiDAR systems to capture more intricate urban road details. The extraction of road elements from near-ground LiDAR data encompasses not only road edges, and centrelines but also identification lines and road ridges (Lv et al. Citation2019; Yang et al. Citation2012; Xu et al. Citation2017; Fang et al. Citation2022). LiDAR points offer the potential for extracting finely detailed and refined objects, but the research efforts have predominantly centred on the road-related objects like roadway or single elements such as road marking lines, centrelines or road boundaries. As a crucial component of urban landscapes, isolation zones play pivotal roles in confluence, urban traffic and so on, yet they have received relatively limited attention and remain underexplored. Furthermore, the acquisition of LiDAR data through hand-held devices or unmanned aerial vehicles (UAVs) comes with substantial costs, large data volumes and complex data processing. Aviation regulations restrict their application in larger or more diverse urban research areas. In addition to better extraction from single data resources, the multisource fusion and complementary advantages of various data are also one of the issues that researchers focus on. However, within the realm of urban road information extraction, there is a noticeable gap in dissecting urban road elements and features based on urban topography and road functional structure and conducting fine-grained information extraction.
Open-source data (OSD), such as street view images (SVIs) and open street map (OSM), have emerged as a focal point in research due to their extensive coverage, easy accessibility and low cost (Rzotkiewicz et al. Citation2018, Biljecki and Ito Citation2021). These datasets offer a wealth of geometric and geographic information, including location, spatial relationship or scene information, along with various attribute details which can serve as a valuable resource for urban road feature extraction. SVIs, in particular, offer a side view of street landscapes from a human-level perspective (Zhang et al. Citation2024), providing a promising solution to challenges posed by building and vegetation obstructions, while presenting a significant opportunity to keep maps updated (Biljecki and Ito Citation2021). Studies have endeavoured to extract road-related information, like active mobility (Yap et al. Citation2023), road spatial comfort (Yang et al. Citation2021), road surface segmentation (Cai et al. Citation2024; Latsaheb et al.Citation2024) and traffic marking signals or lines recognition (Campbell et al. Citation2019; Lu et al. Citation2018; Tian et al. Citation2017; Zhang et al. Citation2022), from SVIs. However, most of this research has been confined to extracting or segmenting localized roadway information from individual SVIs, and the extracted information still stays in the image space (Gong et al.Citation2019). Some have begun to noticed the necessity of converting this data into vector maps enriched with geographic information to facilitate road navigation and traffic applications. But transforming the information extracted from side views into top-down perspectives and accurate mapping remains a challenge due to the unique nature of image acquisition (Xiao et al. Citation2023 Shi et al.Citation2022; Yang et al. Citation2023). OSM is heralded as ushering in a new era of geographic information (Goodchild, Citation2009; Meijer et al. Citation2018). It is widely used in urban and road related fields (Xu et al.Citation2023; Wu et al. Citation2019; Yang et al. Citation2022; Alghanim et al. Citation2021). While the road network that from OSM includes skeleton lines, road grades and road names, it falls short in conveying the intricate layout structure of the urban road. Leveraging deep learning method, the lane-level roadway has successfully extracted demonstrating the potential of road features extraction based on SVIs and OSM (Yang et al. Citation2023). However, certain aspects, such as the cycle lane, intersections and the separation zone, have not been addressed. There is room for improvement in representing road features. Available optical remote sensing images (AORSIs) with red green and blue (RGB) bands from open platforms such as Amap, Baidu or Google provide robust support for road information extraction. Despite the wide coverage and low-cost of AORSIs, challenges exist in terms of obstruction and incomplete information extraction. For instance, the boundary of the roadway and the median strip obtained based on AORSIs, due to the occlusion of trees, are deviating from their actual boundaries. Presently, we are contemplating the possibility of integrating the three data sources – SVIs, OSM and AORSIs – to harness their respective strengths, with the aim of creating cost-effective, city-scale, fine-grained and editable urban road full-feature maps.
To address the challenges mentioned above, the article proposed a novel operational framework. If the framework proves feasible, it could offer an effective alternative solution for the construction and regeneration of urban road features. The main contribution of this article is presented as follows:
The concept of road full-feature is introduced and further developed into expressible structures from the perspective of urban road functional structure and urban surface morphology.
An operational framework for fine-grained and full-feature extraction of urban roads was proposed, which provides a new sight for fine-grained extraction of urban roads based on open -source data.
Projective geometry principle and urban road design knowledge are introduced and integrated to realize the geometric measurement and regeneration of road features.
The rest of this article is organized as follows. Methods and materials are described in Section 2. Section 3 provides the experimental results and analysis, Finally, discussion and conclusions are made respectively in Sections 4 and 5.
2. Materials and methods
2.1. Definition and regeneration framework of urban road features
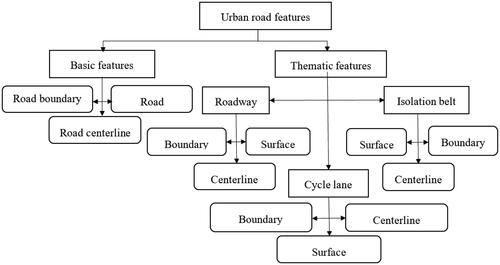
Urban roads, as integral components of complex urban terrain, exhibit distinct object characteristics (Yang et al. Citation2017). Full-feature of urban road is defined as objects that can form the surface topography of urban roads from the perspective of urban terrain (Ministry of Housing and Urban Rural Development of China Citation2012; Tao, Wang, et al. Citation2020), including urban roadway, cycle lane, sidewalk, median strip, separation belts between roadways and cycle lanes, and green belts or nature strips between cycle lanes and sidewalks. The cross section schematic diagram of the four-layout urban road is depicted in . In many urban settings, sidewalks are often coplanar with residential and commercial areas. In order to make the topic more clear, sidewalks are not considered in this article. The full-features of urban road in this artice are mainly divided into two groups: basic features and thematic features (). Thematic elements include roadway, cycle lane and isolation belt, with the isolation belt referring to the median strip and separation belt. These urban road features can be represented as points, lines and surfaces. The article omits the discussion of point-based structures since the focus is on regenerating a full-feature road map.
Figure 1. Typical cross section of a four-layout urban road.
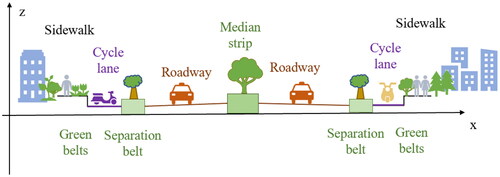
Figure 2. Structure of urban road features.
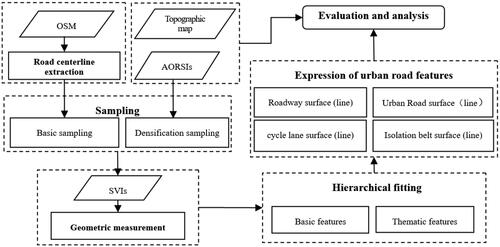
To solve the occlusion problem and data acquisition difficulties mentioned in the introduction, OSD is used to break through from the side-view. The information is transformed from image space to map space through the combination of projective geometry principle and OSM. On the basis of definition of the urban road features composition, separate encryption sampling and fitting are carried out on the isolation belt and the intersections in order to complete the regeneration of the fine-grained urban road features. On the basis of maintaining road connectivity (road surface or centreline), this article focuses more on the components of the urban road. The technical route is shown in . First, the centreline of the road is extracted and the points where the SVIs retrieved is obtained by sampling. Second, the projective geometry principle method and prior knowledge are combined and integrated to obtain the width of road features based on SVIs. Then the basic feature and thematic features are reconstructed and expressed by like least squares fitting method and geographic information expression method. The results are evaluated and analysed using topographic map and AORSIs.
Figure 3. Flowchart of the proposed approach.
2.2. Experimental areas and data
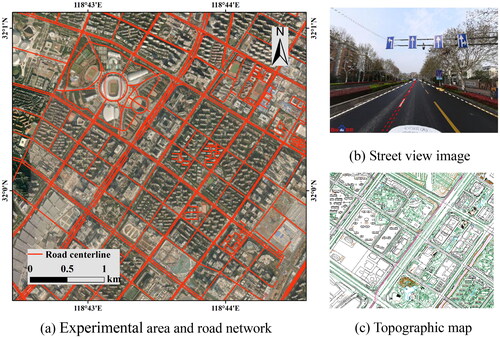
The experimental area of this research is located in Jianye District of Nanjing city, Jiangsu Province in China. The expressway or trunk, primary roads, secondary roads and branch roads are presented in this study area. The road type is rich and the road structure is diverse, which meets the requirement of the validity verification of the method in this article.
SVIs, road network from OSM, AORSIs and large-scale topographic maps (LTMs) are utilized in this article (). The main research object is high-level urban roads with regular and interconnected characteristics in this article, so the road network is simplified, and the stairs, sidewalks, branch roads to housing, residential roads and unclassified roads are deleted according to the road attribute information. SVIs are downloaded from Baidu according to the coordinates of sampling points. The vertical angle of view at each sampling point is 0° and the heading value is consistent with the road direction, so as to ensure that the road scene can be obtained more comprehensively from the vehicle driving view. At the same time, the road scene in SVI should not be covered by vehicles and the identification line on the road should be clear. The AORSIs come from the Amap platform, with a resolution of 0.59 m, including the RGB bands. The higher resolution is convenient for the extraction of green isolation belt. The 1:1000 LTM data of the Jianye District is used as the reference data for accuracy evaluation.
Figure 4. Experimental area and data.
2.3. Road centreline extraction and sampling
The article adopted an automatic extraction method of road centrelines based on the idea of gridding: (1) Screening. In this article, the high-level road network in the experimental area is selected as the experimental road according to the description in Section 2.2. (2) Rasterization. Set a certain grid resolution to convert the road network acquired in the previous step into grid data. (3) Cavity filling. Due to the ‘one to many’ phenomenon of the road network, the converted grid data have gaps between the reverse of the same road, as well as at the intersection of the road, so it is necessary to set a certain threshold to fill it. (4) Data vectorization. Based on the filled grid data, the middle position of the grid area is automatically found and vectorized to obtain the simplified road line, namely, the road centreline.
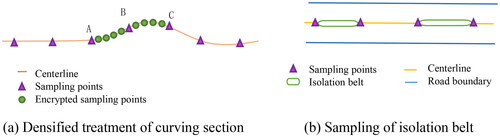
Setting sampling points along the centreline to get the coordinates is the premise of obtaining the street view image at the corresponding points. Here, two sampling methods are combined, one is equidistant sampling for roadway and the other is thematic sampling for fine-grained features. First, according to reference literature (Yang et al. Citation2021,Citation2023) and considering the efficiency, the equidistant sampling distance is set to 100 m. If there is a curved section or intersections, the sampling points are added at 20 or 5 m intervals (). While the isolation belt of urban roads is mainly filled with evergreen vegetation usually, so thematic feature sampling can be transformed into AORSI-based sampling of the isolation belt ends. In this article, the vegetation on the road surface is extracted using remote sensing classification and mathematical morphology methods (Sun Citation2013; Lin and Zhang Citation2017). The vegetation line of the isolation belt is obtained by using the method of gridding and the endpoint of the vegetation line is extracted. Finally, the endpoint is mapped to the road centreline by using the shortest distance principle so that the sampling points at the end of the isolation belt are obtained (). It should be noted that most of the isolated ends on the left and right sides of the road will be symmetrical according to the centreline, so it is necessary to delete the repeated map points.
Figure 5. Sampling approach of urban road features.
2.4. Geometric measurement
It can be seen from the projective geometry that a group of lines parallel in real space are no longer parallel but converge at the vanishing point(red or white dash line in . There is only one vanishing line in a plane, which is connected by all vanishing points. The calculation formula of the vanishing point and vanishing line is EquationEquation (1)(1)
(1) .
(1)
(1)
where L1 and L2 represent two parallel lines intersecting after being photographed. P1 and P2 represent two vanishing points in the photographic plane, P represents the vanishing point converging with parallel lines, and L represents the vanishing line formed by the vanishing point.
Given the length of the reference line in the image, according to the formula in literature (Liu et al. Citation2011; Deng et al. Citation2021), the distance between two points that are collinear with the reference line and any two points that are parallel to the reference line can be calculated. As shown in , O is the photography centre, M is the real space point, m is the corresponding point of M in the image, the cross-ratio of four points of m is cr1, the vanishing point of the four points is p, d (Mi, Mj) is the distance between two points in the space, and d(mi, mj) represents the distance between two points on the image. Given that the length of reference lines M1 and M2 is d, the distance between M1 and M3 in reality and the distance between M3 and M4 are calculated as shown in EquationEquations (2)(2)
(2) and Equation(3)
(3)
(3) .
(2)
(2)
(3)
(3)
Figure 6. Principle of geometric measurement.
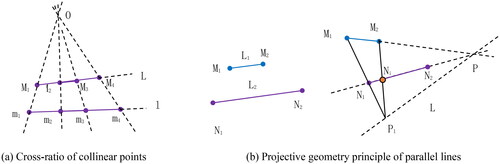
When the reference line is parallel to the line segment (), first, the vanishing point and the vanishing line are determined. The straight line formed by M1 and N1 in the figure intersects with the vanishing line at point P1, and line M2P1 must intersect line N1N2 or its extension line at point Ni. In addition, M1N1 and M2Ni are parallel, and the lengths of these two line segments are equal. Thus, the parallel reference lines can be transformed into collinear reference lines, and the widths of any two collinear points can be calculated by EquationEquations (2)(2)
(2) and Equation(3)
(3)
(3) .
In essence, SVI is a local photo taken by a camera, so the geometric relationship of the objects in the image conforms to the mapping geometry rules. At the same time, the width of the road marking line is clearly specified in the road design code, which can be used as the measurement reference line. Therefore, this study uses the above principle to implement one-way road geometry measurement by programming the road marking line as the reference line. Due to the view of SVI and the characteristics of the isolation belt, it is difficult to measure the separation belts, so the measurement is only carried out at the endpoint and the part of the width change; the other parts are treated as the same width.
2.5. Fitting and expression of road features
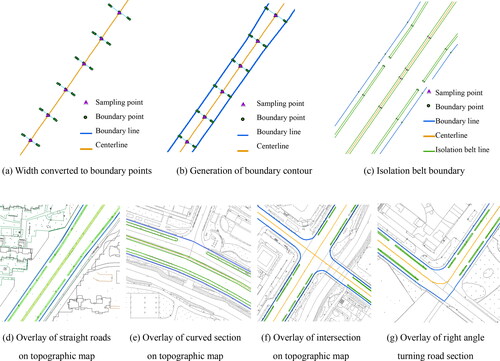
In this article, we introduced a boundary fitting method that takes into account the dual constraints of the road to generate the urban road boundary line, as outlined by Yang et al. (Citation2023). But the method of isolation belt fitting has been modified. In addition to the two sides of the boundary lines, the shape of the two ends of the isolation belt also needs to be classified and expressed according to the actual situation. Following field surveys and observations, we have identified two main shapes for the ends of the isolation belt: arc-shaped and straight-line shaped (with a 90° corner angle). In this article, the shape is assessed and attributed based on AORSI and SVIs nearing the sampling points. As shown in , if the isolation belt exhibits an arc shape, its width is taken as the arc diameter. Conversely, for straight-line shaped isolation belts, the two sides are directly connected when the boundary shape of the isolation belt is fitted.
Figure 7. Fitting of road features.
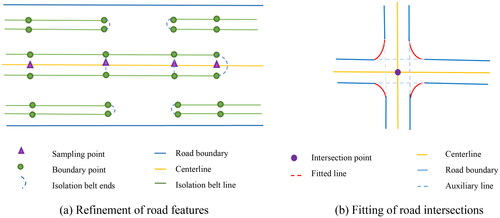
It is important to note that the sampling method or the insufficient SVIs data may result in the occurrence of vertical crossing phenomenon in intersections, as illustrated by the blue dashed line of , which could not reflect the real configuration of urban road. To supplement or improve this deficiency, curve fitting method for road intersections is carried out by taking the triangle of sight distance and the minimum stopping sight distance as constraints based on the specification for design of intersections on urban road (CJJ 152-2010) (Ministry of Housing and Urban Rural Development of China Citation2010).
2.6. Accuracy assessment
To estimate the accuracy of regenerated road widths, we employed the Bias, deviation value (DV), mean absolute error (MAE), standard deviation (STD) and root mean square error (RMSE):
(4)
(4)
(5)
(5)
(6)
(6)
(7)
(7)
(8)
(8)
where x represents the width measured by this method at the test point, y represents the reference true value at this location,
represent the average of x.
In addition, accuracy (ACC), recall, dice and specificity are adopted to evaluate the performance of the method (EquationEquations 9–12). Where TP is true positives, which means that the predicted sample is positive and the actual sample is positive. FP is false positives, which means the predicted positive sample is actually a negative sample. TN stands for true negative, indicating that both the predicted and actual samples are negative. FN is a false negative, it represents that a positive sample is predicted to be a negative sample.
(9)
(9)
(10)
(10)
(11)
(11)
(12)
(12)
3. Results and analysis
3.1. Road centreline and sampling points
After experiments and analyses, the road centreline in the experimental area is extracted () according to the method proposed in 2.3 with the grid resolution and grid filling size is set to 5 m. illustrates the effectiveness of the simplified method, which solves the ‘one-to-many’ phenomenon presented in the original road network data (), and the extracted centreline preserves the original shape of the urban road.
Figure 8. Extraction of road centreline and sampling results.
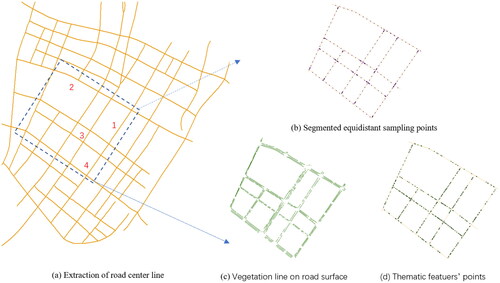
shows the data of segmented and equidistant sampling points along road centrelines and intersections, which control the overall distribution properties of the road network. Considering that the width of the separation zone is generally narrow, and the extraction accuracy is pre-controlled at the meter level, the grid resolution is set to 0.5 m when extracting the vegetation line. In some cases, the mapped ends points of some isolation belts are very close together. The deletion of the short-distance points is required after deletion of the duplicate points to reduce calculation. The distance threshold of 5 m has been established based on both the real-world observations and experimental data. It is worth noting that the near points here include both the points of the isolation belt and those adjacent to the equidistant sampling points. Based on the ENVI and ArcGIS software platforms, thematic feature sampling is realized in this article. It can be seen from that the isolation belt information in the road area can be better obtained through the AORSIs.
3.2. Results of width measurement
According to the Code for Layout of Urban Traffic Signs and Markings (GB51038-2015) (Ministry of Housing and Urban Rural Development & General Administration of Quality Supervision Citation2015), the width of the dividing line that can be crossed in the same direction roadway (with a speed greater than 60 km/h) is 15 cm, and the width of the dividing line is 10 cm when the speed of vehicle is less than 60 km/h. The width of the white dividing line on a main road in the experimental area is 14.92 cm by field measurement, which closely approximates these standard dimensions. Therefore, taking the road traffic dividing line as reference, this study calculates the width of the urban road features according to the abovementioned method in Section 2.4. Taking section NO.1 in as an example, the geometric width of the measured road features is defined as the width-SVI at the sampling point, and the value of the width in the LTM (Width-LTM) is defined as reference true value. shows that the minimum absolute DV value of the one-way roadway width is 0.08 m, the maximum value is 0.31 m, the MAE is 0.17 m and the RMSE is 0.18 m. The maximum DV of the whole urban road surface width is 0.47 m, the bias is −0.10 m and the RMSE is 0.30 m. The cycle lane and the separation zone have higher RMSE values than roadway and median strip. The geometric measurement width of each element of the urban road is basically similar to the reference true value and the method can effectively measure the width of the urban roads.
Table 1. Width measurement and error statistic of the No.1 road.
3.4. Regeneration and accuracy evaluation
Taking the road of No.1 in as an example, the extraction results of road boundary points are shown in . Each boundary point has type attribute and location attribute. The type attribute is the feature type of the boundary point, and the location attribute is the position relative to the starting and ending direction of the centreline, which is assigned to the left or right, respectively. For example, the left boundary point attribute of the median strip is left 1, the left boundary point attribute of the separation zone is left 2 and left 3, and the attribute of the road boundary point to the left of the centreline is left 4. In this article, the location and type attribute information of the points are used to fit the road segments and the thematic elements of the isolation belt. The results are shown in . It can be seen that the overall shape and relative position of the urban road boundary and road isolation belt conform to the urban road design specifications. In addition, this article extracts the boundary line of typical road sections, such as curved road sections, right-angle turning road sections and intersections, and the extraction results of positions No. 1 to No. 4 in are shown in . Note that the right-angle corner part is designed to verify the experiment, which is actually a ‘T-shaped’ intersection under construction.
Figure 9. Results of road feature delineation. Blue is the boundary line of urban road, orange is the centreline, and green is the boundary line of isolation belt.
To evaluate the extraction results of typical urban road sections, this article analyses the vector line of the urban road feature boundary with a reference LTM (). The overall shape and trend of the road elements extracted in this article are basically correct, the integrity of the elements is good, and the local area can be well overlapped with the LTM reference truth data.
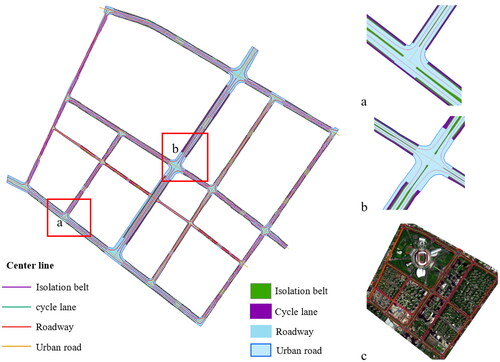
The regeneration results of urban road features are shown in . The surface can be generated by the boundary line, and considering the simplicity of the drawing, only the surface and centerline of the basic and thematic features are displayed in the resulting figure. shows that the method in this article can extract the urban road surface or line, roadway surface (line), cycle lane surface (line) and regular isolation belt surface (line) well. shows that the regenerated urban road features are in good agreement with the AORSI, in which red is the road boundary and green is the isolation belt boundary.
Figure 10. Extraction results of road feature.
Urban roads are divided into left and right directions by the road centreline or median strip, which are called roadway-left and roadway-right, respectively, in this article. The distance between the edges of urban road is called UR-width. From the perspective of quantitative analysis, the regeneration accuracy of urban road in 112 randomly generated test points is analysed. the maximum deviation distance between the width extracted in this article (Width-SVI) and the reference truth value (Width-LTM) is 1.29 m. The large width deviation of a single verification point may be due to the lack of a clear road boundary of the corresponding SVI. shows that The Bias of roadway is −0.08 and −0.07 m respectively, and the RMSE are 0.35 m in left and 0.40 m in right. The Bias of the UR-width is −0.05 m, MAE is 0.42 m and the RMSE is 0.52 m.
Table 2. Accuracy statistics table of urban road.
4. Discussion
4.1. Accuracy comparison and analysis
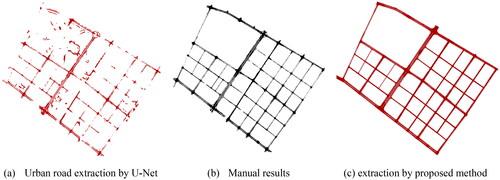
To verify the effectiveness of the method, this article extracted urban roads by a DL method (Zhang et al. Citation2018; Yang et al. Citation2019). The U-Net model is used for training with 65 training images, 21 verification images and 64 test images. The initial learning rate is 0.001, the training time is 1000, the image segmentation size is 800 * 800, and the area under curve (AUC) value of the training model is 0.93. The extraction result of the experimental area is shown in and is the manual marking result for precision detection. In order to facilitate comparison, roads except those inside residential areas are extracted in study area by OSD-based method, and only road surfaces without isolation belts are shown (. shows that the U-Net-based method can extract the urban road and can reflect the details of intersections, especially large intersections. However, road breaks and incomplete boundaries appeared. One of the possible reasons is that the AOSRIs were used with three bands, and there are shadows and vegetation occlusions in the image, which results in the same object and different spectrum. Moreover, the extraction method based on AORSIs is greatly affected by the time and phase of data acquisition, and there are still challenges in extracting roads when the street trees and vegetation are dense and heavily covered. In addition, the U-Net-based method will extract some roads in the residential areas. These need to be edited according to the reference data (open source road network, established regional road surface or line, etc.) to obtain a targeted extraction. shows that the urban road extracted based on OSD method has good geometric shape and no phenomena such as fractures, connectivity problem and unclear boundaries.
Figure 11. Methods comparison.
In addition, the recall rate, specificity index, accuracy and dice coefficient of the two methods are calculated. shows that the specificity values of the results obtained by the proposed method (OSD-based) and U-Net methods are 0.95 and 0.98, the accuracy is relatively high, which is 0.95 and 0.96, respectively. The recall rate of the OSD-based is 0.90, which is far greater than U-Net. But the dice coefficient is relatively smaller. It may be caused by occlusions, shadows and spectral heterogeneity in the image and the inconsistency of the grade of the road. The efficiency of the two method is roughly compared for the key part, and it is found that the method proposed in this article does not show obvious superiority. However, it is only a rough comparison and does not include the time consumed by the previous data preparation, work of sampling, make training labels and model training, and the uncertainty is not included. In addition, this article emphasizes the feasibility of the proposed framework, detailed efficiency analysis is temporarily out of the scope of this article. In the next step, we will focus on analyzing and improving the efficiency of the proposed method.
Table 3. Accuracy comparison.
4.2. Fineness comparison and analysis
Existing researches on urban roads based on SVIs mainly focuses on road scene segmentation and re-analysis after segmentation (Gong et al. Citation2019; Yang et al. Citation2021). The road surface or road boundary is not converted into editable Geo-space data, which increases the difficulty of data application and spatial analysis. A few studies combined SVIs with other image data for road extraction (Cao et al. Citation2018), but like previous studies, these studies’ main concern is specific road features, such as an urban road surface or edge (Lu et al. Citation2022; Liu et al. Citation2022), centreline (Hui et al. Citation2016; Xu et al. Citation2023), or green vegetation belt (Li et al. Citation2020), or sidewalk (Ning et al. Citation2022). They did not extract full-features of urban road from the perspective of terrain and road functional structure. Verma et al. (Citation2021) carried out thematic feature extraction, such as roadway and cycle lane. But the study relied heavily on a database of experimental areas. The article performs a comparative analysis from the perspective of the refinement degree (the extraction of road object units). shows the results comparison of the extraction granularity of each method. It can be seen that the urban road features extracted by the above methods are relatively singular, and the degree of refinement is not adequate. The proposed method in this article can regenerate urban road features in a fine-grained way with low cost.
Table 4. Comparison of the refinement degree of urban road element extraction.
4.3. Shortcomings and limitations
The article implements the refined extraction of urban road features using SVIs, OSM and AORSIs, under the assumption that there will be no abrupt change in the shape and width of urban roads. However, there are some limitations as follows: (1) The grid resolution, grid filling size, as well as sampling distance and other parameters involved in data preprocessing are set according to relevant references and experimental judgment. (2) Road intersections are complex structures accommodating pedestrians, bicycles, motor vehicles. When reconstructing the cycle lane in this article, its endpoint at the intersection is consistent with the separation zone. In order to simplify the work, this article assumes that the isolation zone is equal width, which is not in line with reality. Further refinement of intersections and isolation zones is required in the future.
The data used in this article are OSDs including SVI, OSM and AORSI, the framework proposed in this article can be applied to other cities as long as it is covered by OSM and SVI data. Geometric measurement and the regeneration results depend on the quality of SVIs and OSM data. Although its pre-processing has been mentioned in Section 2.2, it is still necessary to emphasize that SVI needs to be clear, and the road surface is better with little or no vehicle occlusion, and the quality evaluation and correction of the road centreline obtained by OSM will improve the accuracy of the results. The purpose of LTM is to evaluate and verify the accuracy of the results. If the LTM is not available in many cities, field survey and ORS image overlay can be used instead. The use of AORSI is to obtain the isolation information and encrypt the sampling. The higher the resolution of the data, the better. If it is difficult to obtain AORSI in some areas, it can be replaced by encrypted sampling the centreline, although this substitution will increase the workload of data processing. It is worth pointing out that when the width is measured in this article, the reference is the road marking line. If the method proposed in this article is used in other places such as foreign countries, it is necessary to pay attention to whether the width of the marking line is changed. The width of the capturing vehicle can serve as a benchmark if it is present in every image.
5. Conclusion
The article proposed a framework for regenerating the urban road features based on SVIs, road network from OSM and AORSIs. The urban road features were generated by rasterization centreline extraction, features sampling, road width measurement and constraints fitting methods. LTM and AORSIs were used to analyses and evaluates the results. The experimental results show that the proposed method can effectively construct urban road features including roadways, cycle lanes and isolation belts. The boundary of urban road features is consistent with the AORSIs with the correct geometry, and the width RMSE is less than 0.57 m. The regeneration accuracy can be comparable to the extraction effect of U-Net with the recall value is 0.9 and the accuracy is 0.95.
This article emphasized the feasibility of alternative regeneration of urban road features, and proved the ability of OSD in urban road feature extraction. Although OSD, especially SVI, still has challenges and uncertainties such as inconsistent data quality and heterogeneous spatial information, it can provide a new idea for road information extraction. Driven by data, fine-grained and multi-modal urban road information, especially road scene information, is the focus of urban research, urban intelligence research and human-city interaction research. The method proposed in this article can provide reference and alternative solution for fine-grained and high-precision information extraction of urban geographic scenes, wide application of OSD and high-precision representation of urban maps. In the future, it is necessary to further explore the expression and simulation methods of human–city interaction based on the reconstruction of urban road features.
Author contributions
Data curation and Methodology, K.D., M.Z and C.Y.; Writing-Original draft K.D.; Visualization and Investigation, K. D.; Writing- Reviewing & Editing, W.L., C.Y., and M.Z.; All authors have read and agreed to the published version of the manuscript.
Disclosure statement
No potential conflict of interest was reported by the authors.
Data availability statement
We would like to thank to OpenStreetMap (https://www.openstreetmap.org) for road network and Baidu (https://lbsyun.baidu.com/) for street view images. We are also thankful to the Amap (https://lbs.amap.com/) and Bigmap (http://www.bigemap.com/) for providing us the AORSIs data. Due to confidentiality agreements, the 1:1000 large scale topographic map data can only be made available to bona fide researchers subject to a nondisclosure agreement. Details of the data and how to request access are available from authors.
Additional information
Funding
References
- Alghanim A, Jilani M, Bertolotto M, McArdle G. 2021. Leveraging road characteristics and contributor behaviour for assessing road type quality in OSM. IJGI. 10(7):436. doi: 10.3390/ijgi10070436.
- Bao Z, Hossain S, Lang H, Lin X. (2023). A review of high-definition map creation methods for autonomous driving. Eng. Appl. Artif. Intell., 122, 106125. Doi:10.1016/j.engappai.2023.106125
- Biljecki F, Ito K. 2021. Street view imagery in urban analytics and GIS: a review. Landsc Urban Plan. 215:104217. doi: 10.1016/j.landurbplan.2021.104217.
- Cai S, Wakaki R, Nobuhara S, Nishino K. 2024. RGB road scene material segmentation. Image Vis Comput. 145:104970. doi: 10.1016/j.imavis.2024.104970.
- Campbell A, Both A, Sun Q. 2019. Detecting and mapping traffic signs from google street view images using deep learning and GIS. Comput Environ Urban Syst. 77:101350. doi: 10.1016/j.compenvurbsys.2019.101350.
- Cao R, Zhu J, Tu W, Li Q, Cao J, Liu B, Zhang Q, Qiu G. 2018. Integrating aerial and street view images for urban land use classification. Remote Sens. 10(10):1553. doi: 10.3390/rs10101553.
- Chen X, Sun Q, Guo W, Qiu C, Yu A. 2022. GA-Net: a geometry prior assisted neural network for road extraction. Int J Appl Earth Observ. 114:103004. doi: 10.1016/j.jag.2022.103004.
- Deng K, Yang C, Yin L, Zhao M, Jiang L, Peng D. 2021. Urban road extraction based on multi-source data. Bull Surv Map. 2021(10):60–66 + 82. doi: 10.13474/j.cnki.11-2246.2021.306.
- Fang L, Sun T, Wang S, Fan H, Li J. 2022. A graph attention network for road marking classification from mobile LiDAR point clouds. Int J Appl Earth Obs Geoinformation. 108:102735. doi: 10.1016/j.jag.2022.102735.
- Gong Z, Ma Q, Kan C, Qi Q. 2019. Classifying street spaces with street view images for a spatial indicator of urban functions. Sustainability. 11(22):6424. doi: 10.3390/su11226424.
- Goodchild M. 2009. NeoGeography and the nature of geographic expertise. J Loca Based Serv. 3(2):82–96. doi: 10.1080/17489720902950374.
- Guan H, Lei X, Yu Y, Zhao H, Peng D, Junior JM, Li J. 2022. Road marking extraction in UAV imagery using attentive capsule feature pyramid network. Int. J. Appl. Earth Obs. Geoinformation, 107,102677. doi:10.1016/j.jag.2022.102677.
- Hu L, Wu X, Huang J, Peng Y, Liu W. 2020. Investigation of clusters and injuries in pedestrian crashes using GIS in Changsha, China. Saf Sci. 127:104710. doi: 10.1016/j.ssci.2020.104710.
- Hu P, Chen S, Huang L, Wang G, Tang J, Luo B. 2023. Road extraction by multiscale deformable transformer from remote sensing images. IEEE Geosci Remote Sens Lett. 20:1–5. doi: 10.1109/LGRS.2023.3299985.
- Hui Z, Hu Y, Jin S, Yevenyo YZ. 2016. Road centerline extraction from airborne LiDAR point cloud based on hierarchical fusion and optimization. ISPRS J Photogramm Remote Sens. 118:22–36. doi: 10.1016/j.isprsjprs.2016.04.003.
- Kong Y, Wu H, Akram A, Li J, Zhao J, Wang S, Huang W, Liu C. 2023. UAV LiDAR data-based lane-level road network generation for urban scene HD maps. IEEE Geosci Remote Sens Lett. 20:1–5. doi: 10.1109/LGRS.2023.3308891.
- Latsaheb B, Sharma S, Hasija S. 2024. Semantic road segmentation using encoder-decoder architectures. Multimed Tools Appl. pp. 1-23, doi: 10.1007/s11042-024-19175-y.
- Li P, Li Y, Cai L, Dong Y, Fan H. 2020. Road green belt extraction and dynamic analysis based on vehicle LiDAR points cloud. J Geo-Inform Sci. 22(2):268–278. doi: 10.12082/dqxxkx.2020.190196.
- Lian R, Wang W, Mustafa N, Huang L. 2020. Road extraction methods in high-resolution remote sensing images: a comprehensive review. IEEE J Sel Top Appl Earth Observ Remote Sens. 13:5489–5507. doi: 10.1109/JSTARS.2020.3023549.
- Lin GX, Zhang JL. 2017. Object-based morphological building index for building extraction from high-resolution remote sensing imagery. Acta Geod Cartogr Sin. 46(6):724–733. doi: 10.11947/j.AGCS.2017.20170068.
- Liu D, Zhang J, Liu K, Zhang Y. 2022. Aerial remote sensing image cascaded road detection network based on edge sensing module and attention module. IEEE Geosci Remote Sens Lett. 19:6513605. doi: 10.1109/LGRS.2022.3190495.
- Liu L, Yang Z, Li G, Wang K, Chen T, Lin L. 2023. Aerial images meet crowdsourced trajectories: a new approach to robust road extraction. IEEE Trans Neural Netw Learning Syst. 34(7):3308–3322. doi: 10.1109/TNNLS.2022.3141821.
- Liu XJ, Wang MZ, Zhen Y, Lu Y. 2011. Geometric measurement based on single image: a survey. Geomat Inf Sci Wuhan Univ. 36(8):941–947. doi: 10.13203/j.whugis2011.08.003.
- Lu X, Zhong Y, Zheng Z, Chen Y, Ma A, Zhang L. 2022. Cascaded multi-task road extraction network for road surface, centerline, and edge extraction. IEEE Trans Geosci Remote Sens. 60:1–14. doi: 10.1109/TGRS.2022.3165817.
- Lu Y, Lu J, Zhang S, Hall P. 2018. Traffic signal detection and classification in street views using an attention model. Comp Visual Media. 4(3):253–266. doi: 10.1007/s41095-018-0116-x.
- Lv YL, Li YQ, Fan HL, Li PP. 2019. Research on road boundary extraction based on conjunction feature of vehicle-borne LiDAR point cloud. Geogr Geo-Inform Sci. 35(1):36–43. doi: 10.3969/J.issn.1672-0504.2019.01.005.
- Meijer JR, Huijbregts MAJ, Schotten KCGJ, Schipper AM. 2018. Global patterns of current and future road infrastructure. Environ Res Lett. 13(6):064006. doi: 10.1088/1748-9326/aabd42.
- Ministry of Housing and Urban Rural Development. 2010. Specification for design of intersections on urban roads (CJJ 152-2010). Beijing, China: China Building Industry Press.
- Ministry of Housing and Urban Rural Development. 2012. Code for design of urban road engineering (CJJ/37-2012). Beijing, China: China Architecture & Building Press.
- Ministry of Housing and Urban Rural Development, General Administration of Quality Supervision. 2015. Code for layout of urban traffic signs and markings (GB51038-2015). Beijing, China: China Planning Press.
- Ning H, Ye X, Chen Z, Liu T, Cao T. 2022. Sidewalk extraction using aerial and street view images. Environ Plann B Urban Anal City Sci. 49(1):7–22. doi: 10.1177/2399808321995817.
- Qiu L, Yu D, Zhang C, Zhang X. 2023. A semantics-geometry framework for road extraction from remote sensing images. IEEE Geosci Remote Sens Lett. 20:6004805. doi: 10.1109/LGRS.2023.3268647.
- Rzotkiewicz A, Pearson AL, Dougherty BV, Shortridge A, Wilson N. 2018. Systematic review of the use of google street view in health research: major themes, strengths, weaknesses and possibilities for future research. Health Place. 52:240–246. doi: 10.1016/j.healthplace.2018.07.001.
- Shao Z, Zhou Z, Huang X, Zhang Y. 2021. MRENet: simultaneous extraction of road surface and road centerline in complex urban scenes from very high-resolution images. Remote Sens. 13(2):239. doi: 10.3390/rs13020239.
- Shi J, Li G, Zhou L, Lu G. 2022. Lane-level road network construction based on street-view images. IEEE J Sel Top Appl Earth Observ Remote Sens. 15:4744–4754. doi: 10.1109/JSTARS.2022.3181464.
- Sun JB. 2013. Principles and applications of remote sensing. Wuhan, China: Wuhan University Press.
- Tao L, Zhang P, Yan L, Zhu D. 2020. Automatically building linking relations between lane-level map and commercial navigation map using topological networks matching. J Navigation. 73(5):1159–1178. doi: 10.1017/S0373463320000259.
- Tao Y, Wang C, Xu Y, Zhang Z, Song S, Yang W. 2020. Classification and expression of urban road from the perspective of DEM modeling. J Geo-Inf Sci. 22(8):1589–1596. doi: 10.12082/dqxxkx.2020.200004.
- Tian Y, Gelernter J, Wang X, Chen W, Gao J, Zhang Y, Li X. 2017. Lane marking detection via deep convolutional neural network. Neurocomputing (Amst). 280:46–55. doi: 10.1016/j.neucom.2017.09.098.
- Verma D, Mumm O, Carlow VM. 2021. Identifying streetscape features using VHR imagery and deep learning applications. Remote Sens. 13(17):3363. doi: 10.3390/rs13173363.
- Wu S, Du C, Chen H, Xu Y, Guo N, Jing N. 2019. Road extraction from very high resolution images using weakly labeled openstreetmap centerline. IJGI. 8(11):478. doi: 10.3390/ijgi8110478.
- Xiao X, Zhao Y, Zhang F, Luo B, Yu L, Chen B, Yang C. 2023. BASeg: Boundary aware semantic segmentation for autonomous driving. Neural Networks, 157,460–470. doi: 10.1016/j.neunet.2022.10.034
- Xu S, Wang R, Zheng H. 2017. Road curb extraction from mobile LiDAR point clouds. IEEE Trans Geosci Remote Sens. 55(2):996–1009. doi: 10.1109/TGRS.2016.2617819.
- Xu Q, Long C, Yu L, Zhang C. 2023. Road extraction with satellite images and partial road maps. IEEE Trans Geosci Remote Sens. 61:1–14. doi: 10.1109/TGRS.2023.3261332.
- Yap W, Chang JH, Biljecki F. 2023. Incorporating networks in semantic understanding of streetscapes: contextualising active mobility decisions. Environ Plan B Urban Anal City Sci. 50(6):1416–1437. doi: 10.1177/23998083221138832.
- Yang B, Fang L, Li Q, Li J. 2012. Automated extraction of road markings from mobile lidar point clouds. Photogramm Eng Remote Sens. 78(4):331–338. doi: 10.14358/PERS.78.4.331.
- Yang C, Jiang L, Chen X, Wang C, Zhao M. 2017. Classification and expression of urban topographic features for DEM construction. J Geo-Info Sci. 19(3):317–325. doi: 10.3724/SP.J.1047.2017.00317.
- Yang C, Zhao M, Wang C, Deng K, Jiang L, Xu Y. 2020. Urban road DEM construction based on geometric and semantic characteristics. Earth Sci Inform. 13(4):1369–1382. doi: 10.1007/s12145-020-00510-4.
- Yang C, Xu F, Jiang L, Wang R, Yin L, Zhao M, Zhang X. 2021. Approach to quantify spatial comfort of urban roads based on street view images. J Geo-Inf Sci. 23(5):785–801. doi: 10.12082/dqxxkx.2021.200353.
- Yang C, Ling J, Dai W, Peng D, Deng K, Zhao M, Huang X, Chen X. 2023. An operational framework for reconstructing lane-level road maps using open access data. IEEE J Sel Top Appl Earth Observ Remote Sens. 16:6671–6681. doi: 10.1109/JSTARS.2023.3296957.
- Yang L, Zhai J, Wang X. 2022. A graph-cut-based method for road labels making with OSM data. IEEE Geosci Remote Sens Lett. 19:1–5. doi: 10.1109/LGRS.2021.3135960.
- Yang X, Li X, Ye Y, Lau RYK, Zhang X, Huang X. 2019. Road detection and centerline extraction via deep recurrent convolutional neural network u-net. IEEE Trans Geosci Remote Sens. 57(9):7209–7220. doi: 10.1109/TGRS.2019.2912301.
- Zhang F, Salazar-Miranda A, Duarte F, Vale L, Hack G, Chen M, Liu Y, Batty M, Ratti C. 2024. Urban visual intelligence: studying cities with artificial intelligence and street-level imagery. Ann Am Assoc. 114(5):876–897. doi: 10.1080/24694452.2024.2313515.
- Zhang Y, Lu Z, Zhang X, Xue JH, Liao Q. 2022. Deep learning in lane marking detection: a survey. IEEE Trans Intell Transport Syst. 23(7):5976–5992. doi: 10.1109/TITS.2021.3070111.
- Zhang Z, Liu Q, Wang Y. 2018. Road extraction by deep residual u-net. IEEE Geosci Remote Sens Lett. 15:1–5. doi: 10.1109/LGRS.2018.2802944.
- Zhou G, Chen W, Gui Q, Li X, Wang L. 2022. Split depth-wise separable graph-convolution network for road extraction in complex environments from high-resolution remote-sensing images. IEEE Trans Geosci Remote Sens. 60:5614115. doi: 10.1109/TGRS.2021.3128033.