
 ?Mathematical formulae have been encoded as MathML and are displayed in this HTML version using MathJax in order to improve their display. Uncheck the box to turn MathJax off. This feature requires Javascript. Click on a formula to zoom.
Abstract
Recent advances in the application of spectral bands from satellite observations and machine learning algorithms (MLA) in the Google Earth Engine (GEE) cloud-computing platform have been demonstrated to enhance the accuracy of mapping forest resources. This study presents a novel method for mapping the natural distribution of highland bamboo (Oldeania alpina) using spectral bands and three machine learning algorithms, namely random forest, gradient tree boosting, and classification and regression tree. First, spectral bands, vegetation indices and textural features including contrast, entropy and inverse difference moment were derived from the Sentinel-2 elevation data. Second, observations were categorized as the dry season (December–February), short rainy season (March-May), main (long) rainy season (June-August), wet season (September–November) and annual composite. Third, the machine learning algorithms were tested using 1882 ground control points collected from field and high spatial resolution images. Finally, the best-performing machine learning algorithm was used to classify and map bamboo forests. The five land cover categories identified were bamboo stands, natural forest, other vegetation, non-vegetated areas and water bodies. The result shows that the random forest classifier is a robust algorithm with an overall accuracy of 94% considering all the annual composite’s spectral, vegetation and textural variables. The highland bamboo coverage (91 km2) in the Andracha district provided valuable insights. Bamboo stands were mostly distributed in the southern and southeastern parts of the district. Here, we show that image compositing and multiple input parameters using machine learning techniques can overcome challenges facing land cover classification, which can hinder accurate mapping of Afromontane forests. We conclude that the incorporation of vegetation indices and textural features in land cover classification increases accuracy of mapping natural highland bamboo coverage and distribution. The application of this new method is a promising prospect not only in Ethiopia but also in Afromontane forests elsewhere in Africa.
1. Introduction
Globally, bamboo forests are widely distributed in the tropical, subtropical and mild temperate regions of Asia, Africa, and Latin America (Liu et al. Citation2018; Nath et al. Citation2020). The total global area of bamboo forests is estimated at 30.5 million hectares or approximately 1% of the total global forest area (Du et al. Citation2018). In many countries, bamboos form cultural and ecological features where they provide environmental, social, and economic benefits (Clark et al. Citation2015; Nath et al. Citation2020). Bamboo forests also hold great potential for carbon sequestration and climate change mitigation (Nath et al. Citation2020). Highland bamboo (Oldeania alpina) is a key species in Africa. It occurs mostly on high mountain slopes at altitudes of 2000–4000 msl (Hall and Inada Citation2008), which are some of the most important water towers in Africa. In many places, it forms vast pure stands providing important habitats and food for wildlife on the high mountains of significant conservation status including Mt. Kivu in Zaire, the Virunga transboundary protected area covering the Democratic Republic of Congo, Uganda and Rwanda, the Aberdares and Mau ranges and Mt Kenya in Kenya, the highlands of Ethiopia, Mt Uluguru in Tanzania, Mt. Mulanje in Malawi, and Mt Cameroon in Cameroon (Hall and Inada Citation2008; Sheil et al. Citation2012; Stapleton Citation2013). Despite its importance, reliable and consistent data on the natural distribution of highland bamboo in Africa is limited, making it difficult to assess its abundance (Abebe et al. Citation2021). Timely mapping of the distribution of highland bamboo is critical for biodiversity conservation, resource management, policy-making for rural poverty reduction and to better estimate its contribution to climate change mitigation (Zhao et al. Citation2018). Due to its wide distribution, mapping highland bamboo by field surveys would be labour-intensive and time-consuming. Mapping the distribution of bamboo through remotely sensed data has also been difficult owing to spectral similarities to evergreen forests and other vegetation cover types (Zhao et al. Citation2018; Zhang et al. Citation2019).
The increased availability of improved methods of digital image processing, open-access satellite imagery and analysis tools and platforms for handling big data are opening new avenues for monitoring changes in vegetation dynamics, species distribution mapping and modelling (Turner et al. Citation2015). One of the recent geospatial data computing platforms with extensive applications and functionalities is the Google Earth Engine (GEE). GEE is a web-based planetary-scale computational platform with tools for analyzing and visualizing geospatial data (Gorelick et al. Citation2017; Kumar and Mutanga Citation2018; Venkatappa et al. Citation2020). From a data mining perspective, the use of all available satellite images can maximize the amount of good-quality observations for time series analysis at the pixel level (Zhang et al. Citation2019). GEE allows accessing multi-petabyte satellite images for a time series analysis in cloud-based platforms. As a result, global forest cover dynamics and land cover mapping can be implemented using image collections in GEE (Hansen et al. Citation2013; Venkatappa et al. Citation2019).
With the aid of GEE cloud computing technology, vegetation index threshold-based classification has increasingly gained attention for different applications in geospatial science (Venkatappa et al. Citation2019). Originally, scientists developed vegetation indices for qualitatively and quantitatively evaluating vegetative covers (Bannari et al. Citation1995; Gilabert et al. Citation2010). In addition, texture is one of the important characteristics used in identifying objects or regions of interest for land cover classification. Statistical texture analysis techniques primarily describe the texture of regions in an image through higher-order moments of their grayscale histograms (Tomita and Tsuji Citation2013). These techniques were recently found important for classifying bamboo forests (Qi et al. Citation2022).
In this study, we explored a novel method combining machine learning algorithms with the inclusion of vegetation indices and textural features and multi-date compositing imagery in GEE for mapping the distribution of natural highland bamboo in Ethiopia. The objective of the study was to map the natural distribution of highland bamboo in Southwest Ethiopia using a combination of machine learning based classification method and GEE. Highland bamboo was chosen because of its environmental, economic and social significance in the Afromontane forests of Africa in general and Ethiopia in particular (Grimshaw Citation1999; Kelbessa et al. Citation2000; Embaye Citation2003; Mekonnen et al. Citation2014; Mulatu et al. Citation2016; Mekonnen Citation2017).
2. Materials and methods
2.1. Description of the study area
This study was conducted in Andrcha district, located in Southwest Ethiopia between latitudes of 7°22′ and 7°45′ N and longitude of 35°6′ and 35°35′ E (). The district covers an estimated area of 1,011.7 km2. The altitude of the area ranges from 838 to 2756 m and slope reaching 65 degrees. It is one of the areas with a high rainfall in the country receiving around 2005 mm per annum. The mean annual temperature of the area is 17.6 °C. The vegetation of the area is mostly characterized by typical Afromontane forests, which constitute a unique forest type occurring on high African mountains. The district is also home to the Skeka forest, which received the status of a UNESCO Biosphere Reserve (FDRE Citation2011). It is also one of the few remaining pristine moist afromontane forests in Ethiopia. As such, it is highly regarded as important for the conservation of afromontane forest vegetation types including alpine bamboo thickets (SZA Citation2015). The conspicuous woody species in the area include Macaranga capensis, Pouteria adolfi-friedericii, Millettia ferruginea, Oldeania alpina and Coffea arabica (Mullatu et al. Citation2015). The main land use system in the area is coffee agro-forestry. Besides, non-timber forest products (eg, honey and spices) and crop production are important as well.
Figure 1. Maps of a) the study area with elevation between 838 m above sea level (m.a.s.l.) to 2756 (m.a.s.l.) and b) dense sample plots used for the classification bamboo-orange, Forest- dark green, other vegetation-yellow, non-vegetation-red, and water body-blue. The grey area represents the study district, and hashed area is other districts.
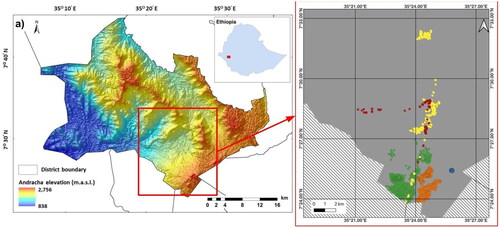
2.2. Data acquisition and preparation
Ground control data collection using the Global Positioning System (GPS) was conducted in the Andracha district between January and June 2020. Reference points were also collected from high resolution imagery of Google Earth Pro (Li et al. Citation2016; Zhang et al. Citation2019). A total of 1882 reference points were used for training, testing of image classification, and mapping. The highest number of samples (558 points) was taken from bamboo land cover class to increase the classification accuracy (Abebe et al. Citation2021). Sentinel-2 (S2) multispectral imagery (Phiri et al. Citation2020) was selected as a remote sensing data source. It was selected as it provides imagery with a combination of higher spatial resolution and frequency, with less data volume for a comparable space-time dataset (Clark et al. Citation2020). GEE JavaScript was used to process all available time-series remote sensing data. Sentinel-2 surface reflectance data at 10–20 m spatial resolution from January 01 to December 31, 2020, having cloud cover less than 10% and covering the study area were accessed from European Space Agency (ESA Citation2022) in GEE platform. These data were finally produced with 10 m spatial resolution to have the same spatial resolution data for analysis in the same platform. A total of 144 images were acquired and median values of the observations were computed to fill gaps from clouds in the image, which have high values, and shadows, which have low values (Gorelick et al. Citation2017). We applied an image compositing and reducer function to calculate the median value of the image collection in 2020 (Venkatappa et al. Citation2020).
2.3. Analytic framework
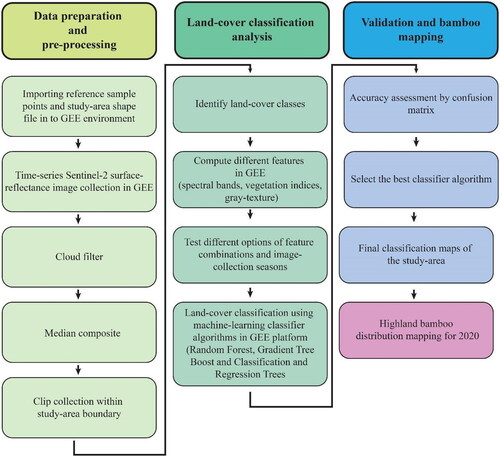
The analytical framework to perform the classification and mapping of the highland bamboo forest is presented in . The overall mapping approach follows four main steps. First, numerous spectral and textural features for bamboo identification were derived from the time-series Sentinel-2 data. Second, field collected training and validation data were refined. Third, different machine learning classifier algorithms were tested using the training samples. Finally, the best performing algorithm was used for the classification and mapping of bamboo. GEE was used to process remotely sensed data, analyze features, and implement classifications (Gorelick et al. Citation2017). ArcGIS 10.3 was used to generate the final mapping results and statistical analysis. Details of the methodology are provided below.
Figure 2. Methodological framework implemented to execute LULC classification and bamboo cover mapping.
2.3.1. Feature extraction
Mapping bamboo using standard supervised and unsupervised classification techniques with the traditional spectral approach is challenging due to the similarity of spectra between bamboo and other forest types (Goswami et al. Citation2010; Zhang et al. Citation2019; Abebe et al. Citation2021; Qi et al. Citation2022) and as shown in . To offset this problem, machine learning algorithms using different feature extractions in GEE proved successful in improving land cover classifications (Phan et al. Citation2020; Zeng et al. Citation2020; Hasan et al. Citation2022; Qi et al. Citation2022). In the present study, 15 features were employed in GEE for the land cover classification and highland bamboo mapping (). These are spectral bands, vegetation indices and textural features.
Figure 3. Spectral profile of the five classes bamboo, forest, other vegetation, non-vegetation, and water body.
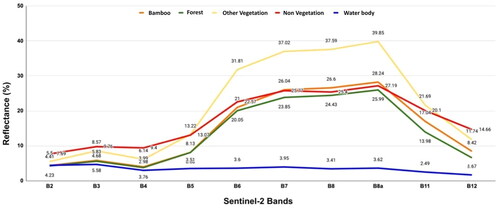
Table 1. Variables used for land cover classification and highland bamboo mapping.
Vegetation indices derived from various multi-spectral bands are sensitive indicators of the presence and conditions of specific types of green vegetation (Bannari et al. Citation1995; Goswami et al. Citation2010; Lillesand et al. Citation2015). In the present study, six vegetation indices have been calculated and tested for each image scene to distinguish different land covers in the Southwest Ethiopia. Vegetation indices were produced from the surface reflectance composites using GEE. The indices used were the normalized difference vegetation index (NDVI) (Zhang et al. Citation2019), enhanced vegetation index (EVI) (Wang et al. Citation2017), green chlorophyll vegetation index (GCVI) (Zhang et al. Citation2019), land surface water index (LSWI) (Wang et al. Citation2017), stress index (SI) (Goswami et al. Citation2010), and a normalized (double) difference bamboo index (BI) (Goswami et al. Citation2010). They are defined as:
where ρblue, ρgreen, ρred, ρNIR, ρSWIR1 and ρSWIR2 are the surface reflectance values of blue (458–523 nm), green (543–578 nm), red (650–680 nm), near-infrared (785–899 nm), shortwave- infrared 1 (1565–1655 nm) and shortwave- infrared 2 (2100–2280 nm) bands in S2 sensor, respectively.
NDVI and EVI are related to vegetation greenness. GCVI has a more dynamic range for denser canopies (high LAI) than NDVI, and LSWI is sensitive to the vegetation canopy water content and its soil background (Zhang et al. Citation2019). SI and BI measure leaf water content (Goswami et al. Citation2010). LSWI is also known as normalized difference moisture index or normalized difference water index (Jensen Citation2015).
In addition to vegetation indices, textural features were derived from the composited image using GEE to help the land cover classification (Qi et al. Citation2022). The most frequently cited method for texture analysis is based on gray level co-occurrence matrix (GLCM) (Harlick et al. Citation1973). GLCM is a matrix where the number of rows and columns is equal to the number of gray levels in the image (Mohanaiah et al. Citation2013). According to Iqbal et al. (Citation2021), the first step in calculating GLCM is to convert the original image to the grayscale. The next step is to extract spatial features from the gray-scale images based on the relationship of brightness values to the center pixel with its neighborhood defined by a kernel or window size. Several texture features can be extracted from the GLCM. In this study, three textural features, namely, contrast, entropy and inverse difference moment (IDM) were considered. The features are selected based on their discrimination accuracy and time required for computation (Mohanaiah et al. Citation2013).
Contrast measures the spatial frequency of an image and is a different moment of GLCM (Iqbal et al. Citation2021). It is the difference between the highest and the lowest values of the adjacent set of pixels. Entropy shows the amount of information of the image that is needed for the image compression. Entropy measures the loss of information or message in a transmitted signal and measures the image information (Mohanaiah et al. Citation2013). IDM measures the homogeneity in the image where it assumes larger values for smaller differences in grey tone within-pair elements. GLCM contrast and homogeneity are strongly and inversely correlated, which means homogeneity decreases when contrast increases while energy is kept constant (Iqbal et al. Citation2021). Each of the listed textural features was computed using the following equations (Mohanaiah et al. Citation2013; Iqbal et al. Citation2021).
where N denotes the number of gray levels, while P(i, j) is the normalized value of the grayscale position i and j of the kernel with a sum equal to 1.
2.3.2. Image classification and validation
Land cover classification was done using supervised classification in three machine learning classification algorithms in the GEE platform. These were random forest (RF), gradient tree boosting (GTB) and classification and regression trees (CART) classifiers (Gorelick et al. Citation2017). These algorithms were chosen because they are suitable for categorical classification and have been widely used in various contexts for classification (Breiman et al. Citation1984; Ming et al. Citation2016; Jamali et al. Citation2021; Park et al. Citation2021). RF is an ensemble learning method that produces a series of decision trees, using a randomly selected subset of training samples and variables (Breiman et al. Citation1984; Belgiu and Drăguţ Citation2016; Zhang et al. Citation2019). The RF classifier improves the classification accuracy through its object-based processing algorithms (Magidi et al. Citation2021). GTB is a decision tree–based algorithm that tries to predict the residual of the previous decision tree. In GTB, predictions are obtained in a sequential approach in which each decision tree predicts the error of the previous decision tree—thereby boosting (improving) the error (gradient) (Ayyadevara Citation2018). In gradient boosting machines, the learning procedure consecutively fits new models to provide a more accurate estimate of the response variable (Natekin and Knoll Citation2013). CART is a simple but powerful prediction model constructed by recursively partitioning a data set and fitting a simple model to each partition (Breiman et al. Citation1984). Unlike logistic and linear regression, CART does not develop a prediction equation, instead data are partitioned along the predictor axes into subsets with homogeneous values of the dependent variable—a process represented by a decision tree that can be used to make predictions from new observations (Krzywinski and Altman Citation2017).
For the land cover classification, several options of feature combinations were tested for different composite periods: dry season (December–February), short rainy season (March–May), main (long) rainy season (June-August), wet season (September–November) and annual composite. The annual composite represents all seasons combined. The options tested in the classification were:
Option 1: Spectral bands, vegetation indices and textural features
Option 2: Spectral bands and vegetation indices
Option 3: Only spectral bands
Option 4: Only vegetation indices
The classification was implemented with 100 decision trees, because of the good balance between classification performance and cost in computation time (Zhang et al. Citation2019). The classification process was designed in such a way that five land cover classes that are pertinent to the objective of this study were identified (), and their spectral profile was plotted by taking the average reflectance values of each class from Sentinel 2 bands ().
Table 2. Land use/land cover description.
Evaluating the accuracy of classification results is important to select the best classification algorithm and proceed to other procedures. To validate the classification, the data were split into two, 70% for training and 30% for validating. The classification accuracy was assessed using a confusion matrix (Zewdie and Csaplovies Citation2015; Li et al. Citation2016; Xu et al. Citation2020). Based on the confusion matrix, accuracy statistics, including overall accuracy and kappa coefficient (a measure of overall accuracy that accounts for chance agreement), were calculated (Han et al. Citation2014). The one with highest overall accuracy and kappa statistics were used for land cover classification and bamboo mapping.
2.3.3. Generating the bamboo distribution map
Since distinguishing bamboo from other land use types is more critical in this research, the highland bamboo land use category was extracted from the classified map for further processing using ArcGIS software to identify natural highland bamboo growing areas. The processes include visualization, area estimation and export. To ensure consistency among data sets (Abebe et al. Citation2021) and to estimate the area covered by the highland bamboo, all images were projected to the Universal Transverse Mercator (UTM) Projection System, Zone 37 N, Datum of World Geodetic System 84 (WGS84).
3. Results
3.1. Classification accuracy assessment
The evaluation of classification accuracy among the land cover classes showed that the random forest classifier with all the spectral, vegetation and textural variables in the annual composite provided the best result with 94% overall accuracy and 0.92 kappa coefficient (). The user accuracy for the specified classification algorithm was high, ranging between 0.92 and 1, the highest being for Bamboo. Likewise, the producer accuracy for the land cover categories ranged between 0.91 and 0.97, and the lowest and highest being for other vegetation and water body, respectively. Therefore, the RF classifier with all the features in the annual composite was chosen to create land cover maps of the study area for further processes of highland bamboo mapping. GTB found a robust machine learning algorithm in three seasons (Dry, Short rain and Wet) while RF had better performance for Annual and Main rain season (). CART performed least in all seasons and options.
Table 3. Classification accuracy results for the land cover categories of the study area.
3.2. Land cover classification
Land cover classification map of the study area from the RF classifier with all the spectral, vegetation and textural variables in the annual composite presented in . The variable importance score analysis indicated that red, SWIR2 and blue spectral bands and LSWI and SI vegetation indices had substantial role in the land cover classification (). The estimated areas occupied by the different land cover categories in the district were presented in . The classification result shows that much of the study area is covered by forest (67%) and bamboo covers only 9% (). Land cover classification across the four seasons is provided in .
Figure 4. Land cover classification map of Andracha district in 2020 from RF classifier with all the spectral, vegetation and textural variables in the annual composite.
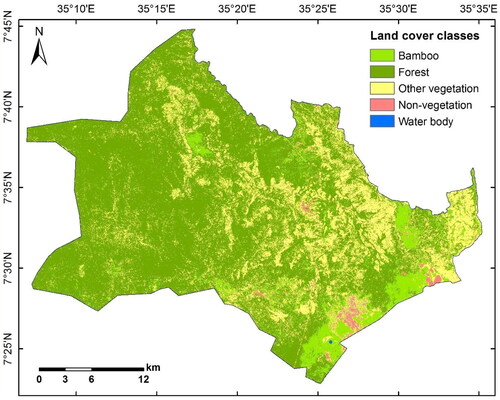
Figure 5. Variable importance scores of the classification features.
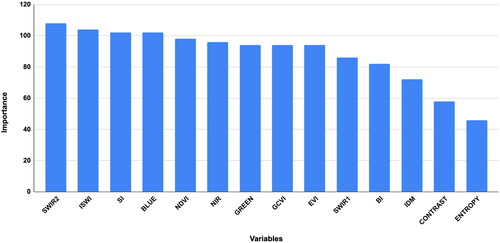
Figure 6. Comparison of the land cover classification results from different seasons: A) represents ‘Dry’ B) represents ‘Short rain’ C) represents ‘Main rain’ and D) represents ‘Wet’ seasons. White color indicates missing data from the cloud.
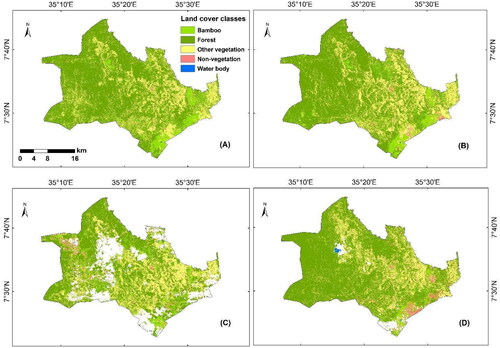
Table 4. Estimated area occupied by the different land cover categories in the study area.
The variable importance score analysis showed that red, SWIR2 and blue spectral bands and LSWI and SI vegetation indices had a substantial role in the land cover classification (). On the other hand, ENTROPY and CONTRAST have the least importance for the classification.
3.3. Distribution of highland bamboo
Maps showing the distribution of natural highland bamboo were generated using the RF and GTB classifier algorithms for the entire Andracha district for the year 2020 ( and ). Accordingly, abundant highland bamboo resources were found in the southern and southeastern part of the district, and some patches can be observed in the northern part. The natural highland bamboo growing area in the district was estimated at 91 km2 (9,096 ha), which accounts for about 9% of the total area of the district ().
Figure 7. Map showing the distribution of natural highland bamboo forest in Andracha district Southwest Ethiopia, in 2020 from RF classifier with all the spectral, vegetation and textural variables in the annual composite.
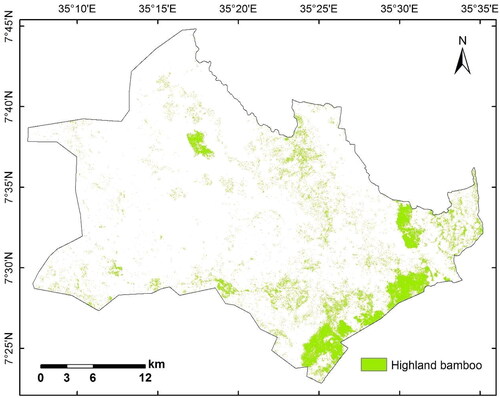
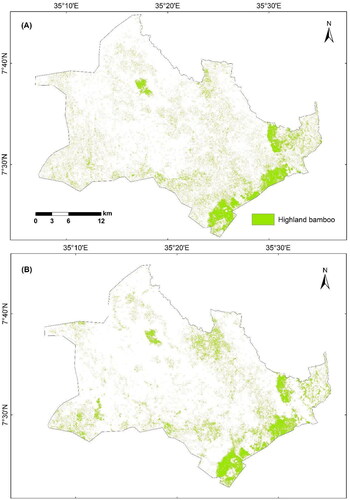
Figure 8. Comparison of the distribution of natural highland bamboo forest results from different seasons: A) represents ‘Dry’; B) represents ‘Short rain’.
4. Discussion
A number of studies have attempted to map bamboo forests in general (Du et al. Citation2018; Feng et al. Citation2023; Xiang et al. Citation2023; Li et al. Citation2023a,Citation2023b), but such efforts are lacking for highland bamboo particularly in Afromontane forests. Based on published literature, this is the first machine learning based classification implemented in GEE to map the natural distribution of highland bamboo in Ethiopia. Compared to the commonly used single-date or sparse multi-date image selection approaches, the adoption of GEE cloud-based time-series image compositing and computing platform significantly enhanced classification accuracy by incorporating massive volumes of image data and multiple input parameters using machine learning techniques so as to obtain comprehensive spatio-temporal information and also by alleviating the influence of cloud (Liu et al. Citation2018; Zhang et al. Citation2019). The study area receives relatively high rainfall with intense cloud cover compared to other parts of the country. This is also characteristic of Afromontane forests occurring across Africa, some of which are called cloud forests (Aerts et al. Citation2011). Consequently, it is difficult to get cloud free Sentinel images manually like downloading to a local storage and using a composite imagery based on annual time series offered the best option. GEE can carry out simultaneous temporal and spatial aggregations over a collection of satellite imagery by searching available cloud free data for the area (Sidhu et al. Citation2018). The image compositing facilitated by GEE was helpful to obtain more observations for a time series analysis to handle the highland bamboo mapping.
The machine learning classification algorithms enabled big data analytics in the GEE environment for effective delineation of forest resources (Singh et al. Citation2020). In the current study, both RF and GTB classifiers had comparable accuracy and showed good performance to classify the land use categories in the study area. The distribution of highland bamboo was highly affected by the presence of cloud cover in Main rain and Wet seasons. Therefore, highland bamboo mapping is better when time series collection is done during dry, short rain and annual composite if optical satellite data is utilized for the analysis. The accuracy of classification was increased when more features were added to the analysis. The inclusion of vegetation indices and textural features further improved the land cover classification in the study area. These results are consistent with other studies (Liu et al. Citation2018; Venkatappa et al. Citation2019; Zhang et al. Citation2019; Venkatappa et al. Citation2020; Qi et al. Citation2022). The land cover classification in our study also improved when the time-series remote sensing data were taken for the whole year. This may be attributed to the fact that spectral information in each pixel becomes more complete when many images are added in the analysis.
The variable importance analysis revealed that the red, SWIR2 and blue variables from spectral bands and LSWI and SI variables from vegetation indices were the most useful features in the classification. Previous studies also indicated that LSWI and SI are important indices in discriminating different vegetation types as they determine the water content of the plants, which is different for different plants (Goswami et al. Citation2010; Li et al. Citation2016; Liu et al. Citation2018; Zhang et al. Citation2019). Among the textural features, the inverse difference moment performed better than the other two features of the GLCM. Similarly, a study by Qi et al. (Citation2022) reported that better results were achieved by IDM from the GLCM features tested.
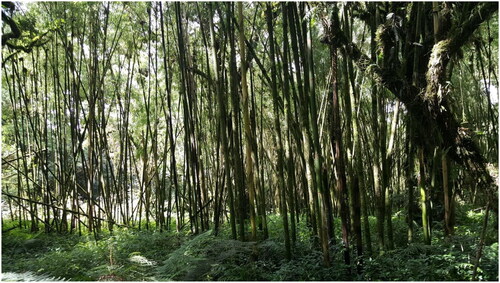
The study area is one of the few places in Ethiopia endowed with natural forest. The forest coverage of the district was estimated at approximately 770 km2. Other studies also confirmed that the area is covered with a vast natural forest of substantial highland bamboo resource (Bedru Citation2007; Melese et al. Citation2014; Mullatu et al. Citation2015; Zhao et al. Citation2018; Shoddo Citation2020). Out of the natural forest, we estimated that 11.8% is covered by the highland bamboo. The highland bamboo occurs in monoculture stands with very few scattered trees (). The estimated highland bamboo coverage found in the current study is higher than a report by Melese et al. (Citation2014) who estimated it as about 4518 ha in 2012. This is probably because the improved image analysis technique enabled us to better map the distribution of highland bamboo forest in the study area. This demonstrates the capability of image compositing in GEE and inclusion of vegetation indices and textural features in machine learning classification as a powerful framework for monitoring of highland bamboo at a large spatial scale. The approach used in this study has potential applications in mapping the distribution of the natural bamboo forests not only in Ethiopia but also in afro-montane forests elsewhere in Africa. Moreover, the vast bamboo resource found in the district coupled with bamboo is a renewable natural resource, sustainable utilization of the bamboo forest can enhance the livelihood of the community besides protecting the environment. Highland bamboo is a conspicuous element in Afromontane vegetation covering Ethiopia, Kenya, DR Congo, Rwanda, Uganda, Tanzania and Malawi in eastern Africa, and the Bamenda Mountains of Cameroon (Grimshaw Citation1999; Yebeyen Citation2023). The species forms dense stands on the high mountains of significant conservation status, including protected areas (Hall and Inada Citation2008; Sheil et al. Citation2012; Stapleton Citation2013; Katumbi et al. Citation2017). It also provides habitat and food for the critically endangered and flagship species like eastern Mountain Gorilla and Bale Mountain monkeys (Sheil et al. Citation2012; Stapleton Citation2013; Mekonnen Citation2022).
Figure 9. Natural highland bamboo stands in Andracha district, southwest Ethiopia.
5. Conclusion
As far as we are aware, this is the first of its kind in mapping natural highland bamboo in Afromontane forests using vegetation indices and textural features by machine learning algorithms in the Google Earth Engine cloud-computing platform. The study provides evidence for the feasibility of using machine learning-based mapping and multi-date compositing imagery in GEE to discriminate bamboo and other vegetation at moderate spatial resolutions. We conclude that image compositing overcomes the common challenges including cloud cover, shadow and missing sentinel observations in land cover classification and mapping. We also conclude that the incorporation of vegetation indices and GLCM textures in land cover classification increases accuracy of mapping natural highland bamboo resource coverage and distribution. The present work demonstrated an efficient and cost-effective method for mapping the distribution of bamboo-growing areas. The approach used in this research will have potential applications in forest resources mapping, ecosystem modelling, and biodiversity conservation and utilization. This study has identified omission errors in capturing smaller bamboo patches from moderate-resolution satellite data as the main limitation. Further research is required to validate the method used in this study in other highland bamboo growing areas of Ethiopia and elsewhere in Africa using higher spatial resolution remote sensing images.
Acknowledgements
The authors acknowledge the financial support from the Ethiopian Environment and Forest Research Institute (EEFRI) and Addis Ababa University (AAU).
Disclosure statement
The authors report that there are no competing interests to declare.
Data availability statement
The data that support the findings of this study are available from the corresponding author upon reasonable request.
Additional information
Funding
References
- Abebe S, Minale AS, Teketay D. 2021. Spatio-temporal bamboo forest dynamics in the lower Beles River Basin, North-Western Ethiopia. Remote Sens Appl Soc Environ. 23:100538. doi: 10.1016/j.rsase.2021.100538.
- Aerts R, Thijs KW, Lehouck V, Beentje H, Bytebier B, Matthysen E, Gulinck H, Lens L, Muys B. 2011. Woody plant communities of isolated Afromontane cloud forests in Taita Hills, Kenya. Plant Ecol. 212(4):639–649. doi: 10.1007/s11258-010-9853-3.
- Ayyadevara VK. 2018. Gradient boosting machine. Pro machine learning algorithms. Springer, p. 117–134. Apress Berkeley, CA. doi: 10.1007/978-1-4842-3564-5.
- Bannari A, Morin D, Bonn F, Huete A. 1995. A review of vegetation indices. Remote Sensing Reviews. 13(1-2):95–120. doi: 10.1080/02757259509532298.
- Bedru S. 2007. Land-use/land-cover changes in Andracha and Masha Woredas of Sheka zone, SNNP regional state. In: Maseresha F, editor. Forests of Sheka: ecological, social, legal and economic dimensions of recent land-use/land-cover changes, overview and synthesis. Multidisciplinary case studies on impact of land-use/land-cover changes, South West Ethiopia. Addis Ababa: Melca Mahiber, p. 21–56.
- Belgiu M, Drăguţ L. 2016. Random forest in remote sensing: a review of applications and future directions. ISPRS J Photogram Remote Sens. 114:24–31.
- Breiman L, Friedman JH, Olshen RA, Stone CJ. 1984. Classification and regression trees. Volume 432. Belmont, CA: Wadsworth International Group; p. 151–166.
- Clark LG, Londoño X, Ruiz-Sanchez E. 2015. Bamboo Taxonomy and Habitat. In: Liese, W., Köhl, M. (eds) Bamboo. Tropical Forestry, vol 10. Cham, Switzerland: Springer International Publishing. p. 1–30. doi: 10.1007/978-3-319-14133-6_1.
- Clark ML. 2020. Comparison of multi-seasonal Landsat 8, Sentinel-2 and hyperspectral images for mapping forest alliances in Northern California. ISPRS journal of photogrammetry and remote sensing. 159:26–40. doi: 10.1016/j.isprsjprs.2019.11.007.
- Du H, Mao F, Li X, Zhou G, Xu X, Han N, Sun S, Gao G, Cui L, Li Y, et al. 2018. Mapping global bamboo forest distribution using multisource remote sensing data. IEEE J Select Topic Appl Earth Observ Remote Sens. 11(5):1458–1471.
- Embaye K. 2003. Ecological aspects and resource management of bamboo forests in Ethiopia. [Dissertation]. Uppsala, Sweden: Swedish University of Agricultural Sciences.
- ESA. 2022. Sentinel-2 missions-sentinel online. Paris, France: European Space Agency.
- FDRE. 2011. Sheka forest biosphere reserve nomination form. Addis Ababa, Ethiopia: Federal Democratic Republic of Ethiopia.
- Feng X, Tan S, Dong Y, Zhang X, Xu J, Zhong L, Yu L. 2023. Mapping large-scale bamboo forest based on phenology and morphology features. Remote Sens. 15(2):515. doi: 10.3390/rs15020515.
- Gilabert MA, Gonzalez-Piqueras J, Martinez B. 2010. Theory and applications of vegetation indices. In: Maselli F, Menenti M, and Brivio PA, editors. Remote sensing optical observations of vegetation properties. Research Signpost, Scarborough, Toronto, Canada, pp.1–43.
- Gorelick N, Hancher M, Dixon M, Ilyushchenko S, Thau D, Moore R. 2017. Google Earth Engine: planetary-scale geospatial analysis for everyone. Remote Sens Environ. 202:18–27. doi: 10.1016/j.rse.2017.06.031.
- Goswami J, Tajo L, Sarma K. 2010. Bamboo resources mapping using satellite technology. Curr Sci. 99(5):650–653.
- Grimshaw JM. 1999. The afromontane bamboo, Yushania alpina, on Kilimanjaro. J East Afr Nat History. 88(1):79–83. doi: 10.2982/0012-8317(1999)88[79:TABYAO]2.0.CO;2.
- Hall J, Inada T. 2008. Sinarundinaria alpina (k. Schum.). Wageningen, Netherlands: PROTA (Plant Resources of Tropical Africa).
- Han N, Du H, Zhou G, Sun X, Ge H, Xu X. 2014. Object-based classification using spot-5 imagery for moso bamboo forest mapping. Int J Remote Sens. 35(3):1126–1142. doi: 10.1080/01431161.2013.875634.
- Hansen MC, Potapov PV, Moore R, Hancher M, Turubanova SA, Tyukavina A, Thau D, Stehman SV, Goetz SJ, Loveland TR, et al. 2013. High-resolution global maps of 21st-century forest cover change. Science. 342(6160):850–853. doi: 10.1126/science.1244693.
- Harlick RM, Shanmugam K, Dinstein I. 1973. Textural features for image classification. IEEE Trans Syst Man Cybernet. SMC-3(6):610–621.
- Hasan S, Al-Hameedawi AN, Ismael H. 2022. Supervised classification model using Google Earth Engine development environment for Wasit Governorate. In IOP Conference Series: Earth and Environmental Science. United Kingdom: IOP Publishing Ltd.; p. 012051. doi: 10.1088/1755-1315/961/1/012051.
- Iqbal N, Mumtaz R, Shafi U, Zaidi SMH. 2021. Gray level co-occurrence matrix (glcm) texture based crop classification using low altitude remote sensing platforms. PeerJ Comput Sci. 7:e536. doi: 10.7717/peerj-cs.536.
- Jamali A, Mahdianpari M, Karaş IR. 2021. A comparison of tree-based algorithms for complex wetland classification using the google earth engine. Int Arch Photogram Remote Sens Spatial Inform Sci. 46:313–319.
- Jensen JR. 2015. Introductory digital image processing: a remote sensing perspective. New York, USA: Pearson Education, Inc.
- Katumbi NM, Kinyanjui MJ, Kimondo J, Mware MJ. 2017. Biomass energy resource of the Highland Bamboo (Yushania alpina) and its potential for sustainable exploitation in Southern Aberdares Forest. JSBS. 07(03):85–97. doi: 10.4236/jsbs.2017.73007.
- Kelbessa E, Bekele T, Gebrehiwot A, Hadera G, Ababa A. 2000. A socioeconomic case study of the bamboo sector in ethiopia. Addis Ababa, Ethiopia.
- Krzywinski M, Altman N. 2017. Classification and regression trees. Nat Methods. 14(8):757–758. doi: 10.1038/nmeth.4370.
- Kumar L, Mutanga O. 2018. Google earth engine applications since inception: usage, trends, and potential. Remote Sens. 10(10):1509. doi: 10.3390/rs10101509.
- Li S, He S, Yue T, Du Z, Zhao N, Zhao Y, Jiao Y, Fan B, Liu Y, Xu Z, et al. 2023b. Mapping bamboo forest and expansion intensity in China by coupling vegetation phenology and C-band SAR with Sentinel-1 and Sentinel-2 images. Int J Appl Earth Obs Geoinf. 121:103384. doi: 10.1016/j.jag.2023.103384.
- Li M, Li C, Jiang H, Fang C, Yang J, Zhu Z, Shi L, Liu S, Gong P. 2016. Tracking bamboo dynamics in Zhejiang, China, using time-series of landsat data from 1990 to 2014. Int J Remote Sens. 37(7):1714–1729. doi: 10.1080/01431161.2016.1165885.
- Lillesand T, Kiefer RW, Chipman J. 2015. Remote sensing and image interpretation. New Jersey, United States: John Wiley & Sons.
- Liu C, Xiong T, Gong P, Qi S. 2018. Improving large-scale Moso bamboo mapping based on dense landsat time series and auxiliary data: a case study in Fujian province, China. Remote Sens Lett. 9(1):1–10. doi: 10.1080/2150704X.2017.1378454.
- Li L, Zhu H, Wu T, Wei L, Li N. 2023a. New landscape-perspective exploration of Moso bamboo forests under on/off-year phenomena and human activities. Front Glob Change. 6:1204329. doi: 10.3389/ffgc.2023.1204329.
- Magidi J, Nhamo L, Mpandeli S, Mabhaudhi T. 2021. Application of the random forest classifier to map irrigated areas using google earth engine. Remote Sens. 13(5):876. doi: 10.3390/rs13050876.
- Mekonnen A. 2017. Socio-economic and socio-cultural value of highland bamboo (Yushania Alpina) plant and its contribution to rural livelihood in Banja district, Awi zone ethiopia. [Thesis]. Addis Ababa, Ethiopia: Addis Ababa University.
- Mekonnen Z. 2022. The climate change-agriculture nexus in drylands of Ethiopia. In: Hufnagel L, editor. Vegetation dynamics, changing ecosystems and human responsibility. London, United Kingdom: IntechOpen.
- Mekonnen Z, Worku A, Yohannes T, Alebachew M, Teketay D, Kassa H. 2014. Bamboo resources in Ethiopia: their value chain and contribution to livelihoods. Ethnobot Res App. 12:511–524. doi: 10.17348/era.12.0.511-524.
- Melese D, Suryabhagavan KV, Gelet M, Balakrishnan M. 2014. Remote sensing and geographic information system-based African civet habitat mapping in Andracha, Ethiopia. J Appl Remote Sens. 8(1):083502. doi: 10.1117/1.JRS.8.083502.
- Ming D, Zhou T, Wang M, Tan T. 2016. Land cover classification using random forest with genetic algorithm-based parameter optimization. J Appl Remote Sens. 10(3):035021. doi: 10.1117/1.JRS.10.035021.
- Mohanaiah P, Sathyanarayana P, Gurukumar L. 2013. Image texture feature extraction using GLCM approach. International Journal of Scientific Research Publications. 3(5):1–5.
- Mulatu Y, Alemayehu A, Tadesse Z. 2016. Biology and management of indigenous bamboo species of Ethiopia: Ethiopian Environment Forest Research Institute. Ethiopia: Addis Ababa.
- Mullatu A, Sisay M, Argaw M. 2015. Woody species diversity, structure, regeneration and their significance to the inhabitants in southwestern Ethiopia. Int J Curr Res. 7(10):21049–21062.
- Natekin A, Knoll A. 2013. Gradient boosting machines, a tutorial. Front Neurorobot. 7:21. doi: 10.3389/fnbot.2013.00021.
- Nath AJ, Sileshi GW, Das AK. 2020. Bamboo: climate change adaptation and mitigation. Florida, USA: Apple Academic Press.
- Park J, Lee Y, Lee J. 2021. Assessment of machine learning algorithms for land cover classification using remotely sensed data. Sens Mater. 33(11):3885–3902. doi: 10.18494/SAM.2021.3612.
- Phan TN, Kuch V, Lehnert LW. 2020. Land cover classification using Google Earth engine and random forest classifier—the role of image composition. Remote Sens. 12(15):2411. doi: 10.3390/rs12152411.
- Phiri D, Simwanda M, Salekin S, Nyirenda VR, Murayama Y, Ranagalage M. 2020. Sentinel-2 data for land cover/use mapping: a review. Remote Sens. 12(14):2291. doi: 10.3390/rs12142291.
- Qi S, Song B, Liu C, Gong P, Luo J, Zhang M, Xiong T. 2022. Bamboo forest mapping in China using the dense landsat 8 image archive and Google Earth Engine. Remote Sens. 14(3):762. doi: 10.3390/rs14030762.
- Sheil D, Ducey M, Ssali F, Ngubwagye JM, Van Heist M, Ezuma P. 2012. Bamboo for people, mountain gorillas, and golden monkeys: evaluating harvest and conservation trade-offs and synergies in the Virunga volcanoes. For Ecol Manage. 267:163–171. doi: 10.1016/j.foreco.2011.11.045.
- Shoddo GH. 2020. Assessing land use and land cover changes and effects of large-scale agricultural farm expansion in southwestern Ethiopia by using remote sensing/gis tools. Res Square. doi: 10.21203/rs.3.rs-93906/v1.
- Sidhu N, Pebesma E, Câmara G. 2018. Using Google Earth engine to detect land cover change: Singapore as a use case. Eur J Remote Sens. 51(1):486–500. doi: 10.1080/22797254.2018.1451782.
- Singh V, Bhattacharjee V, Jeganathan C, Bhattacherjee N. 2020. Land cover classification using machine learning techniques-a survey. Int J Eng Res Technol. 9(6):1231–1233.
- Stapleton CM. 2013. Bergbambos and Oldeania, new genera of African bamboos (Poaceae, Bambusoideae). PhytoKeys. 25(25):87–103. doi: 10.3897/phytokeys.25.6026.
- Sza. 2015. Sheka biosphere reserve management plan. Masha, Ethiopia: Sheka Zone Administration.
- Tomita F, Tsuji S. 2013. Computer analysis of visual textures. Heidelberg, Germany: Springer Science & Business Media.
- Turner W, Rondinini C, Pettorelli N, Mora B, Leidner AK, Szantoi Z, Buchanan G, Dech S, Dwyer J, Herold M, et al. 2015. Free and open-access satellite data are key to biodiversity conservation. Biol Conserv. 182:173–176., doi: 10.1016/j.biocon.2014.11.048.
- Venkatappa M, Anantsuksomsri S, Castillo JA, Smith B, Sasaki N. 2020. Mapping the natural distribution of bamboo and related carbon stocks in the tropics using Google Earth Engine, phenological behavior, landsat 8, and sentinel-2. Remote Sens. 12(18):3109. doi: 10.3390/rs12183109.
- Venkatappa, M., Sasaki, N., Shrestha, R.P., Tripathi, N.K. & Ma, H.-O. 2019. Determination of vegetation thresholds for assessing land use and land use changes in Cambodia using the Google Earth Engine cloud-computing platform. Remote Sens, 11(13), 1514. doi: 10.3390/rs11131514.
- Wang J, Xiao X, Qin Y, Dong J, Geissler G, Zhang G, Cejda N, Alikhani B, Doughty RB. 2017. Mapping the dynamics of eastern redcedar encroachment into grasslands during 1984–2010 through Palsar and time series Landsat images. Remote Sens Environ. 190:233–246. doi: 10.1016/j.rse.2016.12.025.
- Xiang S, Xu Z, Shen W, Chen L, Hao Z, Wang L, Liu Z, Li Z, Guo X, Zhang H. 2023. Mapping of bamboo forest bright and shadow areas using optical and SAR satellite data in Google Earth Engine. Geocarto Int. 38(1):2203105. doi: 10.1080/10106049.2023.2203105.
- Xu R, Zhao S, Ke YJI.J.O.S.T.I.a.E.O, Sensing R. 2020. A simple phenology-based vegetation index for mapping invasive spartina alterniflora using google earth engine. IEEE J Select Topic Appl Earth Observ Remote Sens. 14:190–201.
- Yebeyen D. 2023. Modeling the distribution and carbon stock potential of highland bamboo in Ethiopia [dissertation]. Addis Ababa, Ethiopia: Addis Ababa University.
- Zeng H, Wu B, Wang S, Musakwa W, Tian F, Mashimbye ZE, Poona N, Syndey M. 2020. A synthesizing land-cover classification method based on Google Earth Engine: a case study in Nzhelele and Levhuvu catchments, South Africa. Chin Geogr Sci. 30(3):397–409. doi: 10.1007/s11769-020-1119-y.
- Zewdie W, Csaplovies E. 2015. Remote sensing based multi-temporal land cover classification and change detection in northwestern Ethiopia. Eur J Remote Sens. 48(1):121–139. doi: 10.5721/EuJRS20154808.
- Zhang M, Gong P, Qi S, Liu C, Xiong T. 2019. Mapping bamboo with regional phenological characteristics derived from dense landsat time series using Google Earth engine. Int J Remote Sens. 40(24):9541–9555. doi: 10.1080/01431161.2019.1633702.
- Zhao Y, Feng D, Jayaraman D, Belay D, Sebrala H, Ngugi J, Maina E, Akombo R, Otuoma J, Mutyaba J, et al. 2018. Bamboo mapping of Ethiopia, Kenya and Uganda for the year 2016 using multi-temporal Landsat imagery. Int J Appl Earth Obs Geoinf. 66:116–125., doi: 10.1016/j.jag.2017.11.008.