
 ?Mathematical formulae have been encoded as MathML and are displayed in this HTML version using MathJax in order to improve their display. Uncheck the box to turn MathJax off. This feature requires Javascript. Click on a formula to zoom.
Abstract
OpenStreetMap (OSM) is one of the most successful and well-known projects in the field of Volunteered Geographic Information (VGI). It has not only become supplement to basic mapping services and professional surveying data, but also a popular free spatial dataset in urban analysis. However, the completeness of OSM building data in China was relatively low in the past. As a result, there is a relatively small number of studies on OSM building data in China, especially in terms of spatial patterns and evolution of OSM building data. In response to this research gap, this article proposes an OSM building data evolution model that combines gravity model and tree model. The spatial distribution pattern and evolution trend of OSM building data in the Yangtze River Delta region of China from 2014 to 2020 were systematically studied, providing insights and references for the future development of OSM building data in China. The research results indicate: (1) From 2014 to 2020, OSM building data in various cities in the Yangtze River Delta region grew rapidly, with an average annual growth rate of 30%, but there were significant spatial differences; (2) In terms of space, due to the influence of urban economy, population, and education level, OSM buildings mainly evolve and develop along large cities, forming a local radial development structure around large cities. Shanghai-Suzhou-Wuxi-Nanjing-Xuzhou/Hefei is the main evolutionary path of OSM building data in the Yangtze River Delta region; (3) In terms of time series, the gap between cities gradually decreases with the development of time, and OSM buildings gradually expand and develop from large cities to small and medium-sized cities, with spatial differences gradually narrowing. However, when OSM buildings have a certain scale, the city size will limit the development of OSM buildings to some extent.
1. Introduction
Over the past decade, Volunteered Geographic Information (VGI), commonly referred to as crowdsourced geographic information, has become readily available (Goodchild Citation2007). It represents an emerging trend where individuals can create and share geographic information. In comparison to traditional professional surveying data, VGI offers advantages such as rich semantic content, broad geographic coverage, real-time updates, and low acquisition costs (Haklay et al. Citation2010; Javanmardi et al. Citation2009). OpenStreetMap (OSM), originating in 2004, is the most successful and well-known project in the VGI domain, experiencing rapid growth in user numbers and geographic data volume. OSM has evolved into a fundamental spatial data service, providing web maps and navigation services for over 200 apps (Minaei Citation2020). Additionally, OSM serves as a source for updating professional surveying data, accepted by surveying institutions in Europe and North America (Pourabdollah et al. Citation2013; Salvucci and Salvati Citation2021; Silva and Camboim Citation2021). Furthermore, OSM, as a popular dataset for urban analysis, is widely used in urban planning (Hagenauer and Helbich Citation2012; Mann, Rankavat, and Joshi Citation2022; Song and Sun 2010), monitoring sustainable development goals (Fritz et al. Citation2019; Herfort et al. Citation2023; Van den Hoek et al. Citation2021), disaster management (Goldblatt, Jones, and Mannix Citation2020; Scholz et al. Citation2018; Zook et al. Citation2010), and public health (Boulos et al. Citation2011; Mooney, Corcoran, and Ciepluch Citation2013), as well as for supporting crisis response during the COVID-19 pandemic (Minghini et al. Citation2020). Consequently, OSM has significantly reduced spatial data usage costs for governments, businesses, and academia.
In addition, as fundamental elements and content within OSM, building spatial data play a crucial role in monitoring 3D urban development (Barranquero et al. Citation2023; Bshouty, Shafir, and Dalyot Citation2020; Goetz and Zipf Citation2012), population distribution (Liu et al. Citation2020; Song and Sun 2010), disaster response (Goldblatt et al. Citation2020; Scholz et al. Citation2018; Zook et al. Citation2010), and the pursuit of sustainable urban development goals (Fritz et al. Citation2019; Herfort et al. Citation2023; Van den Hoek et al. Citation2021). As of the first quarter of 2023, volunteers globally have contributed over 500 million building spatial data to OSM. Although the development of OSM building data in mainland China started relatively late, it has experienced rapid growth in recent years, particularly with the swift rise of volunteered geographic information in China. The OSM building data in mainland China has expanded nearly 67 times in volume from 2012 to 2022. Notably, in some more developed urban areas, the OSM building data has achieved relatively high levels of completeness and is increasingly being utilized (Liu et al. Citation2020; Tian, Zhou, and Fu Citation2019; Xu and Zhou Citation2019). However, our understanding of Chinese OSM building data remains incomplete and lacks comprehensive clarity, particularly regarding how OSM, as a people-centric dynamic system, expands and evolves, as well as how this expansion is spatially distributed. Moreover, by acquiring, identifying, predicting, and managing the growth trends of Chinese OSM data, we can effectively prepare, supplement, and expand spatial data sources to meet the increasing spatial data demands in the future. This will greatly benefit the development and utilization of Chinese OSM building data.
Therefore, to address the rapid growth of OSM buildings in mainland China in recent years, this study proposes a OSM building data Tree-like model to visually simulate the growth and expansion of OSM buildings in the Yangtze River Delta region from 2014 to 2020. The Tree-like model is an application of geographical evolution trees (Geotree) to the development of OSM building. Originating from the concept proposed by Wang et al. (WANG et al. Citation2014), Geotree draws inspiration from biological evolution theories. They transform changes in the states of urban units into evolutionary paths of spatial states between cities, forming a hierarchical structure (WANG et al. Citation2014). This model aids in visualizing and organizing the crowdsourcing mode and evolutionary process of OSM building by integrating multidimensional data, offering a clear depiction of the spatiotemporal expansion and evolution of OSM building between cities over time. Geotree has been widely applied in urban cluster expansion (Fan, Yu, and He Citation2017; Jing et al. Citation2022; Sun et al. Citation2023; Wang et al. Citation2012), documentation analysis (Duan et al. Citation2021; Liang and Xu Citation2023), public health services (Lei et al. Citation2023; Wang and Wang Citation2020), ecological and environmental changes (Tan et al. Citation2023; Zhou, Yang, and Xia Citation2022) and other areas. Through the construction of the Tree-like model to study the expansion and evolution of OSM buildings, this research aims to answer the following questions:
Analyze the development trends of OSM building in China over the past decade, based on the urban clusters in China’s Yangtze River Delta as an example?
Explore the spatial patterns of OSM building and how these patterns expand and evolve among urban systems under the influence of various factors?
The main contribution of this article is to provide a comprehensive model framework for evaluating the spatial pattern evolution of OSM building data, particularly focusing on evolutionary pathways, and to create a comprehensive visualization of the growth patterns of OSM building data. This study represents one of the pioneering research efforts in exploring the expansion characteristics of building data in China.
The remaining sections of this research are structured as follows: Section 2 presents a literature review of OSM research. Section 3 describes the data sources and study area utilized in this research. Section 4 outlines the methodology employed. Section 5 presents the results obtained and conducts an analysis of these findings. Section 6 discusses the limitations of this study and suggests future research directions. Finally, the concluding section summarizes the main research conclusions.
2. Literature review
The majority of data in the OSM project is contributed by non-professional users, with only a small number of users responsible for the majority of data editing tasks. This situation has resulted in two significant barriers to the development of OSM data applications: data quality issues and data imbalance (Su et al. Citation2017). In the context of geographic information data applications, the reliability of data quality is an essential prerequisite. As a result, research on OSM primarily focuses on data quality evaluation, examining aspects such as data completeness, reliability, and semantic accuracy (Duan et al. Citation2021; Liu et al. Citation2023; Nejad, Abbaspour, and Chehreghan Citation2022; Senaratne et al. Citation2017). However, as the number of contributors continues to increase, Linus’ Law has been validated within the realm of big data (Haklay et al. Citation2010). This law suggests that data quality gradually improves with an increasing number of contributors. This is because errors or low-quality data, as well as potential instances of malicious editing, are swiftly addressed by other contributors. Additionally, influential institutions have professionals dedicated to maintaining the quality of maps and data (Ye Su Citation2014). With data quality ensured, the issue of data imbalance in OSM, including uneven data distribution, has become a prominent area of current research.
The study of spatial evolution of data serves as a crucial avenue for comprehending the issue of data imbalance in OSM. The first analysis of OSM evolution was conducted by Corcoran, Mooney, and Bertolotto, who identified processes involving the exploration of new map areas, densification through the exploration of previously mapped areas, compression of objects, and information to increase object density (Corcoran, Mooney, and Bertolotto Citation2013). Since then, many scholars have delved into the evolution of OSM (Minaei Citation2020; Mohammadi, Sedaghat, and Khademi Citation2022; Tian et al. Citation2019; Xu and Zhou Citation2019; Zhao et al. Citation2015). Jamal is dedicated to studying the evolution process of contributed information, primarily monitoring the evolution patterns of OSM in Heidelberg, Germany, from 2007 to 2012, and utilizing cellular automaton models to predict the future development state of OSM (Jokar Arsanjani et al. Citation2015). Additionally, the evolution of humanitarian aspects within OSM is crucial for addressing the evident data inequality among nations (Herfort et al. Citation2021; Kilsedar et al. Citation2017). For instance, Ahmouda et al. investigated the impact of natural disasters on OSM data contribution patterns by analyzing the changes in OSM path characteristics, path labels, and path geometry before, during, and after earthquakes in Nepal and central Italy (Ahmouda, Hochmair, and Cvetojevic Citation2018). These studies also highlight the potential of OSM data in monitoring progress towards sustainable development goals (Hoek et al. Citation2021).
Due to data completeness constraints, spatial evolution characteristics of early OSM road network data have garnered considerable attention. For example, Neis and Zipf studied the evolution of the OSM road network in Germany from 2007 to 2011, considering its evolution from the contributor perspective (Neis, Zielstra, and Zipf Citation2011). Corcoran et al. compared the spatial evolution of OSM road network data in three cities in Ireland based on metric and topological features, indicating that the growth of OSM street networks is controlled by similar densification and exploration processes (Corcoran and Mooney Citation2013; Corcoran et al. Citation2013). This conclusion is also validated in developing countries. Mohammed et al. conducted a time-series spatial analysis of the Turkish OSM dataset from 2007 to 2015, revealing that the street network in the region follows an exploratory and densification evolution model, while also exposing issues of unequal OSM data contribution (Zia, Cakir, and Seker Citation2019). Masoud investigated the spatial distribution, evolution, and diversity of the OSM road network in Iran from 2008 to 2016, exploring its correlation with the urban population (Minaei Citation2020) In the context of research in China, Zhao et al. analyzed the evolution process of the OSM road network in Beijing from four aspects: general analysis, geometric analysis, topological analysis, and centrality analysis, revealing an exploratory and densification evolution process of the road network (Zhao et al. Citation2015). This study enriches the content of research related to urban development in developing countries. Zhang explored the spatial patterns and relationships between OSM road density and type diversity in China based on OSM road data. Zhang et al. focused on 340 Chinese cities, analyzing the spatial patterns of OSM road networks in terms of geometry and attributes (Zhang et al. Citation2015). The research indicates that the spatiotemporal evolution of OSM road networks exhibits characteristics of large scale, long cycle, and diverse analytical perspectives.
In contrast, research on the spatiotemporal evolution of OSM building is relatively scarce. For example, Xu et al. employed spatiotemporal analysis to explore the temporal and spatial distribution patterns of building quantities and contributors in Beijing from 2008 to 2017 (Xu and Zhou Citation2019). They observed a year-on-year growth trend in both building updates and contributor numbers, with the highest updates occurring near landmarks, commercial areas, universities, and transportation hubs. Tian et al. interpreted the evolution of OSM buildings in China from 2012 to 2017 using two indicators: building quantity and density (Tian et al. Citation2019). Yang et al. characterized the evolution patterns of OSM building data by utilizing indicators such as building quantity, building morphology characteristics, and building attributes (YANG Anran Citation2022). The result confirming the progressive refinement development pattern of the OSM building data. Moreover, the spatiotemporal evolution of spatial data under the crowdsourcing model follows certain patterns that cannot be fully described solely by metrics such as quantity and density. As a result, we still lack a deep understanding of the spatiotemporal evolution and evolution of pathways of OSM buildings in China.
3. Study area and data source
3.1. Study area
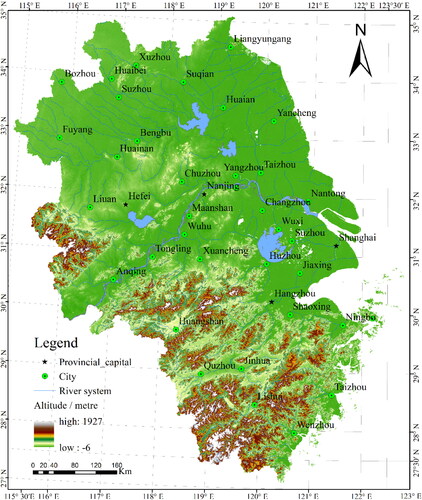
The Yangtze River Delta, commonly referred to as the “Yangtze Delta” or “Yangtze River Delta Region,” is situated in the eastern part of China, in the lower reaches of the Yangtze River. It is located at approximately 118°20′ to 123°25′ east longitude and 28°45′ to 33°25′ north latitude, covering an area of approximately 358,000 square kilometers. The region of the Yangtze River Delta encompasses Shanghai, Jiangsu, Zhejiang, and Anhui and comprises 41 prefecture-level or above cities, as represented in . In 2020, the region had a population of 235 million permanent residents, with an average population density of 656 people per square kilometer, which is 4.5 times the national average. Its gross domestic product (GDP) reached 24.5 trillion yuan, accounting for a quarter of China’s total economic production. With an average urbanization rate of 75.01%, the Yangtze River Delta is one of the most densely populated, fastest urbanizing, and economically developed regions in China. From 2014 to 2020, the number of OSM buildings in the Yangtze River Delta region increased dramatically from 38,359 to 473,489, accounting for 25.56% of the national total. This represents a remarkable growth rate of 1234.36%, making it one of the most data-rich areas for OSM data in China.
Figure 1. The study area.
3.2. Data sources
Utilizing data from the years 2014, 2016, 2018, and 2020, this study aims to investigate the spatial patterns and expansion evolution of OSM buildings among cities in the Yangtze River Delta from 2014 to 2020. The data sources are outlined as follows:
Base Data: The base data used in this study includes Digital Elevation Model (DEM) data, provincial boundaries, city boundaries, urban locations, and river networks within the research area. The administrative boundary data was obtained from the National Administration of Surveying, Mapping and Geoinformation’s Standard Map Service website (http://211.159.153.75/), while the DEM data was sourced from the basic data of a 1:250,000 scale map of the Yangtze River Delta region. The use of official data sources ensures the accuracy of the data. Considering the long time span of this research, the administrative boundary vector data for the Yangtze River Delta region in the year 2020 was uniformly adopted as the reference to avoid boundary changes resulting from administrative adjustments.
Statistical Data: Statistical data is sourced from the "China City Statistical Yearbook" for the years 2014, 2016, 2018, and 2020, as well as the data from the seventh national population census. This includes resident populations, urban economic output, and educational statistics for various prefecture-level cities in the Yangtze River Delta. The Statistical Yearbook, compiled by the National Bureau of Statistics of the People’s Republic of China, comprehensively covers diverse aspects of China’s economy and society. It includes crucial statistical data for multiple significant historical years and the most recent years on a national scale. Renowned for its authoritative nature, timely updates, and consistent availability, the Statistical Yearbook data serves as an essential and frequently-used information source for researchers. Notably, it holds a prominent position in studies related to urban indicators in China.
OSM building data: The study procured OSM building for the years 2014, 2016, 2018, and 2020 from a third-party platform (http://download.geofabrik.de/index.html). Due to limitations imposed by official websites regarding the volume and scope of data downloads, collecting large-scale data has presented certain difficulties. The Geofabrik platform serves as a third-party platform specifically designed for downloading extensive OSM data. This platform encompasses OSM data for nearly all countries and regions worldwide, including multiple geographical layers such as buildings, roads, and land use, categorized by continent and country. Additionally, the Geofabrik platform provides three data formats: shapefile, pbf, and bz2.
3.3. Data analysis
Buildings constitute one of the most important physical elements of urban settlements, and their development is closely linked to urban growth (Hecht, Kunze, and Hahmann Citation2013). Various indicators are used to assess the degree of urban development. The permanent population is commonly used for determining urban rankings and GDP data depict the economic development level of cities. Data on the resident population and GDP for 41 cities within our study area for four different years have been extracted through data cleansing (refer to for population data and for GDP data). Missing values were filled using linear interpolation. Between 2014 and 2020, the Yangtze River Delta region experienced rapid economic growth. The total GDP of the 41 cities increased from 15.7 trillion to 24.5 trillion RMB, marking an overall increase of 8.4 trillion RMB, which represents a growth rate of approximately 53.49%. By 2020, seven cities, including Shanghai, Suzhou, Hangzhou, Nanjing, Ningbo, Wuxi, and Hefei, had GDP figures exceeding 1 trillion RMB, with Shanghai’s GDP alone accounting for 16% of the total at 3.87 trillion yuan. The three cities with the highest GDP increments were Shanghai, Hangzhou, and Hefei, while Chuzhou, Fuyang, and Bozhou had the top GDP growth rates, all exceeding 1. Regarding the resident population, smaller cities exhibited more fluctuations, such as Anqing, Chizhou, and Bozhou. However, the variation range was not substantial. In contrast, large cities demonstrated a consistent year-by-year population increase, exemplified by Hangzhou and Nanjing. The population flow resulting from the economic siphonic effect of these major cities is one of the reasons explaining this phenomenon. Among these cities, Shanghai significantly outperforms others in terms of both GDP and resident population, establishing itself as the absolute core city within the Yangtze River Delta urban system.
Table 1. Population data of 41 cities in 2014, 2016, 2018 and 2020 (Unit: ten thousand people).
Table 2. GDP data of 41 cities in 2014, 2016, 2018 and 2020 (Unit: billions).
OSM data is continuously updated, and we used the data from January 1st of each year as the dataset for the previous year. Subsequently, we performed preprocessing tasks such as clipping and projection transformation on the data. We conducted a count of OSM buildings for 41 cities in the study area over four years (). Between 2014 and 2020, OSM buildings in each city exhibited varying degrees of growth, with significant disparities in both the magnitude and rate of growth among cities. Large cities like Shanghai, Hangzhou, Nanjing, and Jinhua, for example, had a substantial number of OSM buildings, and their counts increased rapidly. Shanghai experienced a significant increase in its OSM building count, growing from 10,633 to 64,443, resulting in a nearly quintuple expansion in size. In contrast, smaller cities like Anqing and Chizhou had fewer OSM buildings, and their growth rates were relatively slow, with instances of negative growth, as observed in Chizhou from 2018 to 2020, where the growth rate was −1.35%. Furthermore, there are instances of a substantial increase in data volumes in specific regions. For example, in Zhenjiang, the number of OSM buildings surged from 3,926 in 2016 to 57,594 in 2018, while in Quzhou, OSM building numbers increased from 204 in 2016 to 16,394 in 2018. This phenomenon can be reasonably explained by corporate editing. Corporate editing is a novel form of participation, often government or business-led, that employs large, paid mapping teams to contribute data (Anderson, Sarkar, and Palen Citation2019; Le Guilcher, Olteanu-Raimond, and Balde Citation2022). While corporate editing can lead to a significant volume of edits within a short timeframe, the quantity and contributions from these entities remain a small fraction of the total contributions made by the wider OSM community (Anderson et al. Citation2019; Sarkar and Anderson Citation2022). Consequently, their impact on the study of OSM buildings within the entire research area is limited.
Table 3. Number of OSM buildings in cities of Yangtze River Delta from 2014 to 2020.
4. Methodology
4.1. Basic definition of Tree-like model
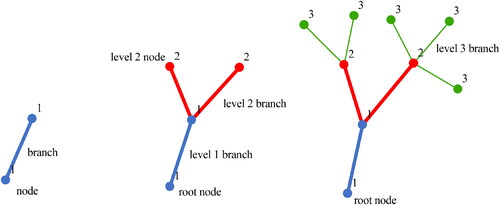
The Tree-like model is an application of the Geotree in the development of OSM buildings. OSM buildings evolve within the framework of urban systems, where each city within the urban system can be regarded as a node in the Tree-like model. Based on the level of urban elements, cities can be categorized into different types, with the highest level being first-tier cities, followed by second-tier cities, and so forth. According to the city type, nodes can be further classified into one, two, three nodes, and so on. The first city in the level one node will be considered as the "root node" of the Tree-like model. Additionally, the connections between nodes are defined as "branches," representing the paths of OSM building evolution. The connection between any two level one node is referred to as a level one branch, the connection between a level one node and a level two node is a level two branch, and the connection between a level two node and a level three node is a level three branch, and so on. The branch level indicates the relational hierarchy of OSM building development between nodes. Using this approach, starting from the root node, branches emanate from the bottom, connecting all nodes in the region to form a Tree-like model ().
Figure 2. Tree-like model structure.
4.2. Growth mechanisms of Tree-like model
The Tree-like model integrates the principles of the Gravity model and Geotree. The fundamental principle of the Geotree is based on the universal laws of physics, wherein individual evolution drives collective evolution (Wang et al. Citation2014). In other words, spontaneous contributions to geographical information are made by individuals in a disorderly and irregular manner at the individual level but exhibit significant regularity at the collective level. This regularity, when mapped in urban systems, is represented by the variation in the frequency of contribution behaviors in cities, reflecting changes in the volume of OSM buildings.
Typically, the contribution behavior of a single volunteer (creating an OSM building element) is more likely to occur in the city where the volunteer resides or is familiar (Neis and Zipf Citation2012; Quinn Citation2017). Therefore, concerning cities, the number of OSM data contributions each city receives depends on the number of volunteers interested in that city. The ability of a city to attract OSM volunteers is highly correlated with the city’s level of resource advantage, such as economic development, population mobility density, and education levels (Arsanjani and Bakillah Citation2015; Neis, Zielstra, and Zipf Citation2013; Su et al. Citation2017; Zia et al. Citation2019). Changes in the level of resource advantage result in certain regularities in urban development, influencing the contribution behavior of OSM volunteers and, consequently, the evolution and expansion of OSM building in the urban system. This is manifested by resource-advantaged cities forming regional locational centers, and these centers exert a strong attraction on surrounding cities, prompting the surrounding cities to become the next level of resource center cities. This mutual attraction is essentially a manifestation of the exchange of material, capabilities, and information between cities (Fan et al. Citation2017). This mutual attraction causes the contribution behaviors of contributors to be interconnected between cities, leading to changes in the quantity of OSM buildings. We call this mutual connection OSM building contribution connectivity. The stronger the OSM building contribution connectivity between cities, the more closely connected the development of OSM buildings between these two cities, and the greater the impact. Therefore, by calculating the OSM building contribution connectivity between cities, we can determine the expansion direction and evolution path of the Tree-like model.
In theory, the expansion of OSM buildings will develop toward the city with the maximum OSM building contribution connectivity. However, volunteer mobility is highly complex, typically manifesting in a network structure. For instance, volunteers from Shanghai may edit data in Suzhou, Nanjing, or Hefei, while volunteers from other cities may also contribute to editing data in Shanghai. Nevertheless, upon summarizing the editing behaviors of OSM volunteers, we find that crowdsourcing activities between adjacent cities remain predominant. For instance, Shanghai, the most typical city in the Yangtze River Delta, has 799 local volunteers, of which 521 volunteers have also contributed OSM building data in other cities, as shown in . We observed that Shanghai volunteers edited 2767, 2008, 1627, 997, 313, and 56 building polygon objects in neighboring cities such as Hangzhou, Zhoushan, Suzhou, Ningbo, Jiaxing, and Nantong, respectively. The sum of Hangzhou, Zhoushan, Suzhou, Ningbo, Jiaxing, and Nantong is 7768, account for 7768/11501 = 67.54%. Furthermore, according to the neighborhood effect, whereby lack of contributions in one area can be compensated by contributions from another area, especially the strongest in the neighborhood areas (Bright, De Sabbata, and Lee Citation2018). Therefore, in this study, we stipulate that the expansion path of OSM buildings only occurs between adjacent cities and use a Voronoi diagram to determine the adjacency relationships between cities. Thus, the growth direction of the Tree-like model is jointly determined by the adjacency relationships between nodes and the magnitude of the OSM building contribution connectivity.
Table 4. The number of OSM building data edits by Shanghai volunteers in other cities.
The growth mechanism of the Tree-like model explains the evolution direction and sequence of OSM buildings in the urban system. It provides a spatial-temporal integrated explanation for the evolution of OSM buildings, not only elucidating the formation of the spatial pattern of OSM buildings but also reconstructing the time series of the spatial pattern of OSM buildings, describing the evolution path of OSM buildings.
4.3. Construction of the Tree-like model
4.3.1. The urban OSM building contribution connectivity
The calculation of the OSM building contribution connectivity between cities is an improvement based on the Gravity model. The Gravity model is a geographical spatial analysis model that expresses the strength of connections between geographic regions based on the universal law of physical gravity. Currently, the Gravity model is widely applied in the GIS field for issues like urban analysis (Bhatt and Minal Citation2022; Dock, Song, and Lu Citation2015) and urban economic connectivity studies (Golovko and Sahin Citation2021; Morley, Rossello, and Santana-Gallego 2014). The basic form of the Gravity model is:
(1)
(1)
In this context, where and
represent different geographical target elements,
denotes the magnitude of attraction or gravity between entity
and entity
The parameter
is a model parameter, while
and
represent the mass or size of entities
and
respectively. Additionally,
signifies the resistance parameter between entity
and entity
Typically, distance, time, or cost is selected as the resistance parameter.
The Gravity model can not only be used for mobility studies between cities but also for estimating the connectivity of OSM building contributions between cities. Therefore, we modify the Gravity model to a formula for calculating the OSM building contribution connectivity between cities In general, the parameters
、
、and
have values of 1, and the formula for the attraction of OSM buildings between two cities can be expressed as:
(2)
(2)
where
represents the OSM building contribution connectivity between city
and city
while
signifies the distance between city
and city
and
are utilized to describe the comprehensive development quality of OSM buildings in city
and city
respectively.
To better determine the comprehensive quality of urban OSM building development, we use Pearson correlation analysis to further verify the degree of correlation between influencing factors and OSM buildings. OSM buildings depend on the development of cities, and their data growth is subject to the constraints of natural conditions and numerous human factors (Arsanjani and Bakillah Citation2015; Neis et al. Citation2013; Su et al. Citation2017; Zia et al. Citation2019). Through literature analysis, it is found that GDP (Arsanjani and Bakillah Citation2015), the number of individuals with higher education (Zia et al. Citation2019), population size (Girres and Touya Citation2010; Su et al. Citation2017), the number of males (Zielstra and Zipf Citation2010), and age play important roles in the growth of OSM data for a city or region. Therefore, this study analyzes the correlation between GDP, a permanent population, and the number of educated individuals with the quantity of OSM buildings, using data from the seventh population census and statistical yearbooks. To eliminate the influence of outliers on the results, after data analysis, we treated the data for Quzhou and Zhenjiang as outliers and removed them. The analysis results are shown in .
Table 5. Pearson correlation analysis results.
The Pearson correlation coefficient, ranges from −1 to 1, with values closer to 1 indicating a stronger positive correlation between two variables. As shown in , the correlation coefficients for GDP, a permanent population, and an educated population with OSM building quantity are 0.879, 0.805, and 0.705, respectively. The significance test results are all 0. This indicates a significant positive correlation between GDP, permanent population, educated population, and the quantity of OSM buildings in the Yangtze River Delta region of China. Among them, GDP shows the strongest correlation, while the correlation is weakest with the educated population.
Based on the analysis results, this study employs GDP data (representing the main potential for OSM growth in a city) and the quantity of OSM buildings (indicating the outcome of OSM data growth in a city) to assess the comprehensive quality of urban OSM building development. The expression for the comprehensive quality of urban OSM building development is as follows:
(3)
(3)
Finally, the formula expressing the OSM building contribution connectivity between cities is given by:
(4)
(4)
where
and
represent different cities,
denotes the OSM building contribution connectivity between cities,
represents the city’s GDP,
represents the quantity of OSM buildings in the city, and
represents the distance between city
and city
4.3.2. Determination of the level of nodes
Each city in the urban system can be considered a node in the Tree-like model, classified into different levels based on urban element hierarchy. Studies indicate that buildings, as urban elements, are influenced by urban productivity and resource allocation. Factors such as population, land area, and economic conditions over a specific period impact the growth of OSM buildings, with population being a key factor (Fan et al. Citation2017). Additionally, the Pearson correlation analysis results, as presented in Section 3.3.1, indicate that population is a significant factor influencing the level of OSM building development. Therefore, this study categorizes nodes based on the level of permanent urban population. According to the standards for adjusting urban scales released in 2014 by the State Council, cities are classified into Megacity, Supercity, Type I city, Type II city, Medium-sized city, Type I compact city, and Type II compact city. The node levels correspond to the city types, as shown in .
Table 6. The standard for Chinese urban scale division.
4.3.3. Branch growth rules
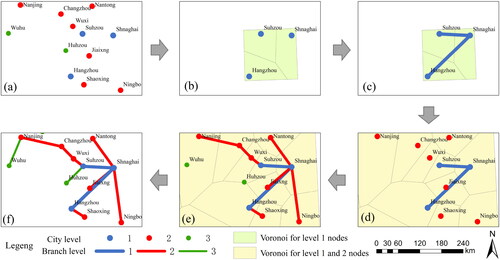
In theory, the OSM building contribution connectivity between each city can be calculated and visualized to form a network of OSM building evolutionary development. However, the network may not effectively convey the main framework of the OSM building evolution. Therefore, based on the strength of OSM building contribution connectivity between cities, we construct the main framework of OSM building evolution. Specifically, in the construction process of the Tree-like model, the evolution paths grow from the root node upwards. The growth direction of the paths is jointly determined by the adjacency relationships between nodes and the magnitude of OSM building contribution connectivity. Simultaneously, in the process of branch construction, adherence to the following rules is essential:
According to the neighborhood effect, branch growth occurs only between two adjacent nodes, with adjacency determined by a Voronoi diagram.
The growth direction of branches should point from the root node toward the node with the highest OSM building contribution connectivity and progressively grow upward.
There should be no degradation in node levels; the Tree-like model, during its growth process, maintains the regularity that cities continue to develop, and OSM building grows with urban development, following the rule of non-degradation in node levels in spatial evolution.
illustrates the specific steps of constructing the Tree-like model. The first step involves determining node levels and the root node. Then, a Voronoi diagram is created for the level one nodes to establish adjacency relationships, followed by the construction of level one branches based on the magnitude of OSM building contribution connectivity and adjacency relationships. Once all level one nodes are connected, a new Voronoi diagram is constructed for both level one and level two nodes, determining new adjacency relationships between nodes. Subsequently, level two branches are constructed based on the new adjacency relationships and the magnitude of OSM building contribution connectivity. This process continues iteratively until all nodes in the region are connected, forming a complete Tree-like model.
Figure 3. The specific steps of constructing the Tree-like model, (a) determining node levels and the root node, (b) Voronoi for level 1 nodes, (c) construction of level 1 branches, (d) voronoi for level 1 and 2 nodes, (e) construction of level 2 branches, (f) Tree-like model.
5. Results and analysis
5.1. Spatiotemporal characteristics of OSM buildings
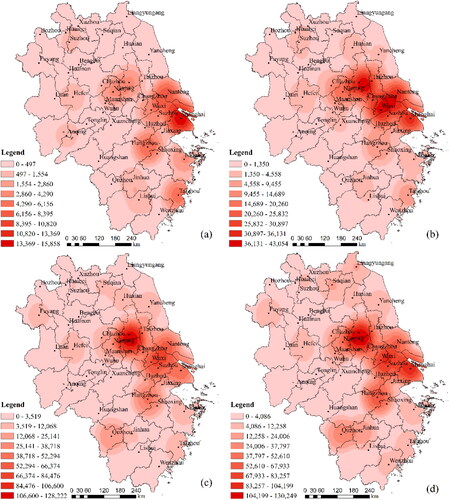
2014, 2016, 2018 and 2020 OSM buildings in the Yangtze River Delta region were linked to the administrative unit vector data. Based on statistical data on the quantity of OSM buildings, this study categorized them into five classes using ArcMap software. Subsequently, it employed a stratified coloring technique to depict the spatial distribution and changes in OSM building data within the Yangtze River Delta region from 2014 to 2020. The varying shades of color reflect the differing quantities of OSM buildings across different areas.
According to , in 2014, among the 41 prefecture-level cities in the Yangtze River Delta region, only Shanghai had an OSM building quantity exceeding 10,000, followed by Nantong with a somewhat lesser count, while Hangzhou fell within the range of 2,500 to 5,000 buildings. By 2016 (), five cities surpassed 10,000 OSM buildings, primarily concentrated in the southern Jiangsu region adjacent to Shanghai. Among them, both Shanghai and Nantong had over 20,000 OSM buildings, while Nanjing, Suzhou, Changzhou, and Hangzhou exceeded 5,000 buildings, gradually forming a high-value cluster of OSM building data composed of cities in southern Jiangsu and Shanghai. This clustering became more pronounced after 2018 (), where, apart from Hangzhou, six cities had over 20,000 OSM buildings, with five located in this specific region. Compared to the spatial distribution pattern in 2018, by 2020 (), both Nanjing and Quzhou had surpassed 20,000 OSM buildings, forming two high-value regions of OSM building data: one stretching from Nanjing to Shanghai, and the other in the central-western Zhejiang region. Overall, the OSM building data in the Yangtze River Delta region exhibits continuous growth over time, but significant spatial heterogeneity, with a concentration mainly in the eastern and southern parts of the region, while remote cities such as Lishui and Bozhou have lower quantities of data with slower growth rates.
Figure 4. Spatial distribution of OSM buildings data from 2014 to 2020, (a) the spatial distribution for 2014, (b) the spatial distribution for 2016, (c) the spatial distribution for 2018, (d) the spatial distribution for 2020.
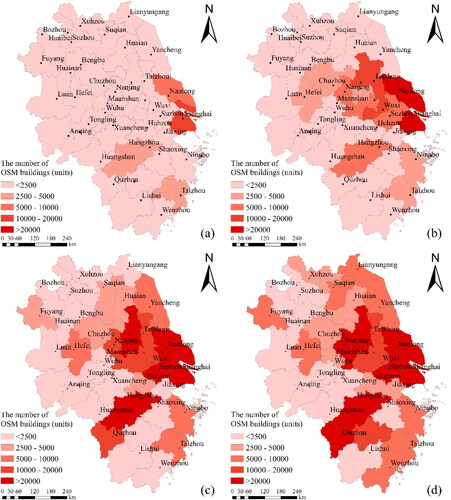
As the core cities in the Yangtze River Delta region, Shanghai, Nanjing, and Hangzhou have large populations and strong economic development, making them attractive to contributors and more likely to generate crowd-sourced activities. Consequently, they exhibit relatively higher quantities of OpenStreetMap (OSM) building data. Cities such as Nantong, Wuxi, Yangzhou, and Changzhou, located near Shanghai, benefit from its influence, resulting in active economic activities and high population mobility, which are the main reasons behind the higher number of OSM buildings. On the other hand, remote cities like Bozhou and Huainan, situated in less developed regions with smaller populations, experience slower growth in OSM building data due to slower economic development. It is worth noting that in the Yangtze River Delta region, some prefecture-level cities have experienced a significant increase in OSM building data. For instance, Quzhou had fewer than 2500 buildings in 2016 but witnessed a notable surge to over 10,000 buildings in 2018. This indicates a rapid growth in OSM building quantity, potentially due to bulk imports or enterprise editing practices.
To further determine the spatial distribution and clustering characteristics of OSM buildings in the Yangtze River Delta region, we used the kernel density estimation methodology to calculate the unit density of features within their neighborhood, describing the distribution and clustering characteristics of OSM building in the study area (Xin et al. Citation2022). In our experiment, a bandwidth value of 0.8 meters is chosen based on empirical evidence (Wu et al. Citation2018). Then, for the purpose of presentation, we employed the natural breakpoints method to classify the density into nine levels, thereby obtaining a classification of OSM building data density.
In general, the OSM building data in the Yangtze River Delta region from 2014 to 2022 exhibited significant clustering characteristics. Shanghai and the southern part of Jiangsu maintained an absolute leading advantage. Additionally, the quantity of OSM building data in Nanjing, Zhenjiang, and Quzhou regions has been continuously increasing, indicating an enhanced development level of urban OSM building data, making them the regional centers. As time passed, multiple regional centers gradually connected to form a "Nanjing-Suzhou-Shanghai-Hangzhou" high-density strip spatial distribution pattern.
Specifically, the Shanghai-Zhenjiang area served as the high-density core region, while the low-density core region was predominantly found in remote prefecture-level cities closer to the inland. Over time, the high-density core zone of OSM building data expanded and shifted. In 2014 (), OSM building data primarily clustered in the local area centered around Shanghai, followed by Hangzhou, Nanjing, and Zhenjiang regions, yet still exhibited certain clustering characteristics. By 2016 (), the high-density core zone of OSM showed a strip-like distribution, mainly concentrated along the Shanghai-Zhenjiang area, with continuously increasing density values. In 2018 (), the high-density core zone of OSM building data shifted from Shanghai to Zhenjiang, demonstrating an extremely high density distribution. It is noteworthy that in 2018, Zhenjiang had over 20,000 more OSM buildings than Shanghai. However, this phenomenon did not persist, and by 2020 (), OSM building data was mainly distributed in Shanghai, Hangzhou, Zhenjiang, Suzhou, and their surrounding areas, exhibiting a strip-like core density distribution structure, while other regions revealed relatively lower clustering features, such as Suqian, Quzhou, and Taizhou, among other prefecture-level cities. It can be observed that the high-density core zone of OSM building data in the Yangtze River Delta region is constantly changing but remains centered around Shanghai. This is because the Yangtze River Delta region is one of the most economically prosperous areas in China, with a high degree of openness, attracting many young people with a keen interest in the OSM project. Shanghai, as the core city of the Yangtze River Delta region, has become the leader of the OSM project, driving the development of OSM building data in the surrounding areas. Therefore, although the density core regions continuously shift over time, they are always around the Shanghai area.
Figure 5. Result of OSM building kernel density in Yangtze River Delta.
In conclusion, the central and eastern regions of the Yangtze River Delta, including Shanghai, Hangzhou, Nantong, Zhenjiang, and Suzhou, are the primary hotspots for clustering of OSM building data. It can be observed that the spatial distribution of OSM building data leans towards economically vibrant areas, and the range of clustering expands with time, with the high-density core zone undergoing changes.
5.2. Tree-like model of the Yangtze River Delta
We selected data from 2014, 2016, 2018 and 2020 to construct the Tree-like models (). These data cover nearly a decade, which facilitates a complete description of the spatial evolution process of OSM buildings in the Yangtze River Delta region and reveals the expansion pattern of OSM buildings. Arabic numerals in the Figure denote the main evolutionary paths within the Tree-like model.
Figure 6. Tree-like model of the Yangtze River Delta from 2014 to 2020, (a) Tree-like model results for 2014, (b) Tree-like model results for 2016, (c) Tree-like model results for 2018, (d) Tree-like model results for 2020.
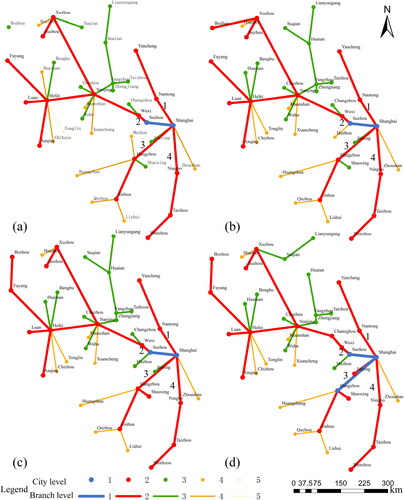
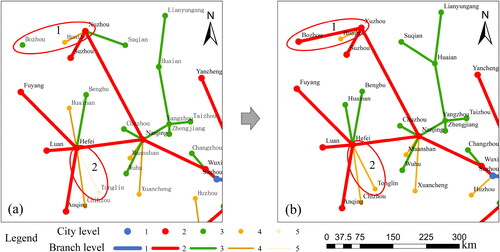
As illustrated in , the 2014 Tree-like model, the root node is Shanghai, predominantly consists of the level two, three, and four branches, forming four major evolutionary paths (Path 1: Shanghai-Nantong-Yancheng; Path 2: Shanghai-Suzhou-Wuxi-Nanjing-Xuzhou/Hefei; Path 3: Shanghai-Hangzhou-Jinhua; Path 4: Shanghai-Ningbo-Taizhou-Wenzhou). Irregularities in path development are evident in variations in branch quantity and levels. Paths 1 and 4 are entirely composed of the level two branches, while Paths 2 and 3 exhibit branches of different levels, predominantly following a three-level structure (2-3-4), with level 2 as the main part. In addition, the number of Level 2 branches in the four paths is 2, 6, 2, and 3, respectively, with Path 2 having the highest number of nodes and the most complete branching hierarchy, which is the main evolutionary path of the Tree-like model. The irregularities in path growth reflect the spatial heterogeneity of OSM building development, closely linked to the economic conditions and population sizes of nodes. In comparison to 2014, the major changes in the 2016 Tree-like model occurred in Path 2 (). Growth in branch levels is observed, such as “Hefei-Tongling” transitioning from a level five branch to a level four branch, and “Hefei-Huainan” progressing from a level four branch to a level three branch. Simultaneously, “Bozhou” transforms from a data-empty state to a level two branch, “Xuzhou-Bozhou” (). The growth in branch levels indicates the OSM buildings have acquired development within a timeframe. This development is not uniform across the urban system; however, as time progresses, the differences in city sizes diminish, and the strengthening OSM building contribution connectivity between cities leads to the gradual expansion and development of OSM buildings towards surrounding cities, resulting in this irregular growth of branch levels and the filling of data gaps.
Figure 7. Growth of branch levels from 2014 to 2016, (a) Tree-like model results for 2014 and (b) Tree-like model results for 2016.
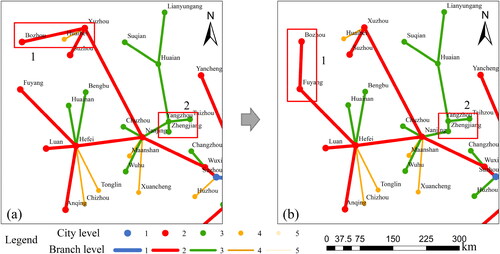
In 2018, a similar growth in branch levels was observed (), with “Suzhou-Huzhou” in Path 2 growing into a level three branch and “Hangzhou-Shaoxing” in Path 3 growing into a level two branch. Additionally, a new phenomenon emerges—branch path transformations. As shown in , the path connecting Bozhou transforms from “Xuzhou-Bozhou” in 2016 to “Fuyang-Bozhou” in 2018, and the path connected to Nanjing shifts from "Nanjing-Yangzhou" to “Nanjing-Zhenjiang.” The imbalance in the development of OSM buildings is a major factor driving path transformations. Contributor behaviors are not static; with the frequent population movements between cities over time, contributors also migrate. This migration moderately impacts the contribution behaviors of OSM buildings. As the OSM building contribution connectivity with adjacent nodes surpasses the previous ones and reaches their maximum, branch paths change. In the 2020 Tree-like model (), there is not only growth in branch levels but also transformations in some branch paths. For instance, “Shanghai-Hangzhou” grows from a level 2 branch to a level 1 branch, “Shanghai-Jiaxing” and “Wuxi-Changzhou” progress from level 3 branches to level 2 branches, and the level 2 branch connecting to Nanjing, “Wuxi-Nanjing,” is replaced by “Changzhou-Nanjing.” Notably, unlike previous years, the growth in branch levels in 2020 primarily occurs in higher-level branches (2 and 3 levels), while lower-level branches undergo minimal changes. This signifies that after reaching a certain scale, urban size becomes a primary obstacle to the development of OSM buildings, a phenomenon more pronounced in small cities, whereas large cities, with abundant resources, strong economic vitality, and the ability to attract talent, allow for a more extended period of OSM building development, delaying the hindrance caused by urban size. This is because larger cities, with their greater area and population, offer more buildings for volunteer editors. For instance, in Shanghai, the increment of OSM building data between 2014 and 2020 exceeded 10,000 every two years, with the highest increase occurring from 2018 to 2020, reaching 29,234. In contrast, many smaller cities experienced smaller increments during the same period, with the data growth from 2018 to 2020 being lower than in previous years. Cities like Bozhou, Chuzhou, and Chizhou even saw negative growth in building data.
Figure 8. Branch path transformations from 2016 to 2018, (a) Tree-like model results for 2016 and (b) Tree-like model results for 2018.
Through the aforementioned analysis, it is evident that over the past decade, OSM building growth has been rapid, predominantly evolving along large cities. Path 2 emerges as the main evolutionary path, connecting major cities in the Yangtze River Delta region, such as Shanghai, Suzhou, Wuxi, Nanjing, Xuzhou, and Hefei. The close economic ties and frequent population movements between these large cities enhance the OSM building contribution connectivity, serving as the primary driving force behind the formation of this evolutionary pattern. Additionally, around the large cities on evolutionary paths, there are local radiating structures, connecting nodes of different levels, forming regional central cities like Nanjing, Hefei, and Hangzhou. Within a local context, regional central cities, while gaining more resource advantages, also induce a siphon effect on surrounding cities. This prompts population migration from small cities to nearby regional central cities, strengthening the OSM building contribution connectivity of regional central cities to surrounding cities, thereby creating a local radiating evolutionary structure. Meanwhile, highly urbanized, economically vibrant, and informatively advanced cities such as Shanghai, Suzhou, Hangzhou, Nanjing, and Hefei exhibit OSM building development levels significantly higher than other cities. Over the temporal sequence, as time progresses, the gap between cities gradually diminishes, and OSM buildings progressively expand from large to small cities. However, when OSM buildings in a city reach a certain scale, urban size begins to limit contributor crowdsourcing behaviors and the development of OSM buildings.
6. Discussion
In the realm of VGI, all individuals can be a contributor to data under the VGI pattern (Boulos et al. Citation2011; Goodchild Citation2007). While contributions at the individual level may appear unordered, significant regularities emerge at the collective level. This regularity is reflected in urban systems as variations in the frequency of contributory actions, mean the changes in OSM building volume. However, the development and evolution of OSM buildings are influenced by various factors, including the concentration of urban resources (Arsanjani and Bakillah Citation2015; Neis et al. Citation2013; Su et al. Citation2017; Zia et al. Citation2019). Cities with robust economic vitality and concentrated populations are better positioned for the construction and development of OSM buildings. Over time, increased exchanges in substance, energy, and information between cities drive the evolution of OSM building across urban areas. This evolution is elucidated through the Tree-like model, amalgamating elements of Gravity models and Geotree. Gravity models find extensive application in studying economic trade correlations between cities (Golovko and Sahin Citation2021; Morley et al. Citation2014) and urban analysis (Bhatt and Minal Citation2022; Dock et al. Citation2015). On the other hand, Geotree, initially proposed by Wang et al. [Wang], is widely used in studies related to urban cluster expansion (Fan et al. Citation2017; Jing et al. Citation2022; Sun et al. Citation2023; Wang et al. Citation2012), documentation analysis (Duan et al. Citation2021; Liang and Xu Citation2023), public health services (Lei et al. Citation2023; Wang and Wang Citation2020) and ecological and environmental changes (Tan et al. Citation2023; Zhou et al. Citation2022). In the Tree-like model, cities serve as nodes, and the growth direction of branches is jointly determined by the adjacency relationships between nodes and the magnitude of OSM building contribution connectivity. Theoretically, OSM building expansion should proceed toward nodes with the highest OSM building contribution connectivity magnitudes. However, adhering to the neighborhood effect, whereby lack of contributions in one area can be compensated by contributions from another area, especially strongest in neighborhood areas (Bright et al. Citation2018). Therefore, in this study, we specify that OSM building expansion paths only occur between adjacent nodes, with adjacency relationships determined by Voronoi diagrams.
This study represents the initial attempt to investigate the spatiotemporal evolution of OSM buildings in China, focusing on the Yangtze River Delta region at the city level. It visually and effectively demonstrates the spatiotemporal evolution of OSM building across urban systems, employing the Tree-like model. Furthermore, this research aids in comprehending the current state of OSM buildings in China. The findings contribute to enriching the rapidly expanding VGI research landscape globally, enhancing the diversity of OSM research and increasing the ubiquity and usability of OSM data.
However, several limitations also require us to improve. Firstly, we employed urban statistical yearbook data, including permanent population and GDP, to determine node parameters for the model. These data are subject to varying degrees of unknown bias. Secondly, for simplicity, we solely utilized a permanent population to determine node levels, introducing a certain degree of prejudice. The use of comprehensive indicators for determining node levels would better express the complex interactions between cities and regions. Additionally, due to the limitations of OSM data in developing countries and the non-uniform distribution of OSM data globally (Herfort et al. Citation2023; Yang et al. Citation2016), our study is based on the relatively high urbanization, economically developed Yangtze River Delta region, with relatively high OSM building density. Further improvement and validation are required for calculating OSM building contribution connectivity magnitudes and applying the Tree-like model in areas with lower economic development and urbanization levels. Finally, various indicators can be used to describe the development level of OSM buildings in cities, and the calculation of OSM building contribution connectivity magnitudes can consider incorporating additional influencing factors, such as OSM road network length, for a comprehensive portrayal of OSM building development in cities. Moreover, the temporal and spatial expansion and evolution of OSM buildings involve complex changes across different spatial scales. Apart from considering expansion in urban clusters, the expansion and evolution of OSM buildings within individual cities and on a large-scale background are equally significant. The exploration of OSM building evolution across different spatial scales using Tree-like models holds promising prospects.
7. Conclusions
In this article, we propose an OSM building data evolution model combining gravity model and Tree-like model. The proposed method firstly evaluates the correlation between the development of OSM building data between two cities through an improved gravity model, and then constructs OSM building data Tree-like model for the years 2014, 2016, 2018, and 2020. It clearly depicts the spatiotemporal expansion and evolution of OSM building data over time in Yangtze River Delta region. To the best of the authors’ knowledge, this is the first study on the expansion and evolution of OSM building data in Chinese cities. The conclusions as follows:
From 2012 to 2014, OSM buildings in the Yangtze River Delta region increased nearly twelvefold, averaging a 30% annual increase, revealing significant spatial variability in growth. Specifically, small cities such as Chizhou and Lishui have low data volumes and limited growth in OSM building numbers, while large cities like Shanghai, Nanjing, and Hefei experienced rapid growth with substantial data volumes.
OSM building development in the Yangtze River Delta region primarily along the evolution of large cities. The predominant evolution path is Shanghai-Suzhou-Wuxi-Nanjing-Xuzhou/Hefei, forming a local radial development structure around large cities. Over time, the gaps between cities diminished, and OSM buildings expanded gradually from large to medium and small cities.
The development of OSM buildings correlates closely with urban economic indicators, population size, and educational levels. However, as OSM building development reaches a certain scale, city size tends to constrain contributor crowd-sourcing behavior and the further development of OSM buildings.
Through the research presented in this article, we have gained a clearer understanding of the development status and trends of OSM building data in the Yangtze River Delta region of China. Currently, in China, encouraging OSM crowdsourcing activities in major cities yields better results due to their larger population, greater number of urban structures, and denser distribution of buildings. Additionally, extending OSM assistance activities to the surrounding areas of major cities and along the spatial chains formed by these cities can enhance effectiveness.
However, several issues require further investigation. First, the classification of cities deserves further exploration, with consideration given to the potential of OSM crowdsourcing in city classification. Finally, it is essential to examine how OSM crowdsourcing connects between cities. Integrating more nuanced connections into the methods proposed in this article would improve research outcomes.
Acknowledgement
This work was financially supported by the National Natural Science Foundation of China (Grant No. 42361069, 42001344, and 42330108), and the Key Research and Development Program Project of Jiangxi Province (Grant No. 20232BBE50021), and Jiangxi Provincial water Conservancy Science and Technology Project (Grant No. 202325ZDKT12), and Open Foundation of Jiangxi Provincial Key Laboratory of Soil Erosion and Prevention (Grant No.2023SKTR03).
Disclosure statement
The authors declare no conflicts of interest. In the collection, analyses, or interpretation of data; in the writing of the manuscript, or in the decision to publish the results.
Data availability statement
The data presented in this study are publicly accessible.
Additional information
Funding
References
- Ahmouda A, Hochmair HH, Cvetojevic S. 2018. Analyzing the effect of earthquakes on OpenStreetMap contribution patterns and tweeting activities. Geo-Spatial Informat Sci. 21(3):195–212. doi: 10.1080/10095020.2018.1498666.
- Anderson J, Sarkar D, Palen L. 2019. Corporate editors in the evolving landscape of OpenStreetMap. IJGI. 8(5):232. doi: 10.3390/ijgi8050232.
- Arsanjani JJ, Bakillah M. 2015. Understanding the potential relationship between the socio-economic variables and contributions to OpenStreetMap. Int J Digital Earth. 8(11):861–876. doi: 10.1080/17538947.2014.951081.
- Barranquero M, Olmedo A, Gómez J, Tayebi A, Hellín CJ, de Adana FS. 2023. Automatic 3D building reconstruction from OpenStreetMap and LiDAR using convolutional neural networks. Sensors (Basel). 23(5):2444. doi: 10.3390/s23052444.
- Bhatt, Deepika, Minal, 2022. ‘GIS and gravity model-based accessibility measure for Delhi metro’. Iran J Sci Technol Trans Civ Eng46(4):3411–3428. doi: 10.1007/s40996-021-00795-5.
- Boulos MNK, Resch B, Crowley DN, Breslin JG, Sohn G, Burtner R, Pike WA, Jezierski E, Chuang KYS. 2011. Crowdsourcing, citizen sensing and sensor web technologies for public and environmental health surveillance and crisis management: trends, OGC standards and application examples. Int J Health Geogr. 10:67. doi: 10.1186/1476-072X-10-67.
- Bright J, De Sabbata S, Lee S. 2018. Geodemographic biases in Crowdsourced knowledge websites: do neighbours fill in the blanks? GeoJournal. 83(3):427–440. doi: 10.1007/s10708-017-9778-7.
- Bshouty E, Shafir A, Dalyot S. 2020. Towards the generation of 3D OpenStreetMap building models from single contributed photographs. Comput Environ Urban Syst. 79:101421. doi: 10.1016/j.compenvurbsys.2019.101421.
- Corcoran P, Mooney P. 2013. Characterising the metric and topological evolution of OpenStreetMap network representations. Eur Phys J Spec Top. 215(1):109–122. doi: 10.1140/epjst/e2013-01718-2.
- Corcoran P, Mooney P, Bertolotto M. 2013. Analysing the growth of OpenStreetMap networks. Spatial Stat. 3:21–32. doi: 10.1016/j.spasta.2013.01.002.
- Dock JP, Song W, Lu J. 2015. Evaluation of dine-in restaurant location and competitiveness: applications of gravity modeling in Jefferson County, Kentucky. Appl Geogr. 60:204–209. doi: 10.1016/j.apgeog.2014.11.008.
- Duan CS, Zuo SD, Wu ZF, Qiu Y, Wang JF, Lei YH, Liao H, Ren Y. 2021. A review of research hotspots and trends in biogenic volatile organic compounds (BVOCs) emissions combining bibliometrics with evolution tree methods. Environ Res Lett. 16(1):013003. doi: 10.1088/1748-9326/abcee9.
- Fan Y, Yu GM, He ZY. 2017. Origin, spatial pattern, and evolution of urban system: testing a hypothesis of “urban tree.” Habitat Int. 59:60–70. doi: 10.1016/j.habitatint.2016.11.012.
- Fritz S, See L, Carlson T, Haklay M, Oliver JL, Fraisl D, Mondardini R, Brocklehurst M, Shanley LA, Schade S, et al. 2019. Citizen science and the united nations sustainable development goals. Nat Sustain. 2(10):922–930. doi: 10.1038/s41893-019-0390-3.
- Girres JF, Touya G. 2010. Quality assessment of the French OpenStreetMap Dataset. Trans GIS. 14(4):435–459. doi: 10.1111/j.1467-9671.2010.01203.x.
- Goetz M, Zipf A. 2012. Towards defining a framework for the automatic derivation of 3D CityGML models from volunteered geographic information. Int J 3-D Informat Model. 1(2):1–16. doi: 10.4018/ij3dim.2012040101.
- Goldblatt R, Jones N, Mannix J. 2020. Assessing OpenStreetMap completeness for management of natural disaster by means of remote sensing: a case study of three small island states (Haiti, Dominica and St. Lucia). Remote Sens. 12(1):118. doi: 10.3390/rs12010118.
- Golovko A, Sahin H. 2021. Analysis of International Trade Integration of Eurasian Countries: gravity Model Approach. Eurasian Econ Rev. 11(3):519–548. doi: 10.1007/s40822-021-00168-3.
- Goodchild MF. 2007. Citizens as sensors: the world of volunteered geography. GeoJournal. 69(4):211–221. doi: 10.1007/s10708-007-9111-y.
- Hagenauer J, Helbich M. 2012. Mining urban land-use patterns from volunteered geographic information by means of genetic algorithms and artificial neural networks. Int J Geogr Informat Sci. 26(6):963–982. doi: 10.1080/13658816.2011.619501.
- Haklay M, Basiouka S, Antoniou V, Ather A. 2010. How many volunteers does it take to map an area well? The validity of Linus’ law to volunteered geographic information. Cartographic J. 47(4):315–322. doi: 10.1179/000870410X12911304958827.
- Hecht R, Kunze C, Hahmann S. 2013. Measuring completeness of building footprints in OpenStreetMap over space and time. IJGI. 2(4):1066–1091. doi: 10.3390/ijgi2041066.
- Herfort B, Lautenbach S, Albuquerque JPd, Anderson J, Zipf A. 2021. The evolution of humanitarian mapping within the OpenStreetMap community. Sci Rep. 11(1):3037. doi: 10.1038/s41598-021-82404-z.
- Herfort B, Lautenbach S, Albuquerque JPd, Anderson J, Zipf A. 2023. A spatio-temporal analysis investigating completeness and inequalities of global urban building data in OpenStreetMap. Nat Commun. 14(1):3985. doi: 10.1038/s41467-023-39698-6.
- Hoek JVD, Friedrich HKK, Ballasiotes A, Peters LER, Wrathall D. 2021. Development after displacement: evaluating the utility of OpenStreetMap data for monitoring sustainable development goal progress in refugee settlements. Int J Geo-Informat. 10(3):153.
- Jing SQ, Wang JF, Xu CD, Yang JT. 2022. Tree-like evolution pathways of global urban land expansion. J Clean Product. 378:134562. doi: 10.1016/j.jclepro.2022.134562.
- Jokar Arsanjani J, Helbich M, Bakillah M, Loos L. 2015. The emergence and evolution of OpenStreetMap: a cellular automata approach. Int J Digital Earth. 8(1):76–90. doi: 10.1080/17538947.2013.847125.
- Kilsedar CE, Oxoli D, Frassinelli F, Montani M, Minghini M. 2017. Humanitarian Mapping within a Student Association: poliMappers. In FOSS4G-IT 2017
- Le Guilcher A, Olteanu-Raimond AM, Balde MB. 2022. Analysis of massive imports of open data in Openstreetmap Database: a study case for France. ISPRS Ann Photogramm Remote Sens Spatial Inf Sci. VV-4-2022–2022:99–106. doi: 10.5194/isprs-annals-V-4-2022-99-2022.
- Lei YH, Wang JF, Wang Y, Xu CD. 2023. Geographical evolutionary pathway of global tuberculosis incidence trends. Bmc Public Health. 23(1):755. doi: 10.1186/s12889-023-15553-7.
- Liang YT, Xu CD. 2023. Knowledge diffusion of geodetector: a perspective of the literature review and Geotree. Heliyon. 9(9):e19651. doi: 10.1016/j.heliyon.2023.e19651.
- Liu B, Shi Y, Li D-J, Wang Y-D, Fernandez G, Tsou M-H. 2020. An economic development evaluation based on the OpenStreetMap road network density: the case study of 85 cities in China. IJGI. 9(9):517. doi: 10.3390/ijgi9090517.
- Liu LJ, Fu ZY, Xia Y, Lin H, Ding XH, Liao KT. 2023. A building polygonal object matching method based on minimum bounding rectangle combinatorial optimization and relaxation labeling. Trans Gis. 27(2):541–563. doi: 10.1111/tgis.13039.
- Mann D, Rankavat S, Joshi PK. 2022. Road network drives urban ecosystems-a longitudinal analysis of impact of roads in the Central Himalaya. Geocarto Int. 37(4):1100–1125. doi: 10.1080/10106049.2020.1750064.
- Minaei M. 2020. Evolution, density and completeness of OpenStreetMap Road networks in developing countries: the case of Iran. Appl Geogr. 119:102246. doi: 10.1016/j.apgeog.2020.102246.
- Minghini M, Coetzee S, Grinberger AY, Yeboah G, Juhász L, Mooney P. 2020. Editorial : OpenStreetMap research in the COVID-19 Era. In Proceedings of the Academic Track at the State of the Map 2020 Online Conference; 4-5 July. doi: 10.5281/zenodo.3922054.
- Mohammadi N, Sedaghat A, Khademi M. 2022. Mining spatiotemporal growth pattern of volunteered data using a contributor-based approach. Geocarto Int. 37(16):4805–4822. doi: 10.1080/10106049.2021.1899304.
- Mooney P, Corcoran P, Ciepluch B. 2013. The potential for using volunteered geographic information in pervasive health computing applications. J Ambient Intell Human Comput. 4(6):731–745. doi: 10.1007/s12652-012-0149-4.
- Morley C, Rosselló J, Santana-Gallego M. 2014. Gravity models for tourism demand: theory and use. Ann Tourism Res. 48:1–10. doi: 10.1016/j.annals.2014.05.008.
- Neis P, Zipf A. 2012. Analyzing the contributor activity of a volunteered geographic information project - the case of OpenStreetMap. IJGI. 1(2):146–165. doi: 10.3390/ijgi1020146.
- Neis P, Zielstra D, Zipf A. 2011. The street network evolution of crowdsourced maps: OpenStreetMap in Germany 2007–2011. Future Internet. 4(1):1–21. doi: 10.3390/fi4010001.
- Neis P, Zielstra D, Zipf A. 2013. Comparison of volunteered geographic information data contributions and community development for selected world regions. Future Internet. 5(2):282–300. doi: 10.3390/fi5020282.
- Nejad RG, Abbaspour RA, Chehreghan A. 2022. Spatiotemporal VGI contributor reputation system based on implicit evaluation relations. Geocarto Int. 37(26):12014–12041. doi: 10.1080/10106049.2022.2063406.
- Pourabdollah A, Morley J, Feldman S, Jackson M. 2013. Towards an authoritative OpenStreetMap: conflating OSM and OS OpenData national maps’ road network. IJGI. 2(3):704–728. doi: 10.3390/ijgi2030704.
- Quinn S. 2017. Using small cities to understand the crowd behind OpenStreetMap. GeoJournal. 82(3):455–473. doi: 10.1007/s10708-015-9695-6.
- Javanmardi S, Ganjisaffar Y, Lopes C, Baldi P. 2009. User contribution and trust in Wikipedia. In Proceedings of the 2009 5th International Conference on Collaborative Computing: Networking, Applications and Worksharing; Washington, DC, USA pp. 1–6, 11-14 November. doi: 10.4108/ICST.COLLABORATECOM2009.8376.
- Salvucci G, Salvati L. 2021. Official statistics, building censuses, and OpenStreetMap completeness in Italy. IJGI. 11(1):29. doi: 10.3390/ijgi11010029.
- Sarkar D, Anderson JT. 2022. Corporate editors in OpenStreetMap: investigating Co-editing patterns. Trans GIS. 26(4):1879–1897. doi: 10.1111/tgis.12910.
- Scholz S, Knight P, Eckle M, Marx S, Zipf A. 2018. Volunteered geographic information for disaster risk reductionthe missing maps approach and its potential within the red cross and red crescent movement. Remote Sens. 10(8):1239. doi: 10.3390/rs10081239.
- Senaratne H, Mobasheri A, Ali AL, Capineri C, Haklay M. 2017. A review of volunteered geographic information quality assessment methods. Int J Geogr Inform Sci. 31(1):139–167. doi: 10.1080/13658816.2016.1189556.
- Silva LSL, Camboim SP. 2021. Authoritative cartography in brazil and collaborative mapping platforms: challenges and proposals for data integration. Boletim DE Ciencias Geodesicas. 27. doi: 10.1590/s1982-21702021000100003.
- Su SL, Lei CR, Li AY, Pi JH, Cai ZL. 2017. Coverage inequality and quality of volunteered geographic features in Chinese cities: analyzing the associated local characteristics using geographically weighted regression. Appl Geogr. 78:78–93. doi: 10.1016/j.apgeog.2016.11.002.
- Sun Y, Wang Y, Zhou X, Chen W. 2023. Are Shrinking Populations Stifling Urban Resilience? Evidence from 111 Resource-Based Cities in China. Cities. 141:104458. doi: 10.1016/j.cities.2023.104458.
- Tan J, Peng L, Wu WX, Huang Q. 2023. Mapping the evolution patterns of urbanization, ecosystem service supply-demand, and human well-being: a tree-like landscape perspective. Ecol Indicators. 154:110591. doi: 10.1016/j.ecolind.2023.110591.
- Tian YJ, Zhou Q, Fu XL. 2019. An analysis of the evolution, completeness and spatial patterns of OpenStreetMap building data in China. IJGI. 8(1):35. doi: 10.3390/ijgi8010035.
- Van den Hoek J, Friedrich HK, Ballasiotes A, Peters LER, Wrathall D. 2021. Development after displacement: evaluating the utility of OpenStreetMap data for monitoring sustainable development goal progress in refugee settlements. IJGI. 10(3):153. doi: 10.3390/ijgi10030153.
- Song W, Sun G. The role of mobile volunteered geographic information in urban management. In Proceedings of the 2010 18th International Conference on Geoinformatics, Beijing, China, 18–20 June 2010, pp. 1–5, doi: 10.1109/GEOINFORMATICS.2010.5567728.
- Wang JF, Liu XH, Peng L, Chen HY, Driskell L, Zheng XY. 2012. Cities evolution tree and applications to predicting urban growth. Popul Environ. 33(2-3):186–201. doi: 10.1007/s11111-011-0142-4.
- Wang J, Yong GE, Lianfa LI, Bin M, Jilei W, Yanchen B, Shihong DU, Yilan L, Maogui H, Chengdong X\. 2014. Spatiotemporal data analysis in geography. Acta Geograph Sin. 69(9):1326–1345. doi: 10.11821/dlxb201409007.
- Wang Y, Wang JF. 2020. Modelling and prediction of global non-communicable diseases. BMC Public Health. 20(1):822. doi: 10.1186/s12889-020-08890-4.
- Wu C, Ye XY, Ren F, Du QY. 2018. Check-in Behaviour and spatio-temporal vibrancy: an exploratory analysis in shenzhen, China. Cities. 77:104–116. doi: 10.1016/j.cities.2018.01.017.
- Xin R, Ai TH, Ding LF, Zhu RX, Meng LQ. 2022. Impact of the COVID-19 pandemic on urban human mobility-a multiscale geospatial network analysis using New York bike-sharing data. Cities. 126:103677. doi: 10.1016/j.cities.2022.103677.
- Xu J, Zhou Q. 2019. Temporal-spatial analysis of contributors’ mapping behavior for building data in OpenStreetMap. Proc Int Cartogr Assoc. 2:1–10. doi: 10.5194/ica-proc-2-149-2019.
- Anran YANG. 2022. Investigating the mechanisms of VGI data quality assurance based on history data. Acta Geodaetica et Cartograph Sin. 51(9):1979–1979.
- Yang AR, Fan HC, Jing N, Sun YR, Zipf A. 2016. Temporal analysis on contribution inequality in OpenStreetMap: a comparative study for four countries. IJGI. 5(1):5. doi: 10.3390/ijgi5010005.
- Ye S. 2014. The application of volunteered geographic information on natural disaster emergency management. Application. 281:40–41.
- Zhang Y, Li X, Wang A, Bao T, Tian S. 2015. Density and diversity of OpenStreetMap road networks in China. Big/Open Data for Urban Manag. 4(2):135–146. doi: 10.1016/j.jum.2015.10.001.
- Zhao PX, Jia T, Qin K, Shan J, Jiao CJ. 2015. Statistical analysis on the evolution of OpenStreetMap road networks in Beijing. Physica A. 420:59–72. doi: 10.1016/j.physa.2014.10.076.
- Zhou YN, Yang Y, Xia SY. 2022. A novel geographic evolution tree based on econometrics for analyzing regional differences in determinants of Chinese CO2 emission intensity. J Environ Manage. 305:114402. doi: 10.1016/j.jenvman.2021.114402.
- Zia M, Cakir Z, Seker DZ. 2019. Turkey OpenStreetMap dataset –- spatial analysis of development and growth proxies. Open Geosciences. 11(1):140–151. doi: 10.1515/geo-2019-0012.
- Zielstra D, Zipf A. 2010. A comparative study of proprietary geodata and volunteered geographic information for Germany. Berlin, Heidelberg.
- Zook M, Graham M, Shelton T, Gorman S. 2010. Volunteered geographic information and crowdsourcing disaster relief: a case study of the Haitian earthquake. World Med Health Policy. 2(2):7–33. doi: 10.2202/1948-4682.1069.