
 ?Mathematical formulae have been encoded as MathML and are displayed in this HTML version using MathJax in order to improve their display. Uncheck the box to turn MathJax off. This feature requires Javascript. Click on a formula to zoom.
Abstract
Bush encroachment threatens rangelands’ biodiversity and productivity, impacting savannah ecosystems based on location, management practices, and factors like erratic rainfall, climate change, and environmental variability. Considering these challenges, this study therefore seeks to evaluate bush encroachment changes over-time (1992–2022) in the Southern part of Kruger National Park and surrounding communities of South Africa. The study estimated the proportion and extent of encroacher plants in relation to native bush species. To achieve this objective, bioclimatic variables, and a digital elevation model in conjunction with the Random Forest model were utilized. Classified satellite imageries achieved an overall accuracy of 72 and 93%, respectively. A gradual increase in bush encroachment was observed from 41,947 hectares (ha) (3.4%) in 1992 to 61,225 ha (10%) in 2022. Additionally, this study observed a decline in the spatial extent of native plant species by 178,163.4 ha, while invasive species have expanded by 44,022.17 ha from 1992 to 2022 wet season. There is a significant increase in the invasive woody species across the years; because the p-value (p < 0.000) is <5% (p < 0.05), the significance level is <5%. The findings of this study offer a significant understanding of the historical patterns of bush encroachment over the past three decades. This information serves as a baseline for formulating strategic and sustainable management approaches to combat bush encroachment and promote effective rangeland preservation in predominantly savannah ecosystems.
1. Introduction
Many savannah rangeland ecosystems are undergoing a gradual transformation from open grasslands to areas with a predominance of woody vegetation (O’Connor Citation2015). This global phenomenon has been extensively documented, with a focus on its prevalence in semiarid environments (Kavwele et al. Citation2017; Stevens et al. Citation2017). Research has provided substantial evidence that these alterations in savannah rangeland ecosystems are attributed to a phenomenon known as bush encroachment (Palmer and Bennett Citation2013; Symeonakis et al. Citation2016). This encroachment of woody vegetation has been observed worldwide, including in regions, such as Australia (Scholes and Archer Citation1997), South America (Stevens et al. Citation2017), Southeast Asia (including India) (Jayadevan et al. Citation2018), and Africa (Lubetkin et al. Citation2017). The growing incidence of bush encroachment affects rural livelihoods, wildlife, and conservation efforts both directly and indirectly (Stafford et al. Citation2017; Maphanga et al. Citation2022). The increase in the density of woody species, caused by the establishment and densification of woody species, especially in semi-arid regions, and the subsequent reduction of grasslands, present a substantial risk to the well-being and long-term viability of savannah ecosystems globally (Skowno et al. Citation2017; Stevens et al. Citation2017; Tian et al. Citation2017). The increase in the abundance of woody vegetation within these rangelands often decreased as the amount of desirable fodder grass increased. Woody species encroachment adversely affects rangeland productivity, which is further exacerbated by land degradation resulting from drought, climate variability (as such since natural areas and natural causes cannot be seen as negative), and unsustainable grazing practices including overgrazing and overstocking (Janssen et al. Citation2018; Dube et al. Citation2019).
Changes in the climatic conditions of an area influence the spatial distribution of woody species within the savannah rangelands. The ability of these species to undergo a shift enables them to identify and inhabit climatic conditions that are suitable for their survival (Zhang et al. Citation2023). Climate change, including year-to-year variability, has been linked to changes in the composition and physiology of plant communities (Shen et al. Citation2022; Zhang et al. Citation2023). In contrast to climate data, bioclimatic variables better describe and predict the responses of living organisms (Zhang et al. Citation2023). Species distribution modeling and related ecological modeling tools frequently employ different methodologies, and bioclimatic variables encompass annual patterns, such as the average temperature and precipitation over a year, as well as seasonal variations, such as the range of temperature and precipitation throughout the year. Furthermore, extreme or constraining environmental factors, such as cold or hot weather, as well as heavy rain or drought, are also considered. In southern African savannah rangeland ecosystems, it is hypothesized that under a dry climate, bush encroachment, with a pronounced increase in woody species density and cover, replaces grass (Midgley and Bond Citation2015; Maphanga Citation2018). The South African savannah rangelands have low and unpredictable rainfall patterns, as well as alterations in land use intensity and type (Venter et al. Citation2018; Yang and Crews Citation2020). Topography plays an important role in determining the global distribution of plants, particularly in semi-arid savannah rangelands (Furley Citation2010; Angassa Citation2014). Understanding how these interactions regulate the ecology of plant communities is essential for characterizing the local and regional effects of global changes on biodiversity.
The use of remote sensing data has enabled researchers to use time series to detect changes in the savannah rangeland condition and correlate it with climate (Van Leeuwen and Nieuwenhuis Citation2010; Bunting et al. Citation2019). Kéfi et al. (Citation2014) and Browning and Lee (Citation2017) stated that the call for more research to be done to have a deeper understanding of how extreme climate conditions coupled with remotely sensed vegetation data predict ecosystem thresholds. Specifically, recent advancements in cloud computing technologies with robust data archiving systems have provided access to data, such as Landsat 5, 7, and 8 satellite imagery extending to over three decades suitable for conducting time series analyses of vegetation cover changes (Higginbottom et al. Citation2018; Souverijns et al. Citation2020). These advances have brought about a paradigm shift from previous approaches that require larger storage capacities and efficient computational resources for computationally friendly cloud-based platforms, such as the Google Earth Engine (GEE) in time series analyses (Baumann et al. Citation2018; Shekede et al. Citation2018; Venter et al. Citation2018; Zhang et al. Citation2023). In addition, GEE has been integrated with various computing algorithms, such as machine and deep learning algorithms (e.g. random forests), which are suitable for mapping and monitoring spatial-temporal variability metrics of vegetation, such as bush encroachment (Symeonakis et al. Citation2016; Brandt et al. Citation2017; Borges et al. Citation2020). In light of vegetation-based encroachment, GEE could be an effective platform for understanding the influence of bioclimatic variables on bush encroachment trends over the long term (e.g. 30 years). Higginbottom et al. (Citation2018) and Ludwig et al. (Citation2019) demonstrated that cloud computing algorithms, such as machine learning can model species distribution for invasive and native species, providing useful data on the responses of vegetation species to climate change. In this regard, GEE offers an opportunity and platform to select multiple temporal images optimally for time series analysis for encroachment studies, particularly in areas that were previously impacted by data scarcity and computational resources.
For example, in the Kruger National Park (KNP) of South Africa, many studies that assessed the change in woody cover within the savannah used historical aerial photographs either as a photograph-only image time series (Munyati and Sinthumule Citation2016) or a combination of different sensors (Ludwig et al. Citation2016). It is worth noting that these studies produced a mixed trend regarding changes in KNP in woody cover using historical imagery. Currently, there is an urgent need for a robust technique to understand the extent of bush encroachment in the southern part of the KNP and surrounding areas, where existing data are inadequate (Dube et al. Citation2022). Because of the complexity of the savannah rangeland in that region and its dynamic nature, it has been challenging to assess changes in the magnitude of spatial and temporal variations in vegetation encroachment (Naidoo et al. Citation2012; Higginbottom et al. Citation2018). Therefore, there is a need to assess the influence of combining environmental and remotely sensed data to assess spatial and temporal variations in vegetation encroachment. This study therefore sought to assess the seasonal spatiotemporal changes in bush encroachment at ten-year intervals between 1992 and 2022 in the Kruger National Park (KNP) of South Africa using Landsat remotely sensed data, environmental variables (bioclimatic and topographic data), and a Random Forest (RF) ensemble in GEE. To address the above objective, the study first characterized the overall area encroached by bushy vegetation during the dry and wet seasons. The second specific objective assessed the seasonal variations in encroachment woody species, such as Dichrostachys cinerea, Acacia nilotica, Termanalia sericia, and Senegalia nigrescens, to name a few indigenous vegetation species in the study area. The third objective was to examine the spatial extent variations of native encroachers’ vegetation in relation to indigenous vegetation. Understanding the extent of encroachment will provide insights that can aid decision-making for the effective conservation and management of encroachment to the KNP management authorities to either improve or change their management strategies.
2. Materials and methods
2.1. Study area description
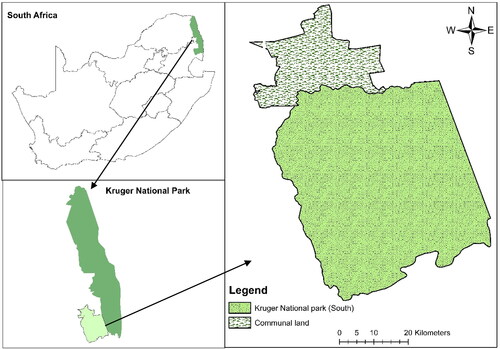
This study was conducted in the Kruger National Park (KNP), which spans portions of the South African provinces of Limpopo and Mpumalanga (). The savannah biome and gentle slopes of the park make it an ideal wildlife grazing area. Kruger National Park is classified as a BSh (hot semi-arid climate) climate according to the Koppen–Geiger classification system (Venter et al. Citation2003). There are distinct seasonal variations in rainfall and temperature in the ‘BSh’ climate. The average annual temperature in Skukuza is 22.5 °C. Annual precipitation is ∼540 mm. The geographical coordinate of this area is situated within the southern hemisphere. Summer begins in September and lasts until the end of April which is considered the wet season in savannah rangelands. The dry season lasts from June to August. The study sites are in the southern portion of the Kruger National Park region in the Mpumalanga Province of South Africa, as shown in . The study area comprises protected and unprotected sections (communal areas). Three sub-research sites were selected: Skukuza (31° 29′52.4724″ E, 25°5′30.642″ S), Pretoriouskop (31°15′49.73″ E, 25° 3′47.25″ S), and the last (31°18′44.61″ E, 25° 8′13.94″ S). These locations were chosen because they contain encroached woody vegetation. The unprotected area (community land) is located in the Bushbuckridge Municipality (Ehlanzeni District), Somerset (31°22′22.22″ E, 24°54′37.54″ S). The Granite Lowveld Vegetation Unit described by Mucina and Rutherford (Citation2006) is home to two types of savannah vegetation in the Northern Eastern region of South Africa: Lowveld Sour Bushveld (in the wetter western region) and Lowveld mixed bushveld (in the drier eastern region). The lowveld mixed bushveld is the same vegetation type that is found in the communal areas outside the park. On unprotected savannah rangeland (community land), a high rate of wood harvesting reduces the amount of woody vegetation cover (Wessels et al. Citation2013). Protected areas are the closest ‘control’ systems; nevertheless, natural processes, such as frequent fires and moderate herbivory (grazers and browsers) are maintained (Stevens et al. Citation2017). Spatial heterogeneity in the principal encroacher species in southern Africa has been observed, and existing research suggests that this variance can be ascribed to the many causes of bush encroachment in the region The presence of the Dichrostachys cinerea species has been widely observed as an encroaching phenomenon throughout many regions in southern Africa. The predominant emphasis of scholarly investigations pertaining to bush encroachment and its fundamental determinants mostly centres on locations characterized by lowland savannah and coastal savannah bioregions. To have a thorough understanding of bush encroachment in South Africa, further research is necessary, as demonstrated by the inquiry carried out by Stevens et al. (Citation2016).
Figure 1. Locality map of the study area.
2.2. Field data collection
A field survey was conducted between 10 and 30 April 2022. Field data was collected and only six (6) selected experimental sites: four (4) sites in the KNP and two (2) sites in the communal areas outside the park. The survey measured the diversity and canopy cover of woody plants at the end of the growing season using a line transect. A purposive sampling approach was adopted in this study (Bonham Citation1989; Pfeffer et al. Citation2003). The selection of the sampling approach was guided by authorities (Scientist: Vegetation Dynamics: Dr. Corli Wigley-Coetsee) stationed in the KNP and prior knowledge of local communities outside the park. To avoid oversampling, the study has marked plots in areas that are encroached were placed both in the KNP and surrounding communities. The plots (plot size: 50 × 50 m) were placed within selected areas with an interval of between 500 m and 1 km (particularly in the KNP) and this depends on the access to the areas. This was to consider the spatial differences in vegetation and prevent pseudo-replication, as suggested by Waite (Citation2000) and Wigley et al. (Citation2010). Thirty-five plots (30 in KNP and 5 in the communal) were surveyed and in each plot four (4) quadrants (50 × 50 m) were randomly placed to capture the variability within plots. In each plot, sample points of the native and native invasive woody species were recorded using Trimble GPS at submeter accuracy. The recorded in-situ data was later split into training (70%) and testing (30%) for further analysis.
2.3. Landsat data acquisition and pre-processing
In this study, we used atmospherically corrected surface reflectance scenes of Landsat data to map the spatio-temporal distribution of encroachment from 1992 to 2022. Landsat 4 TM, 5 TM+, and 8 OLI were accessed from the United States Geological Survey (USGS) using the GEE platform (https://earthengine.google.com/). This study utilized the Google Earth Engine (GEE), which automatically employs closest neighbour resampling during reprojection. The function resample() allows the user to choose the resampling method (‘bilinear’ or ‘bicubic’) that will be used during the next reprojection. When inputs are requested in the output projection, there may be an implicit reprojection that occurs before any further activity on the input. To achieve this, explicitly invoke the resample() function on the supplied picture. This allows the aggregation process with the reduceResolution() method. As with resample(), call reduceResolution() on the input, to affect the next reprojection of the image. Due to the extreme elevation range and steep slopes and its interaction with vegetation cover in KNP and surrounding communal area. A reflectance normalization process was applied to all satellite imageries by computing the spectral bands by the reflectance of all bands using band variables from Band 2 to Band 7. Six (6) spectral indices (See ) were calculated to improve the detection and mapping accuracy. below describes in detail how remote sensing data was acquired and processed.
Figure 2. Methodological overview of the processing flow.
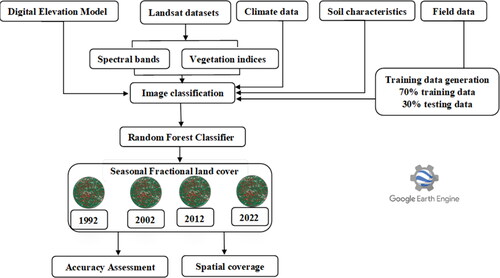
Table 1. The vegetation indices are considered in this study.
2.4. Feature extraction
There are two existing methods (vegetation indexes) for measuring vegetation (Sohn and McCoy Citation1997). For instance, Vachellia swazica and Dichrostachys cinerea produce leaves primarily from December to March, and a lesser extent from April to May. The rest of the year, the majority of shrubs are leafless (Curtis and Mannheimer Citation2005). The different inter-annual growth pattern compared to its co-occurring species, can provide a distinct phenological patterns for remote detection. In areas devoid of leaf-bearing shrubs during certain seasons, vegetation indices indicate low photosynthetic activity. By comparing the separability of vegetation indices, Resasco et al. (Citation2007) mapped an invasive shrub within understory vegetation. Vegetation index differencing is a method used to analyse differences between dates, determining the presence of native and native invasive species based on spectral reflectance behaviour (). Various indices have been developed, including NDVI for semi-arid rangelands and SAVI for soil-adjusted vegetation.
2.5. Bioclimatic, digital elevation, and soil data acquisition
A bioclimatic variable represents annual trends (e.g. annual mean temperature, annual precipitation), and seasonality (e.g. annual range in temperature and precipitation). The present research used a selection of climatic factors to examine their influence on the distribution patterns of plant species, including both native and invasive species. It is well-acknowledged that climate variability has a significant effect on these patterns (Fick and Hijmans Citation2017; Mtengwana et al. Citation2021). Nevertheless, it is important to note that these parameters generally maintain a rather stable nature and demonstrate a significant spatial association when examined at a more detailed level of investigation, especially at a resolution of 30 meters. Therefore, the incorporation of local environmental predictors is essential for elucidating the complex geographical distribution of habitats and assessing the level of spatial variability. Nineteen (19) bioclimatic variables () representing each scenario for the current (1992–2022) climates were downloaded for free from WorldClim (http://worldclimate.org) at a spatial resolution of 30 arc seconds (1 × 1 km). Annual trends (including mean temperature and precipitation) and seasonality (including temperature and precipitation ranges) are among the bioclimatic variables. Environmental factors that are extreme or limiting, such as the coldest and warmest month, and the wet and dry quarters’ precipitation, are all examples of extreme or limiting environmental factors. In addition, the Shuttle Radar Topography Mission (SRTM) Digital Elevation Data (DEM) Version 4 was accessed directly from GEE (https://srtm.csi.cgiar.org/). Using SRTM DEM, the slope map of the study region was generated. Similarly, the soil texture data was derived from the mean of the six Open land Map soil texture classes [SOTERSAF database (ver. 1)] accessible in the GEE catalogue (https://data.isric.org/geonetwork). Throughout the Southern portion of the KNP, clay soils are separated by calcrete from the underlying basalt. As a result of its densely compacted composition, clay soil has limited drainage capacities, making it conducive to water retention. It takes a while for extra liquid to filter through the soil after irrigation, resulting in saturated conditions after significant rainfall.
Table 2. The bioclimatic, and terrain variables considered to predict bush encroachment distribution.
2.6. Image classification and classification accuracy assessment
In this study, random forest machine learning algorithm was used to map the spatio-temporal distribution native invasive woody species in savanna rangelands. Random forest. To accurately delineate the distribution of non-native species in savanna rangelands, the study used RF machine learning. Random Forest (RF) is a non-parametric classifier consisting of a collection of tree classifiers. The Random Forest ensemble uses classification and regression decision tree classifiers as part of a machine learning ensemble first proposed by Breiman (Citation2001). In an ensemble model, random forests make predictions using decision trees. The final prediction is obtained by averaging the predictions of several regression trees. RF has been effectively used in remote sensing to map out invasive species (Anchang et al. Citation2020; Gan et al. Citation2022). Grid search values for the mtry parameter ranged from 1 to 14, while the mtree parameter ranged from 100 to 500 at intervals of 50. The classified satellite imageries from 1992 to 2022 were evaluated to check classification accuracy performance. During assessment performance, the split strategy of 70% (training) and 30% (testing) was used. The data was used to compute accuracy statistics. The error matrix produced was used to assess overall, user and producer accuracy.
3. Results
3.1. Spatial change in the extent of bush encroachers
The results from and show that there is an inter-season shift in the distribution and amount of woody cover, including losses and gains in the fractional woody cover. The increase in cover of the native invasive woody species was mainly observed during the wet season, but shows contrary results to the trends observed in this study and other previous studies. As shown in analysis, for the period (1992–2022), encroachment spread from the north of the study area towards the southern parts. The 2012 map () shows scattered invasive vegetation plant species in large amounts across the study area and slightly dense in the centre of the study area during the dry season. With the maps presented between 2012 and 2022 (), it is possible to capture both the temporal and spatial patterns of the growth of invasive vegetation plant species in detail. For the community studying the region, woody fractional cover maps provide the capability to discriminate very detailed and fine-scale variabilities. Moreover, structural variables may help to reduce spectral confusion, for instance, when tree species possess spectral properties similar to others. The increase in woody cover by invasive vegetation plant species is noticeable in . Yes, there is densification, however the ones that occurred in the west and south-west have disappeared.
Figure 3. (A–H) Seasonal spatial distribution of invasive vegetation plant species from 1992 to 2022 (with 10-year intervals); the white parts represent classes that were excluded or masked out.
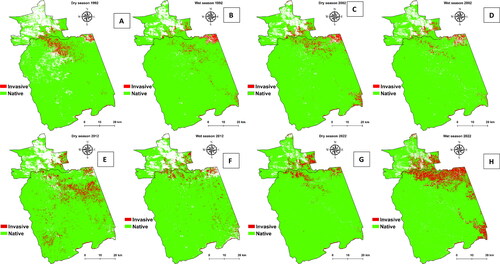
Figure 4. Estimated spatial coverage of invasive woody species during the wet and dry seasons from 1992 to 2022.
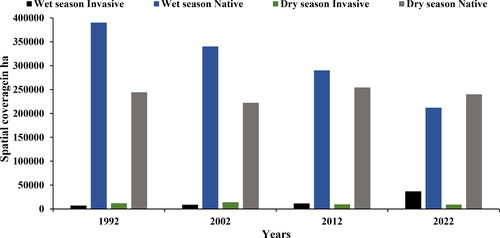
shows the spatial coverage in hectares (ha) during the same period. shows that in 1992, the spatial coverage of the native invasive vegetation plant species was 12,145 ha (2.2%) in the dry season, while in 2002 during the dry season, it increased to 14,300.1 ha (3.8%), but within the same years (1992 and 2002) during the wet season, the spatial coverage was at 7108.87 ha (3.4%) and 8909.7 ha (2%), respectively. These results show that the rate of encroachment was relatively low compared to that of native vegetation in both wet and dry seasons. The spatial coverage depicted in demonstrates that during the wet season of 1992, the area occupied by native vegetation was 390,176 ha, but the invasive vegetation covered an area of 7109 ha. This observed difference can be related to the green-up phenomenon. The observed discrepancy in vegetation between the invasive(invasive) and native species exhibited statistically significant seasonal fluctuations (p < 0.05). This variation was evident in the spatial distribution of both invasive encroachers and indigenous vegetation, as shown in . Distinct letters indicate substantial disparity, whereas similar letters indicate a lack of significant disparity.
Figure 5. Significant (p < 0.05) seasonal variation in the estimated area covered by (a) native invasive encroachers and (b) the indigenous vegetation. Different letters represent significant difference while similar later show non-significant difference based on the student’s t-test.
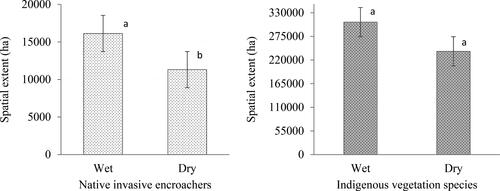
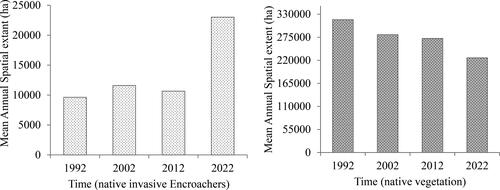
The results in show that there was a decrease in 2012's spatial coverage of native invasive vegetation plant species in hectares for both wet and dry seasons, ranging from 11,594 (3%) to 9719 ha (4%). From 2012 to 2022, an increase in the native invasive vegetation plant species was observed during the wet season recording 36,913 ha (10%). The findings depicted in indicate that there is an increase in native vegetation during the 2022 wet season, whereas there is a decrease in native invasive vegetation. Conversely, during the dry season of 2022, an opposite trend was observed, with a decrease in native vegetation and an increase in invasive vegetation. This study demonstrates that semi-arid savannah rangelands exhibit seasonality and limited annual fluctuations in plant growth. Meaning depending on the particular season they might be an increase in the availability of moisture for plants, together with the geographical and temporal distribution of water, will influence the species composition and spatial dispersion as an example. shows that encroachment mainly occurred in close boundaries with the surrounding communal areas, only in the 2012 dry season, which is a spatial distribution inward of the KNP. The seasonal variation depicted in is noticeable due to the diversity in genus. It is simple to observe the variation and abundance of woody plants at the conclusion of the growing season (April to May) based on field data. The climate of a region or area defines its typical weather conditions. The results in support the findings from and there is a significant decrease in the invasive woody species wet to dry seasons of 2022 because the p-value (p < 0.000) is <5% (p < 0.05), and the significance level is <5%. The results in demonstrate that the spatial extent of bush encroachers increases annually, while the native area decreases from 1992 to 2022. In addition, the results in show that the spatial extent of the bush encroachers (invasive) increased during the wet season, similar to that of the non-invasive native species season, which is a prominent change observed in the greenness pattern. Furthermore, the results in indicate that between the dry and wet seasons, there are significant changes in the spatial extent, as shown in . As depicted in and , the results demonstrate that bush encroachment is a decrease in cover and an increase in spatial extent.
Figure 6. Annual variations in the estimated areal extent covered by the (a) invasive encroachers and (b) indigenous vegetation species.
3.2. Accuracy assessment
shows the overall accuracies of the classification ranging from 70 to 86% from using Landsat satellite data. The results of this study indicate that during the 1992 dry season, an overall accuracy of 76% was achieved, which was based on the following variables of importance: elevation, NDMI, EVI, SAVI, Band 5 Near-Infrared (1.55–1.75 µm (B5), Band 3 Visible Red (0.63–0.69 µm) (B3), Band 7 Near-Infrared (0.8–1.1 µm) (B7), BIO 04, and BIO 12 shown in . While the wet season of the same year achieved an accuracy of 70% () Bio 04 and Bio 12 were the most important bioclimatic variables and the most performing vegetation indices were NDPI and NDVI plus elevation (). In 2002 a 78% accuracy was achieved by the model during the wet season and the best and most important bioclimatic variables were BIO 04 and BIO 12; while the best-performing vegetation indices were NDPI and NDVI (). In addition the most important spectral bands in the wet season, datasets of Landsat 5 TM (1992, 2002) were identified as follows: Band 7 (B7) representing the Shortwave Infrared (SWIR) 2 range (2.08–2.35 µm), Band 6 (B6) representing the Thermal range (10.40–12.50 µm), band 5 (B5) representing the Shortwave Infrared (SWIR) 1 range (1.55–1.75 µm), Band 4 (B4) representing the Near Infrared (NIR) range (0.76–0.90 µm), and Band 3 (B3) representing the visible red range (0.63–0.69 µm) (). These spectral bands were part of the model that helped in achieving the accuracy of 70% (1992) and 78% (2002) () during the wet season, worth noting that these accuracies shared the same variable of importance from bioclimatic variable; vegetation indices; elevation and spectral bands. When characterizing the invasive woody species during the dry season of 2012 an overall accuracy of 85% was shown in these were based on the following variables; elevation, SAVI, EVI, NDVI, and spectral Bands 7 (B7) (Shortwave Infrared (SWIR) 2 range (2.08–2.35 µm), Band (B4) Near Infrared (NIR) range (0.76–0.90 µm) and Band (B3) visible red range (0.63–0.69 µm) these are from the variable of importance (). On the vegetation indices, the results showed some variation within the variable of importance depending on the year or season (dry or wet). Furthermore, shows that during the wet and dry seasons of 2022, an overall accuracy result of 85% was achieved based on the following variable of importance: spectral bands: Band 2 (B2) Blue (0.45–0.51 µm), Band (B3) Green (0.53–0.59 µm), Band (B6) Shortwave Infrared (SWIR)-1 (1.57–1.65 µm), and Band (B8) panchromatic (0.50–0.68 µm) (); bioclimatic variables Bio 4 and BIO 12; vegetation indices NDMI, NDVI (during the dry season); NDVI, EVI (wet season) and elevation (). Contrary to the results of 2012 where the most performing vegetation indices were SAVI and EVI, furthermore in 2022 results showed that NDMI and NDVI performed better. Landsat 5 TM Band 2 (B2) Visible Green (0.52–0.60 µm) was the least performing variable importance in the 2012 dry season (). Meanwhile, Band 8 (B8) Panchromatic (0.50–0.68 µm) and Band 2 (B2) blue (0.45–0.51 µm) were among the important variables for the wet season, while during the dry season, Band 6 (B6) Shortwave Infrared (SWIR)-1 (1.57–1.65 µm) and Band 3 (B3) green (0.53–0.59 µm) were the important variables ().
Figure 7. Shows the overall accuracy for wet and dry seasons over time.
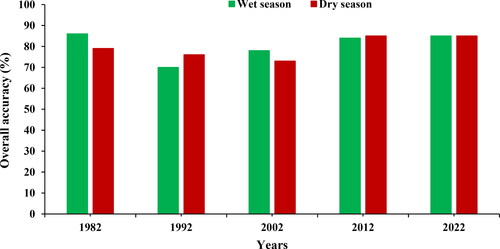
Figure 8. Estimates of the variable importance of satellite imagery in conjunction with climatic variables, elevation, and vegetation indices. A-H shows the variable importance from 1992 to 2022 (with 10-year intervals).


4. Discussion
4.1. Seasonal variations in invasive woody (encroachers) from 1992 to 2022
The results of this study showed that the invasive woody vegetation plant species have been significantly changing in terms of their aerial coverage from 1992 to 2022. As woody cover changes in savannah rangeland, the distribution and abundance of native invasive woody species threaten the spatial distribution and abundance of native woody species. This means that if there is an increase in the prevalence of woody species within their current distribution ranges, it can be considered as a process of densification. The historical model (data) indicates a change in the savannah woody cover in KNP and the surrounding area. The overall accuracies of the classification ranged from 70% to 86% from using Landsat satellite data and model accuracies were based on spectral variables, vegetation indices, elevation, and bioclimatic variables. According to the results of this study, an overall accuracy of 76% was achieved during the dry season of 1992 using the significant variables elevation, NDMI, EVI, SAVI, Band 3 Visible Red (0.63–0.69 µm) (B3), Band 5 Visible Red (0.6–0.7 µm) (B5), Band 7 Near-Infrared (0.8–1.1 µm) (B7), BIO 04, and BIO 12. It is possible to attribute the woody state to a combination of factors, including severe drought conditions enhancing the growth of woody species (Sintayehu Citation2018) and suppressing herbaceous plant cover (Kgosikoma and Mogotsi Citation2013). Case et al. (Citation2020) demonstrated that several plant species that are susceptible to drought and tend to encroach into woody areas have comparable traits with non-encroaching species.
Furthermore, Zhu et al. (Citation2022) found that encroachment was greatest in areas with a lower fire frequency and a lower mean annual rainfall, as well as in areas where elephants were more prevalent in the KNP. Furthermore, it is worth noting that certain specimens of Senegalia nigrescens exhibit a lack of foliage throughout April and May. Hence, greenness is decreasing, and dry-matter content is increasing. The majority of the effect of leaf loss on spectral response can be attributed to a change in the amount of visible soil affecting the signal. Due to the importance of water availability in savannas, the spatial separation of species may be caused by abiotic factors, such as soil texture that regulate water storage (Dube et al. Citation2022).
In the same year, BIO 04 and BIO 12 were the most significant bioclimatic variables coupled with elevation and NDPI. Based on their known phenological differences, i.e. a different onset of shoot growth, spatial distribution patterns of bush encroacher species were identified. Seasonal phenological changes are typically the result of inter-annual climatic variability and are manifested by an increase or decrease in green biomass. Moreover, this season is sufficiently dry to distinguish between the spectral characteristics of woody and herbaceous vegetation (Shen et al. Citation2022). Structure variables may help reduce spectral confusion when a specific tree species, such as Dichrostachys cinerea, has similar spectral properties to Peltophorum africanum. In a related study, Naidoo et al. (Citation2012) argue that in savannah rangelands bush encroachment component decreases the temporal variation within the NDVI signal as the shrubs maintain leaves throughout the dry season. The majority of the effect of leaf loss on spectral response can be attributed to a change in the amount of visible soil affecting the signal. This appears to be particularly true for encroaching species that typically lack a well-developed understory (Scholes and Archer Citation1997; Venter et al. Citation2018; Shen et al. Citation2022).
4.2. Understanding the influence of bioclimatic variables on bush encroachment trends over a long term (30 years)
When characterizing the invasive(invasive) woody species during the dry season of 2012, an overall accuracy of 85% was determined based on the following variables: elevation, SAVI, EVI, NDVI, and spectral bands Band 7—Shortwave Infrared (SWIR) 2, Band 4 (B4) Near-Infrared, and Band 3 (B3) visible red range, Elevation was an important variable in this model and this maybe because of topography variation in soil texture, water availability and temperature. According to Oldeland et al. (Citation2010), the spatial distribution of invasive species in rangelands is influenced by the topographic depression (elevation) of a landscape. When a distinct environmental gradient is present in a study area, and consequently in the image, species composition and vegetation structure will likely change along this gradient. Schmidtlein et al. (Citation2007) and Van Leeuwen and Nieuwenhuis (Citation2010) discovered that is likely to influence the spectral response, allowing differentiation of vegetation types (shrubs or trees) along the gradient. Similar studies by Venter et al. (Citation2018) and Zhang et al. (Citation2023) have found that topographic variables are important in large-scale land cover land use classification. For instance, Rufin et al. (Citation2015) incorporated topographic variables (elevation and slope) into their land use land cover model and emphasized their importance in improving overall accuracy. Worth noting that these studies looked at an elevation at a large scale which was not the case in this study as it was factored in at a regional level. Symeonakis and Higginbottom (Citation2014) defined several datasets based on Landsat time series and auxiliary bands, such as topographic factors, and discovered that elevation was the most significant variable in all models. Consequentially, the high significance of topographic factors utilized in this study was consistent with findings from prior research.
Depending on the year or season (dry or wet), the vegetation indices revealed some variation within the significant variable ( and ). This kind of data allowed the discrimination of vegetation type (native and invasive) by exploiting the full spectral range of the reflected radiation (Higginbottom et al. Citation2018). Furthermore, the result of this study demonstrates that during the wet and dry seasons of 2022, an overall accuracy result of 85% was achieved based on the following important variable: spectral bands; Band 2 (B2) Blue Band (B3) (Green), Band (B6) Shortwave Infrared (SWIR)-1, and Band (B8) (panchromatic). In contrast to the results of 2012, which indicated that SAVI and EVI were the most effective vegetation indices, the results of 2022 demonstrated that NDMI and NDVI performed better. This is also supported by Tian et al. (Citation2017) who stated that most vegetation indices rely on the reflectance in the Near Infrared (NIR) wavelength because of the distinctive spectral signature, characterized by a low reflectance in the visible spectrum, and high reflectance in the near-infrared by plants. Moreover, the findings of this study show that variation within the variable of importance depends on the year or season (dry or wet) on the vegetation indices. This is contrary to the observation made from this study as the dry season gives a clear separation of the two classes as they go to senescent at different times.
During the wet seasons of 1992, 2002, and 2012 overall accuracies of 70, 78, and 84% were achieved, respectively and the three most significant spectral bands identified in Landsat 5 TM wet season datasets (1992, 2002, 2012): Band 7 (B7) Shortwave Infrared (SWIR) 2 range, Band 6 (B6) representing the Thermal range, Band 5 (B5) representing the SWIR-1, Band 4 (B4) Near Infrared (NIR) range, and Band 3 (B3) visible red range. Elevation coupled with bioclimatic variables (BIO 04 and BIO 12) and vegetation indices (NDPI and NDVI) were the best-performing variables of importance which helped in achieving the accuracies. The two most influential bioclimatic variables during the 1992, 2012, and 2022 wet seasons were BIO 04 and BIO 12. As a result of climatic changes, vegetation structure changes in arid regions with increasing precipitation. The facilitative or competitive interactions between native and invasive woody species are crucial to understand past and current successional stages and dynamics and to predict future encroachment rates in harsh alpine environments (Angers-Blondin et al. Citation2018). During these wet seasons, woody shrub vegetation is photosynthetically active, whereas, during the dry season, it is not (Naidoo et al. Citation2012; Zhang et al. Citation2023). Higginbottom and Symeonakis (Citation2017) stated that the trends of bush encroachment are a result of climate variability particularly in rainfall and temperature, especially where they are no anthropogenic activity.
From 1992 to 2022, the results indicate that the spatial extent of bush encroachments increases annually, while the native vegetation decreases. In addition, the results indicate that the spatial extent of bush encroachers (invasive) increased during the wet season, similar to the native; this is accompanied by significant changes in the pattern of greenness. In addition, the results indicate that the spatial extent varies considerably between dry and wet seasons. This could be explained by an outbreak of veld fires that occurred in the eastern section of the park in 2012 which had the potential to harm the park’s fauna and flora. The results, of this study, show that invasive vegetation plant species covered 12,144.5 ha (2.2%) in 1992, 14,300.1 ha (3.8%) in the dry season of 2002, and 8909.7 ha (2%) in the wet season of 2002. This suggests that context influences long-term changes in woody cover patterns in the KNP and surrounding areas. Some woody species are less tolerant of dry conditions than others.
Furthermore, the findings of this study suggest that the spatial extent of invasive(invasive) species has increased considerably between 1992 and 2022. The results demonstrated that there is a rapid increase in the bush encroachers regardless of the season or year. The variability of precipitation, topography, and temperature within an annual period defines encroachment. The possibility exists that biological activity and species richness are largely unaffected by spatial variations in climate. In each of the four dry seasons, the general pattern of variation in vegetation eco-physiognomy increases from west to east, as well as north to south, as the vegetation changes. According to Higginbottom and Symeonakis (Citation2017) this is because dry season metrics have relatively greater discriminatory power at sparse coverage, where woody canopies are more distinguishable. The study by Yang and Crews (Citation2020) found that in semi-arid places, the rise in encroachment is directly connected to the availability of water due to low annual rainfall.
5. Conclusion
This study aimed at assessing bush encroachment spatiotemporal changes over-time (1992–2022) in the Southern part of Kruger National Park (KNP) and surrounding communities of South Africa. The results achieved in this study showed that there is a gradual increase in the spatial distribution of invasive woody plant species in this section of the KNP and surrounding communities. Landsat datasets, bioclimatic, and DEM played a critical role in the detection and monitoring of bush encroachment in the KNP and surrounding communities in GEE. The ensemble machine learning classifier, Random Forest managed to achieve a classification accuracy of 86% to 70% over the selected years. Seasonal climatic variability also influences the rapid increase of invasive plants. This study used the historical Landsat data to monitor the spatial distribution of invasive woody species coupled with bioclimatic (precipitation and temperature) over 30 years. There has been a significant increase in the encroachment rate. The results demonstrated in this study are acceptable given that the research focus was at a regional level, which is characterized by high complexity. Landsat data has provided the opportunity to trace back the regional land cover changes to the 1980s at high resolution. Notwithstanding the irregularity in canopy and crown shape, height, and other structural dimensions of savannah vegetation (a stark contrast to the more homogeneous forest vegetation), these structural vegetation parameters should not be ignored. It is possible that site-specific factors, such as rainfall, temperature, fire, overgrazing, woody plant removal, etc. before an earlier study date, could explain the apparent increase in woody cover within the same study site. Therefore, long-term changes in the KNP’s and surrounding communities’ woody cover patterns are context-dependent.
Authors contributions
Thabang Maphanga: conceptualization, methodology, funding acquisition, investigation formal analysis, data curation, visualization, and writing original draft. Timothy Dube: conceptualization, writing review, editing, methodology, formal analysis, funding acquisition, and supervision. Cletah Shoko: writing review, editing, and supervision. Mbulisi Sibanda: writing review, editing, methodology, formal analysis, and supervision. Kgabo Humphrey Thamaga: writing review, editing, methodology, software, validation, visualization, and formal analysis.
Acknowledgements
The authors would like to acknowledge the NRF Black Academics Advancement Programme (BAAP) (grant number: 138170) for funding the research. The authors gratefully acknowledge assistance from the Scientific Services division of South African National Parks (SANParks) in the form of accommodation at the research camp at Skukuza and escorts by game guards during fieldwork.
Disclosure statement
No potential conflict of interest was reported by the author(s).
Data availability statement
Data will be made available on request.
Additional information
Funding
References
- Adagbasa GE, Mukwada G. 2021. Mapping vegetation species succession in a mountainous grassland ecosystem using Landsat and Sentinel-2 data. bioRxiv. 2021–08.
- Anchang JY, Prihodko L, Ji W, Kumar SS, Ross CW, Yu Q, Lind B, Sarr MA, Diouf AA, Hanan NP. 2020. Toward operational mapping of woody canopy cover in tropical savannas using Google Earth Engine. Front Environ Sci. 8:4. doi: 10.3389/fenvs.2020.00004.
- Angassa A. 2014. Effects of grazing intensity and bush encroachment on herbaceous species and rangeland condition in southern Ethiopia. Land Degrad Dev. 25(5):438–451. doi: 10.1002/ldr.2160.
- Angers-Blondin S, Myers-Smith IH, Boudreau S. 2018. Plant–plant interactions could limit recruitment and range expansion of tall shrubs into alpine and Arctic tundra. Polar Biol. 41(11):2211–2219. doi: 10.1007/s00300-018-2355-9.
- Baumann M, Levers C, Macchi L, Bluhm H, Waske B, Gasparri NI, Kuemmerle T. 2018. Mapping continuous fields of tree and shrub cover across the Gran Chaco using Landsat 8 and Sentinel-1 data. Remote Sens Environ. 216:201–211. doi: 10.1016/j.rse.2018.06.044.
- Bonham D. 1989. Measurements for terrestrial vegetation. New York (NY): John Wiley and Sons.
- Borges J, Higginbottom TP, Symeonakis E, Jones M. 2020. Sentinel-1 and Sentinel-2 data for savannah land cover mapping: optimising the combination of sensors and seasons. Remote Sens. 12(23):3862. doi: 10.3390/rs12233862.
- Brandt M, Tappan G, Diouf AA, Beye G, Mbow C, Fensholt R. 2017. Woody vegetation die off and regeneration in response to rainfall variability in the West African sahel. Remote Sens. 9(1):39. doi: 10.3390/rs9010039.
- Breiman L. 2001. Random forests. Mach Learn. 45(1):5–32. doi: 10.1023/A:1010933404324.
- Browning M, Lee K. 2017. Within what distance does “greenness” best predict physical health? A systematic review of articles with GIS buffer analyses across the lifespan. Int J Environ Res Public Health. 14(7):675. doi: 10.3390/ijerph14070675.
- Bunting EL, Munson SM, Bradford JB. 2019. Assessing plant production responses to climate across water-limited regions using Google Earth Engine. Remote Sens Environ. 233:111379. doi: 10.1016/j.rse.2019.111379.
- Case JB, Rothlauf PW, Chen RE, Kafai NM, Fox JM, Smith BK, Shrihari S, McCune BT, Harvey IB, Keeler SP, et al. 2020. Replication-competent vesicular stomatitis virus vaccine vector protects against SARS-CoV-2-mediated pathogenesis in mice. Cell Host Microbe. 28(3):465–474.e4., doi: 10.1016/j.chom.2020.07.018.
- Curtis BA, Mannheimer CA. 2005. Includes a picture. Windhoek: Tree Atlas of Namibia National Botanic Research Institute; p. 623.
- Dube T, Maluleke XG, Mutanga O. 2022. Mapping rangeland ecosystems vulnerability to Lantana camara invasion in semi‐arid savannahs in South Africa. Afr J Ecol. 60(3):658–667. doi: 10.1111/aje.12951.
- Dube T, Pandit S, Shoko C, Ramoelo A, Mazvimavi D, Dalu T. 2019. Numerical assessments of leaf area index in tropical savanna rangelands, South Africa using Landsat 8 OLI derived metrics and in-situ measurements. Remote Sens. 11(7):829. doi: 10.3390/rs11070829.
- Fick SE, Hijmans RJ. 2017. WorldClim 2: new 1km spatial resolution climate surfaces for global land areas. Int J Climatol. 37(12):4302–4315. doi: 10.1002/joc.5086.
- Furley P. 2010. Tropical savannas: biomass, plant ecology, and the role of fire and soil on vegetation. Prog Phys Geogr. 34(4):563–585.
- Gan L, Cao X, Chen X, He Q, Cui X, Zhao C. 2022. Mapping shrub coverage in Xilin Gol Grassland with multi-temporal sentinel-2 imagery. Remote Sens. 14(14):3266. doi: 10.3390/rs14143266.
- Higginbottom T, Symeonakis E. 2017. Distribution and drivers of woody cover change in Southern African savannahs, 1984–2014. EGU General Assembly Conference Abstracts; p. 18927.
- Higginbottom TP, Symeonakis E, Meyer H, van der Linden S. 2018. Mapping fractional woody cover in semi-arid savannahs using multi-seasonal composites from Landsat data. ISPRS J Photogramm Remote Sens. 139:88–102. doi: 10.1016/j.isprsjprs.2018.02.010.
- Huete A, Didan K, Miura T, Rodriguez EP, Gao X, Ferreira LG. 2002. Overview of the radiometric and biophysical performance of the MODIS vegetation indices. Remote Sens Environ. 83(1–2):195–213. doi: 10.1016/S0034-4257(02)00096-2.
- Huete AR. 1988. A soil-adjusted vegetation index (SAVI). Remote Sens Environ. 25(3):295–309. doi: 10.1016/0034-4257(88)90106-X.
- Janssen TA, Ametsitsi GK, Collins M, Adu-Bredu S, Oliveras I, Mitchard ET, Veenendaal EM. 2018. Extending the baseline of tropical dry forest loss in Ghana (1984–2015) reveals drivers of major deforestation inside a protected area. Biol Conserv. 218:163–172. doi: 10.1016/j.biocon.2017.12.004.
- Jayadevan A, Mukherjee S, Vanak AT. 2018. Bush encroachment influences nocturnal rodent community and behaviour in a semi-arid grassland in Gujarat, India. J Arid Environ. 153:32–38. doi: 10.1016/j.jaridenv.2017.12.009.
- Kavwele CM, Kimanzi JK, Kinyanjui MJ. 2017. Impacts of bush encroachment on wildlife species diversity, composition, and habitat Preference in Ol Pejeta Conservancy, Laikipia, Kenya. Int J Ecol. 2017:1–6. doi: 10.1155/2017/5620125.
- Kéfi S, Guttal V, Brock WA, Carpenter SR, Ellison AM, Livina VN, Seekell DA, Scheffer M, Van Nes EH, Dakos V. 2014. Early warning signals of ecological transitions: methods for spatial patterns. PLOS One. 9(3):e92097. doi: 10.1371/journal.pone.0092097.
- Kgosikoma OE, Mogotsi K, Department of Agricultural Research, Ministry of Agriculture, Gaborone, Botswana. www.moa.gov.bw. 2013. Understanding the causes of bush encroachment in Africa: The key to effective management of savanna grasslands. Trop Grass - Forr Trop. 1(2):215–219. doi: 10.17138/TGFT(1)215-219.
- Lubetkin KC, Westerling AL, Kueppers LM. 2017. Climate and landscape drive the pace and pattern of conifer encroachment into subalpine meadows. Ecol Appl. 27(6):1876–1887. doi: 10.1002/eap.1574.
- Ludwig A, Meyer H, Nauss T. 2016. Automatic classification of Google Earth images for a larger scale monitoring of bush encroachment in South Africa. Int J Appl Earth Obs Geoinf. 50:89–94. doi: 10.1016/j.jag.2016.03.003.
- Ludwig M, Morgenthal T, Detsch F, Higginbottom TP, Valdes ML, Nauß T, Meyer H. 2019. Machine learning and multi-sensor-based modelling of woody vegetation in the Molopo Area, South Africa. Remote Sens Environ. 222:195–203. doi: 10.1016/j.rse.2018.12.019.
- Maphanga T, Dube T, Shoko C, Sibanda M, Gxokwe S. 2024. Using multisource remotely sensed data and cloud computing approaches to map non-native species in the semi-arid savannah rangelands of Mpumalanga, South Africa. S Afr Geogr J. 106–24. doi: 10.1080/03736245.2024.2341660.
- Maphanga T, Dube T, Shoko C, Sibanda M. 2022. Advancements in the satellite sensing of the impacts of climate and variability on bush encroachment in savannah rangelands. Remote Sens Appl Soc Environ. 25:100689. doi: 10.1016/j.rsase.2021.100689.
- Maphanga T. 2018. Application of near-surface remote sensing technologies for monitoring natural rangeland vegetation [doctoral dissertation]. University of Limpopo. https://limpopo.on.worldcat.org/search/detail/1083756481?queryString=Application%20of%20Near-surface%20Remote%20Sensing%20Technologies%20for%20Monitoring%20Natural%20Rangeland%20Vegetation&wcsbtn2w.x=19&wcsbtn2w.y=18&clusterResults=false&groupVariantRecords=false&stickyFacetsChecked=false
- Midgley GF, Bond WJ. 2015. Future of African terrestrial biodiversity and ecosystems under anthropogenic climate change. Nat Clim Change. 5(9):823–829. doi: 10.1038/nclimate2753.
- Mtengwana B, Dube T, Mudereri BT, Shoko C. 2021. Modelling the geographic spread and proliferation of invasive alien plants (IAPs) into new ecosystems using multi-source data and multiple predictive models in the Heuningnes catchment, South Africa. GISci Remote Sens. 58(4):483–500. doi: 10.1080/15481603.2021.1903281.
- Mucina L, Rutherford MC. 2006. The vegetation of South Africa, Lesotho and Swaziland. pp. viii+-807.
- Munyati C, Sinthumule NI. 2016. Change in woody cover at representative sites in the Kruger National Park, South Africa, based on historical imagery. SpringerPlus. 5(1):1417. doi: 10.1186/s40064-016-3036-1.
- Naidoo L, Cho MA, Mathieu R, Asner G. 2012. Classification of savanna tree species, in the Greater Kruger National Park region, by integrating hyperspectral and LiDAR data in a Random Forest data mining environment. ISPRS J Photogramm Remote Sens. 69:167–179. doi: 10.1016/j.isprsjprs.2012.03.005.
- O’Connor TG. 2015. Long-term response of an herbaceous sward to reduced grazing pressure and rainfall variability in a semi-arid South African savanna. Afr J Range Forage Sci. 32(4):261–270. doi: 10.2989/10220119.2015.1015052.
- Oldeland J, Dorigo W, Wesuls D, Jürgens N. 2010. Mapping bush encroaching species by seasonal differences in hyperspectral imagery. Remote Sens. 2(6):1416–1438. doi: 10.3390/rs2061416.
- Palmer AR, Bennett JE. 2013. Degradation of communal rangelands in South Africa: towards an improved understanding to inform policy. Afr J Range Forage Sci. 30(1–2):57–63. doi: 10.2989/10220119.2013.779596.
- Pfeffer K, Pebesma EJ, Burrough PA. 2003. Mapping alpine vegetation using vegetation observations and topographic attributes. Landsc Ecol. 18(8):759–776. doi: 10.1023/B:LAND.0000014471.78787.d0.
- Qi J, Marsett R, Heilman P, Bieden‐bender S, Moran S, Goodrich D, Weltz M. 2002. RANGES improves satellite‐based information and land cover assessments in southwest United States. EoS Trans. 83(51):601–606. doi: 10.1029/2002EO000411.
- Resasco J, Hale AN, Henry MC, Gorchov DL. 2007. Detecting an invasive shrub in a deciduous forest understory using late‐fall Landsat sensor imagery. Int J Remote Sens. 28(16):3739–3745. doi: 10.1080/01431160701373721.
- Rufin P, Müller H, Pflugmacher D, Hostert P. 2015. Land use intensity trajectories on Amazonian pastures derived from Landsat time series. Int J Appl Earth Obs Geoinf. 41:1–10. doi: 10.1016/j.jag.2015.04.010.
- Schmidtlein S, Zimmermann P, Schüpferling R, Weiß C. 2007. Mapping the floristic continuum: rdination space position estimated from imaging spectroscopy. J Veg Sci. 18(1):131–140. doi: 10.1111/j.1654-1103.2007.tb02523.x.
- Scholes RJ, Archer SR. 1997. Tree-grass interactions in savannas. Annu Rev Ecol Syst. 28(1):517–544. doi: 10.1146/annurev.ecolsys.28.1.517.
- Shekede MD, Murwira A, Masocha M, Gwitira I. 2018. Spatial distribution of Vachellia karroo in Zimbabwean savannas (southern Africa) under a changing climate. Ecol Res. 33(6):1181–1191. doi: 10.1007/s11284-018-1636-7.
- Shen X, Liu Y, Liu B, Zhang J, Wang L, Lu X, Jiang M. 2022. Effect of shrub encroachment on land surface temperature in semi-arid areas of temperate regions of the Northern Hemisphere. Agric For Meteorol. 320:108943. doi: 10.1016/j.agrformet.2022.108943.
- Sintayehu DW. 2018. Impact of climate change on biodiversity and associated key ecosystem services in Africa: a systematic review. Ecosyst Health Sustain. 4(9):225–239. doi: 10.1080/20964129.2018.1530054.
- Skowno AL, Thompson MW, Hiestermann J, Ripley B, West AG, Bond WJ. 2017. Woodland expansion in South African grassy biomes based on satellite observations (1990–2013): general patterns and potential drivers. Glob Chang Biol. 23(6):2358–2369. doi: 10.1111/gcb.13529.
- Sohn Y, McCoy RM. 1997. Mapping desert shrub rangeland using spectral unmixing and modeling spectral mixtures with TM data. Photogramm Eng Remote Sens. 63(6):707–716.
- Souverijns N, Buchhorn M, Horion S, Fensholt R, Verbeeck H, Verbesselt J, Herold M, Tsendbazar NE, Bernardino PN, Somers B, et al. 2020. Thirty years of land cover and fraction cover changes over the Sudano-Sahel using Landsat time series. Remote Sens. 12(22):3817. doi: 10.3390/rs12223817.
- Stafford W, Birch C, Etter H, Blanchard R, Mudavanhu S, Angelstam P, Blignaut J, Ferreira L, Marais C. 2017. The economics of landscape restoration: benefits of controlling bush encroachment and invasive plant species in South Africa and Namibia. Ecosyst Serv. 27:193–202. doi: 10.1016/j.ecoser.2016.11.021.
- Stevens N, Erasmus BFN, Archibald S, Bond WJ. 2016. Woody encroachment over 70 years in South African savannahs: overgrazing, global change or extinction aftershock? Philos Trans R Soc Lond B Biol Sci. 371(1703):20150437. doi: 10.1098/rstb.2015.0437.
- Stevens N, Lehmann CE, Murphy BP, Durigan G. 2017. Savanna woody encroachment is widespread across three continents. Glob Chang Biol. 23(1):235–244. doi: 10.1111/gcb.13409.
- Stevenson-Hamilton J. 1903. Game preservation in the Eastern Transvaal. The Field. 5:603–866.
- Symeonakis E, Higginbottom T. 2014. Bush encroachment monitoring using multi-temporal Landsat data and random forests. Int Arch Photogramm Remote Sens Spat Inf Sci. 40:29–35.
- Symeonakis E, Petroulaki K, Higginbottom T. 2016. Landsat-based woody vegetation cover monitoring in southern African savannahs. Int Arch Photogramm Remote Sens Spat Inf Sci. 41:563–567.
- Tian F, Brandt M, Liu YY, Rasmussen K, Fensholt R. 2017. Mapping gains and losses in woody vegetation across global tropical drylands. Glob Chang Biol. 23(4):1748–1760. doi: 10.1111/gcb.13464.
- Tucker CJ. 1979. Red and photographic infrared linear combinations for monitoring vegetation. Remote Sens Environ. 8(2):127–150. doi: 10.1016/0034-4257(79)90013-0.
- Van Leeuwen M, Nieuwenhuis M. 2010. Retrieval of forest structural parameters using LiDAR remote sensing. Eur J Forest Res. 129(4):749–770. doi: 10.1007/s10342-010-0381-4.
- Venter FJ, Scholes RJ, Eckhardt HC. 2003. The abiotic template and its associated vegetation pattern. In: Du Toit JT, Rogers KH, Biggs HC, editors. The Kruger experience: ecology and management of savanna heterogeneity. London: Island Press; p. 83–129.
- Venter ZS, Cramer MD, Hawkins HJ. 2018. Drivers of woody plant encroachment over Africa. Nat Commun. 9(1):2272. doi: 10.1038/s41467-018-04616-8.
- Waite S. 2000. Statistical ecology in practice: a guide to analysing environmental and ecological field data. Prentice Hall.
- Wang L, Zhang J, Liu P, Choo KKR, Huang F. 2017. Spectral–spatial multi-feature-based deep learning for hyperspectral remote sensing image classification. Soft Comput. 21(1):213–221. doi: 10.1007/s00500-016-2246-3.
- Wessels KJ, Colgan MS, Erasmus BFN, Asner GP, Twine WC, Mathieu R, Van Aardt JAN, Fisher JT, Smit IP. 2013. Unsustainable fuelwood extraction from South African savannas. Environ Res Lett. 8(1):014007. doi: 10.1088/1748-9326/8/1/014007.
- Wigley BJ, Bond WJ, Hoffman MT. 2010. Thicket expansion in a South African savanna under divergent land use: local vs. global drivers? Global Change Biol. 16(3):964–976. doi: 10.1111/j.1365-2486.2009.02030.x.
- Xiao Y, Zhang J, Cui T, Gong J, Liu R, Chen X, Liang X. 2019. Remote sensing estimation of the biomass of floating Ulva prolifera and analysis of the main factors driving the interannual variability of the biomass in the Yellow Sea. Mar Pollut Bull. 140:330–340. doi: 10.1016/j.marpolbul.2019.01.037.
- Yang X, Crews KA. 2020. The role of precipitation and woody cover deficit in juniper encroachment in Texas savanna. J Arid Environ. 180:104196. doi: 10.1016/j.jaridenv.2020.104196.
- Zhang A, Chen S, Chen J, Cui H, Jiang X, Xiao S, Wang J, Gao H, An L, Cardoso P. 2023. Shrub and precipitation interactions shape functional diversity of nematode communities on the Qinghai–Tibet Plateau. Glob Chang Biol. 29(10):2746–2758. doi: 10.1111/gcb.16638.
- Zhu Y, Shen H, Akinyemi DS, Zhang P, Feng Y, Zhao M, Kang J, Zhao X, Hu H, Fang J. 2022. Increased precipitation attenuates shrub encroachment by facilitating herbaceous growth in a Mongolian grassland. Funct Ecol. 36(9):2356–2366. doi: 10.1111/1365-2435.14100.