
 ?Mathematical formulae have been encoded as MathML and are displayed in this HTML version using MathJax in order to improve their display. Uncheck the box to turn MathJax off. This feature requires Javascript. Click on a formula to zoom.
Abstract
Extracting building from remote sensing images is crucial, but the extracted outlines still face issues such as point redundancy and lack of right-angle features, relying on further regularization. This study proposed an integrated regularization method to combine the strengths of multiple algorithms. 22 metrics were calculated to describe the geometric characteristic of outlines, followed by principal component analysis for selecting key metrics. Further, a supervised learning model was constructed to analyze these key metrics and determine the most suitable algorithm among three candidates–rectangle transformation, recursive regression, and feature edge reconstruction–for regularizing each building. Experimental results demonstrated that our method can adaptively select the appropriate algorithm based on the metrics, achieving regularization results superior to those obtained by using algorithms independently. Compared with two existing geometric correction-based methods, our method excels in preserving the orientation, area, and shape. Our method also has advantages over learning-based methods in maintaining the orthogonality.
1. Introduction
Building information has always been the focus of spatial data modeling and analysis. Particularly in developing regions, timely and accurate building maps are crucial for environmental monitoring (Chen et al. Citation2021), population estimation (Qiu et al. Citation2010), urban modeling and planning (Chen et al. Citation2022), and multi-scale database construction (Protopapadakis et al. Citation2021). With the rapid development of Earth observation satellite platforms, a large amount of high-resolution remote sensing (RS) data has become available. More importantly, the expression of surface content is more detailed and contains richer geographic information, providing a favorable basis for building outline generation (Raghavan et al. Citation2022). Therefore, automated building extraction from RS images is crucial for mapping and updating buildings.
Buildings, as man-made features, typically exhibit strong linearity and orthogonality. Therefore, mapping buildings based on RS images requires not only building segmentation but also outline regularization. Building segmentation refers to the process of separating the ground pixels from non-ground pixels and creating building outlines by tracing the boundary points of ground pixels. Over the past few decades, many segmentation methods have been developed to capture building outlines from RS images. Traditional methods perform segmentation tasks using empirical features that measure edges, textures, and shape characteristics (Ferraioli Citation2010; Awrangjeb et al. Citation2013; Dunaeva and Kornilov Citation2017). However, empirical feature design lacks good generalization ability, relies on manual labor, and is far from automated. Inspired by the success of convolutional neural networks (CNNs), deep learning methods have been widely applied to building segmentation tasks. Recent studies have proposed several learning-feature-based building segmentation models that have achieved excellent performance in building segmentation (Maggiori et al. Citation2017; Shrestha and Vanneschi Citation2018; Wu et al. Citation2018; Yang et al. Citation2018; Zhang et al. Citation2020; Zhou et al. Citation2022).
Although deep learning-based methods have significantly improved the ability to extract building outlines from RS images, there is still a gap between automatically extracted and manually delineated building outlines. Because of the locality of the pixel-wise labeling achieved by the segmentation models, the extracted building outlines typically exhibit aliasing shapes. As shown in , the building outlines produced by the segmentation models not only contain a large number of redundant points, but also partially lose their right-angle and linear characteristics. This problem has received increasing attention in recent years (Marcos et al. Citation2018; Zhao et al. Citation2018; Wei et al. Citation2023).
Figure 1. Comparison between model-extracted and manually delineated building outlines: (a) building outlines extracted by a segmentation model, and (b) manually delineated building outlines. The red lines superimposed on the buildings denote the outlines.
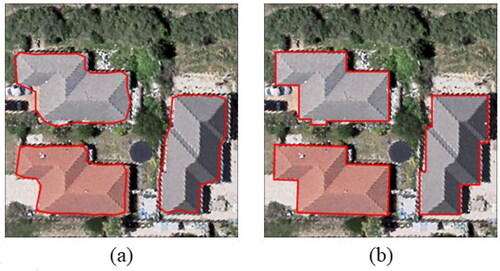
Currently, there are two main strategies to address this issue. One strategy is to enhance segmentation models by adding special regularization measures that help detect possible building corner and preserve the linear and rectangular characteristics of the extracted building outlines (Zorzi and Fraundorfer Citation2019). This strategy integrates building segmentation and outline regularization within a single framework, resulting in segmentation outputs that more closely adhere to the true boundaries of the buildings (Li et al. Citation2021; Yu et al. Citation2022). However, due to the influence of image quality and complexity of ground objects, it is difficult to fully meet the regularization requirements of building outlines obtained directly by segmentation models (Marcos et al. Citation2018).
Another strategy is to employ post-processing methods to regularize the irregular building outlines extracted by the segmentation model. Post-processing methods can be broadly categorized into two types: learning-based and geometric correction-based strategies. The learning-based strategy, exemplified by methods such as Curve-GCN (Ling et al. Citation2019), Polarmask (Xie et al. Citation2020), and Polygon-RNN++ (Acuna et al. Citation2018), iteratively adjusts the initial outlines by learning vertex offsets, thereby gradually aligning it with the true outline of the target object. This strategy achieves high automation and processing efficiency, effectively learns the geometric features of outlines, and adapts well to many buildings with complex shapes. However, it has certain limitations. Firstly, the discrepancy between the initial outline and the ground truth may increase the network’s learning difficulty. Secondly, the output outlines may exhibit issues such as corner loss or overly smooth at the corners, leading to a loss of orthogonality.
The geometric correction-based strategy is to design a regularization algorithm to process the extracted outlines, which offers the advantage of being straightforward and provides greater flexibility when considering the constraints (Wu et al. Citation2018; Feng et al. Citation2021). This approach is similar to building simplification, which removes redundant points to obtain a simpler representation for a building while maintaining its main structural characteristics (Regnauld et al. Citation1999; Chen et al. Citation2011; Xu et al. Citation2013). Therefore, many simplification algorithms contribute to building regularization (Buchin et al. Citation2016; Lokhat and Touya Citation2016; Partovi et al. Citation2017; Feng et al. Citation2019; Ozdemir et al. Citation2021). However, for geometric correction-based methods, many existing regularization algorithms have their own advantages and disadvantages. This, coupled with the complexity of building shapes, it is almost impossible to use a single regularization algorithm to regularize all buildings extracted from RS images. Accurate regularization of the outlines of each building using geometric correction-based strategy has become a challenge.
To solve this problem, we develop a novel building regularization method which integrates different regularization algorithms through machine-learning, enabling each building outline can be regularized by an appropriate algorithm according to its own geometric characteristics. First, a collection of metrics including size, orientation and shape was considered to describe the geometric characteristics of each building in the dataset. Principal component analysis (PCA) was then used to analyze the relationships between these descriptive metrics and select key metrics. In addition, three algorithms–rectangle transformation, recursive regression, and feature edge reconstruction–were chosen as candidate methods to regularize the building outlines. Finally, a machine-learning based model was designed to select the most appropriate regularization algorithm for each building by inputting its key metrics. Overall, the hybrid strategy based on intelligent technology proposed in this paper can give full play to the advantages of existing geometrical algorithms in the field of cartography and graphical information science to cope with the challenge of increasingly complex data, so as to improve the quality and efficiency of automated mapping.
The remainder of this paper is organized as follows. Section 2 reviews building mapping from RS images and building regularization algorithms. The proposed method is described in Section 3. Section 4 presents the experimental data, results, and analysis. Finally, Section 5 concludes the paper.
2. Related work
2.1. Extracting building outlines from RS images
Several segmentation methods have been developed to extract building outlines from RS images. Traditional methods, including shadow-, edge-, and object-based methods (Attarzadeh and Momeni Citation2012; Awrangjeb et al. Citation2013; Chen et al. Citation2014), extract building outlines using empirical features that measure the characteristics of edges, shapes, and textures. However, these features are heavily influenced by factors such as lightings, atmosphere, and building style, and traditional methods have difficulty solving the problem of building recognition in complex scenes. In addition, these methods rely heavily on the design of hand-crafted features; as a result, most of them lack good generalization ability.
In recent years, deep-learning-based semantic segmentation models, such as U-Net (Ronneberger et al. Citation2015), SegNet (Badrinarayanan et al. Citation2017), Mask R-CNN (He et al. Citation2017), and fully convolutional networks (FCNs) (Long et al. Citation2015), have been widely used in building outline extraction. For example, an FCN extends the structures of convolutional neural networks (CNNs) and achieves pixel-to-pixel prediction, thereby solving the problem of image segmentation at the semantic level. Schuegraf and Bittner (Citation2019) proposed a hybrid FCN with fused depth and spectral information. Maggiori et al. (Citation2017) designed a multiscale neuron module and fine-tuning method to improve the results. Zhang et al. (Citation2019) proposed a multitasking FCN to reduce missing rates and effectively extract specific buildings. In addition to the FCN, Guo et al. (Citation2020) proposed a multi-loss method based on U-Net, which uses pixel-based loss to constrain the extracted results. Liu et al. (Citation2019) proposed a model that integrates spatial pyramid pooling with an encoder-decoder structure to retain more detailed information. Abdollahi et al. (Citation2022) implemented a deep neural network composing SegNet and U-Net to recognize buildings using high-resolution imagery. Su et al. (Citation2020) proposed an advanced cascade Mask R-CNN that fully utilizes multi-level feature maps to improve the prediction accuracy. In addition, with the great success of transformer in the field of natural language processing (NLP), researchers began to explore the application of transformer to extract building outlines (Cui et al. Citation2023; Song et al. Citation2023). Xu et al. (Citation2023) designed two parallel branches of the convolutional encoder branch and the transformer encoder branch to extract multiscale feature maps. Wang et al. (Citation2022) put forward a ViT-based model with a dual-path structure, which greatly improves its potential in processing large-sized remote sensing images.
Although the aforementioned methods have achieved good results in building segmentation, most of them do not pay sufficient attention to regularization requirements, resulting in many redundant points and ignoring geometric features such as orthogonality. Some studies have attempted to use learn-based methods to adjust building outlines (Kong et al. Citation2022; Mai et al. Citation2023). For example, Liu et al. (Citation2022) proposed a convolutional recurrent neural network (RNN) embedded with line segment information that can predict every possible corner of an individual building. Cheng et al. (Citation2019) proposed a network based on polar coordinates that can prevent self-intersection and make the extracted outlines closer to the ground truth. In the method proposed by Wei et al. (Citation2022), a refinement block was added to adjust raw building outlines. In this block, a learning-based vertex classification operator is implemented to remove redundant points, and an effective polygon regularization operator is used to adjust the retained edges of the building. Liang et al. (Citation2020) proposed PolyTransform, which learns the transformation of polygon vertices through a deforming network, enabling better alignment with object boundaries. Girard et al. (Citation2021) employed frame field learning to guide the precise extraction of building outlines. While these methods improve the accuracy of generated building outlines, they may still suffer from issues such as corner loss, node distortion and data redundancy. Additionally, compared to geometric correction-based methods, they require a large number of training samples and incur high computational costs.
2.2. Geometric correction-based methods for regularizing building outlines
Many algorithms have been developed to address irregular building outlines extracted from RS images and LiDAR data, making them more regular and orthogonal (Guo et al. Citation2021). For example, Xie et al. (Citation2020) detected sawtooth features along extracted building outlines based on the area measure and number of corner points. They eliminated the sawtooth phenomenon and obtained finer building outlines using morphological filtering. In the method proposed by Xia et al. (Citation2020), the original building outlines are compressed using the Douglas-Pucker (DP) algorithm, and their overall trend is obtained by calculating the length and slope of the line segment formed by two adjacent points.
Because most buildings have mutually perpendicular orientations, many researchers have developed building regularization methods with perpendicularity constraints. To enhance the orthogonality of the building shape, Lokhat and Touya (Citation2016) attempted to form right and flat angles by iteratively moving the vertices based on a non-linear least-squares method. Wei et al. (Citation2020) first identified the main orientation of buildings by calculating the angles between long edges. Each building edge is then rotated parallel or perpendicular to the closest main orientation. Kong et al. (Citation2023) developed a multilevel regularization method for building outlines, encompassing “overall–local–detail” levels, which significantly improved the orthogonality of the buildings.
Simplification methods in cartography can also be applied to regularize building outlines. The DP algorithm has been extensively used to approximate building outlines (Yu et al. Citation2022). The DP algorithm has the advantage of significantly removing redundant vertices; however, it may also delete critical points, such as corner points. In addition, several algorithms (Regnauld et al. Citation1999; Chen et al. Citation2011; Xu et al. Citation2013) produce simple building representations based on the removal of local structures, including short edges and small concaves. These algorithms have the advantage of removing small waves and zigzag structures distributed on raw building outlines. Other algorithms emphasize the preservation of the main structures of building shapes. For example, Bayer (Citation2009) combined a recursive division strategy and perpendicular regression operator to output simple building outlines. Yan et al. (Citation2017) developed a template matching strategy to remove unwanted details. A simpler version was obtained by approximating the building outline using a template that was most similar to its shape.
The aforementioned algorithms provide solutions for regularizing building outlines based on different rules and constraints, and each has its own advantages and disadvantages when dealing with buildings with different geometric characteristics. Hybrid methods have also been investigated to process the outlines of each building properly. For example, Yang et al. (Citation2022) combined various algorithms to simplify buildings using evaluation strategies. For each building, multiple candidate solutions were generated using different algorithms, and the most appropriate solution was determined as the final result by a trained evaluator. This evaluation-based strategy requires each building to be handled first with multiple algorithms. Considering that building outlines extracted from RS images usually contain a large number of vertices, this strategy is time-consuming and costly. In this paper, a new hybrid method for regularizing building outlines is proposed. The key idea is to construct a decision model that can determine the appropriate regularization algorithm for each building outline based on its descriptive metrics.
3. Methodology
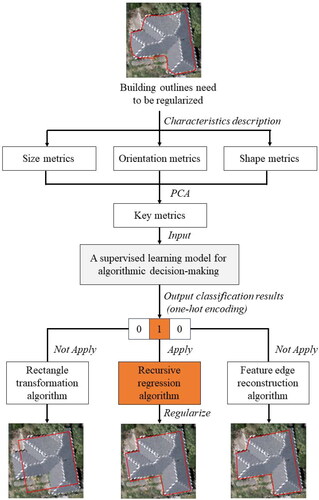
In this study, we have constructed a supervised learning model tailored for algorithmic decision-making. For each building outline need to be regularized, this model requires the input of its size, orientation, and shape metrics; subsequently, it selects the most appropriate one from three regularization algorithms as the output, thus completing the regularization process. illustrates the overall framework of the proposed method for regularizing building outlines. Details regarding metrics, three regularization algorithms, and the supervised learning model are provided in the following sections.
Figure 2. Overall framework of the proposed building outline regularization method.
3.1. Selecting metrics for describing the building outline
The buildings extracted from the RS images are characterized by a variety of sizes and complex forms. To fully represent the geometric characteristics of each building outline, size, orientation, and shape were considered as descriptive metrics. Regarding size metrics, considering that the building outline can be represented as a two-dimensional polygon, the commonly used perimeter (P) and area (A) metrics were adopted. The longest axis (LA), average distance (AD), and convex hull area (CHA) of the buildings were also used. Finally, five metrics were considered to quantify the size of each building outline, as summarized in .
Table 1. Statistical description of the experimental building datasets, Max, Maximum; Min, Minimum; Avg, Average.
The orientation characteristics of each building outline are usually reflected by the orientation of the prominent edges of the building polygon, the relevant shapes, or statistical distributions. Therefore, three metrics, i.e. longest axis orientation (LAO), minimum bounding rectangle orientation (MBRO), and statistical weighted orientation (SWO) (Duchêne et al. Citation2003), were used to qualify the orientation of building outlines, as summarized in .
Table 2. Component contribution rates.
For shape measurement, various metrics, including compactness, eccentricity, overlap index, fractality, circularity, elongation, ellipticity, and concavity, have been proposed in the previous studies (Basaraner and Cetinkaya Citation2017). In this study, typical metrics were selected to quantify the shape of the building outlines, as summarized in .
Table 3. Component coefficient matrix.
In this way, a total of 22 metrics including the size, orientation, and shape were used to describe the geometric characteristics of the building outlines. Note that there may be potential repetitions or strong correlations between these metrics. Moreover, additional metrics inevitably require additional computation costs. Therefore, it is necessary to further analyze the relationships between these metrics and select key metrics that can contain more information as inputs for subsequent algorithmic decision-making.
In this study, PCA, a classic data dimensionality reduction method, can reveal the internal structures of multiple metrics through a few principal components; that is, it can derive a few principal components from the original metrics while retaining as much information as possible. Therefore, PCA was used to meticulously select key metrics from 22 original metrics.
The key theoretical step in PCA is to calculate the covariance matrix composed of n-dimensional vectors, which is defined as: where n represents the total number of metrics, ∂ represents the covariance between any two metrics. The covariance matrix reflects the linear correlation between metrics. In other words, it represents the distribution of information in each dimension of the sample set in an n-dimensional space.
(1)
(1)
Next, the eigenvalues and eigenvectors of the covariance matrix are calculated, the eigenvalues are arranged in a descending order, and k eigenvalues () that are greater than 1 are selected. The eigenvalue size reflects the information contained in the sample set in the dimensions of the corresponding eigenvector. Therefore, PCA can only retain the dimensions with large eigenvalues to achieve dimensionality reduction. Finally, based on k eigenvalues and their corresponding eigenvectors, a coefficient matrix reflecting the correlation between the input metrics and each component is calculated. The metric selection criteria should satisfy two conditions: (1) the absolute value of the correlation coefficient between the components and metrics should be as large as possible, and (2) the selected metrics should not be strongly correlated with other metrics.
3.2. Creating a collection of regularization algorithms
In terms of selecting candidate algorithms, theoretically, the more algorithms applied, the better the performance; however, in practice, increasing the number of regularization algorithms will inevitably increase the complexity of the supervised learning model. Balancing efficiency and performance, three typical algorithms were adopted to generate candidate solutions for regularizing the building outlines: rectangle transformation (RT), recursive regression (RR), and feature edge reconstruction (FER).
These three algorithms are complementary in dealing with building outlines: RT algorithm can generate simple building outlines and is good at dealing with buildings with simple shapes and close to rectangles. In the face of buildings with complex shapes and structures, other two algorithms should be used: RR algorithm focuses on the maintenance of the overall shape structure of the building outline, which can maximize the orthogonality; The advantage of FER algorithm lies in the fine detection and processing of various local concave-convex structures, and pays more attention to the processing of details. Each of these algorithms brings its own advantages, and collectively, they are well-suited to meet the regularization requirements of the majority of building outlines in this study. These three algorithms are explained in detail below.
3.2.1. Rectangle transformation (RT) algorithm
In real life, many buildings are close to rectangles; therefore, the RT algorithm is one of the most commonly used algorithms for regularizing building outlines. The basic idea of this algorithm is to determine the MBR of the input building outline, move it to coincide with the center of gravity of the outline, and scale the MBR to the building outline for replacement. The RT algorithm has the advantages of minimizing redundant points and preserving orthogonality. Therefore, this algorithm is typically considered first when dealing with building outlines with overall shaped structures that are close to rectangles.
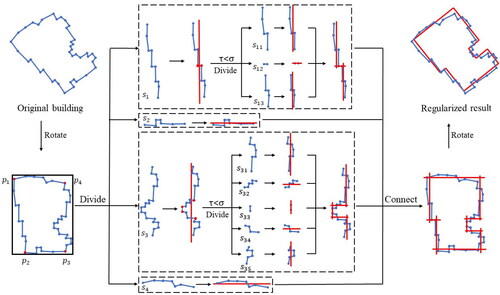
3.2.2. Recursive regression (RR) algorithm
The RT algorithm may not be suitable for building outlines that deviate significantly from a rectangle, because it could result in the loss of the original shape structures. In contrast, the RR algorithm is an iterative method that can effectively handle buildings with complex shapes. Its adaptability in handling irregular shapes makes it one of the preferred algorithms for building outline regularization. The RR algorithm comprise of three main steps.
Step 1. The original building outlines are rotated until the edges of the MBR are parallel to the horizontal orientation.
Step 2. The four points (p1, p2, p3, p4) closest to the vertices of the MBR on the outline are rotated, and the outline is divided into four segments (s1, s2, s3, and s4). The regression line and its corresponding standard deviation
is calculated for each segment.
Step 3. The size of
Figure 3. Illustration of the recursive regression (RR) algorithm. The red lines denote the regularized building outlines.
3.2.3. Feature edge reconstruction (FER) algorithm
The motivation of the RR algorithm is to preserve the overall structures of building outlines. As a result, it may prioritize to the global structure at the expense of some local details. This may not be suitable for building outlines that require the removal of only partially concave and convex structures. In such cases, the FER algorithm is considered a candidate algorithm for better regularization solutions. The FER algorithm consists of three main steps, as illustrated in :
Figure 4. Illustration of the feature edge reconstruction (FER) algorithm. The red and blue lines denote the non-feature and feature edges, respectively.
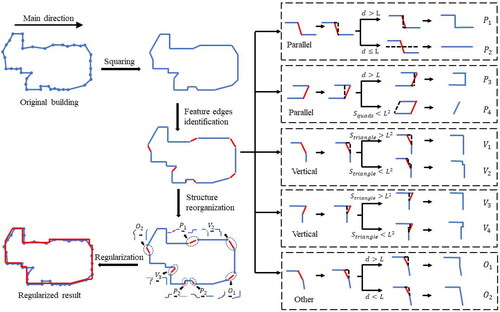
Step 1. The statistical weighting orientation (SWO) is calculated as the main orientation, and the relationship between each edge and the main orientation is determined. Next, a squaring process is performed: if two adjacent edges tend to be parallel, the connecting point is removed; if these two edges tend to be vertical, one edge is rotated around the end-point to the main orientation or to the vertical of the main orientation, and the other edge is rotated around the mid-point to be vertical to the first edge.
Step 2. All edges that satisfy one of the following three conditions are identified as feature edges: (1) the length is greater than the average length, (2) vertical or parallel to the main orientation, and the length is greater than a given threshold
Step 3. For each non-feature edge, the spatial relationship between two adjacent feature edges, including parallel, vertical, and others, is further distinguished. Different edge reconstruction strategies have been adopted for different relationships.
Parallel relationship: The distance d between two feature edges is calculated. If
If the angle is 0°, this structure is fitted into a line using the least-squares method (such as P2 in ).
If the angle is 180° and
If the angle is 180°and
Vertical relationship: The
Other relations: If
3.3. Constructing a supervised learning model for algorithm decision
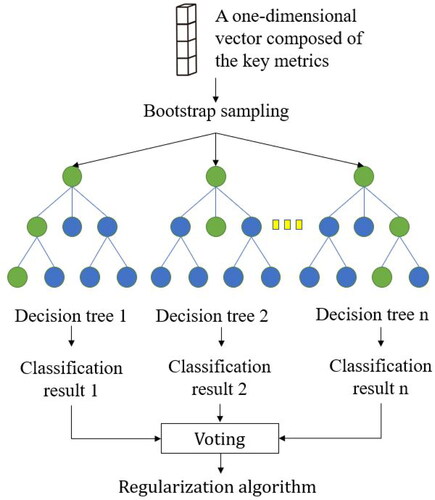
In this study, we employed random forest (RF) as the decision model. The core steps of RF are as follows: For a given dataset with each sample consisting of
features, bootstrap sampling is first conducted on
to generate a new dataset
Subsequently, decision trees are constructed for each sample in dataset
where at each node of the tree, a subset of features is randomly selected from the original
features. Then, the splitting feature is selected by calculating the Gini impurity. This process is repeated until decision tree construction criteria are met. Finally, each decision tree predicts independently, the final prediction is a majority vote based on the classification results of each tree.
The input of the RF-based model is a one-dimensional vector composed of the key metrics of a building outline sample, and the output is the recommended regularization algorithm for that sample, illustrates the decision-making process of RF-based model. In addition, the model is trained using supervised learning, specifically, the key metrics of the building outlines were calculated, and the most suitable regularization algorithms for those samples were manually labeled to train the model and obtain classification knowledge.
Figure 5. The decision process of RF-based model.
4. Experimental results and evaluation
4.1. Experimental datasets
The experimental building outlines were automatically extracted from the high-resolution RS images using the Mask R-CNN model (He et al. Citation2017). This model first generates feature maps using a base network. The refined region of interest (RoI) was then provided by a region proposal network (RPN). The RoIAlign layer is then used to obtain more accurate spatial positioning information. Finally, the bounding box, category, and segmentation mask of the target are predicted using the mask branches. In this experiment, 4736 images with a size of 512 × 512 images from the WHU building dataset (Ji et al. Citation2019) were used to train the Mask R-CNN, 1036 images were selected as the validation set and 1702 images as the test set. The learning rate and batch size were set to 0.003 and 4, respectively, and 500 training epochs were performed using the stochastic gradient descent method. Next, we used the mean average precision (mAP) as the indicator for model accuracy. Since there is only one category, buildings, the mAP value is identical to the average precision (AP) value for buildings. From the experiments on the validation set, we obtained mAP = 0.832. A well-trained Mask R-CNN was used to extract two sets of that is, datasets I and dataset II, which are shown in yellow and blue in . Overall, the deep-learning method accurately identified the foreground pixels of all buildings with little confusion with other geographical elements, thus achieving satisfactory results.
Figure 6. The experimental building outlines extracted from high-resolution remote sensing (RS) images using the trained Mask R-CNN model. The yellow and blue polygons denote datasets I and II, respectively.
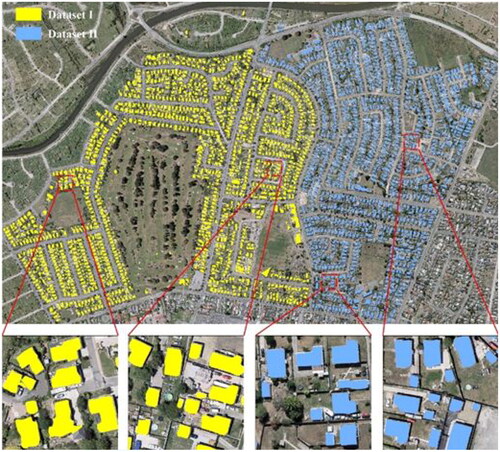
lists the statistical description of the dataset I and dataset II. As buildings were man-made objects, they exhibit significant orthogonality. However, the raw extracted building outlines lost many linear and orthogonal characteristics, which requires further regularization.
For each building in dataset I, three regularization algorithms were applied to generate different regularization results. Subsequently, volunteers with relevant expertise selected the most appropriate regularization algorithm for each building, which was then used as the label. In the annotated results, the proportions of building outlines regularized by the RT, RR, and FER algorithms were 41.75%, 27.75%, and 30.5%, respectively.
4.2. Metric selection results using PCA
Twenty-two metrics describing the size, orientation, and shape of the building outlines in datasets I and II were calculated, and PCA was used for analysis. lists the contributions of generated components. The eigenvalues of the first four components were all greater than 1, and their cumulative variance percentage reached 87.01%. This indicates that the first four components contain most of the information of the original twenty-two metrics and can be used as the principal components to determine the key metrics.
lists the correlations between the first four components and these descriptive metrics. The selection of key metrics is based on two considerations: (1) the key metrics need to have a high correlation with the components, and (2) they need to be representative in terms of size, orientation, and shape. The metrics that are most correlated with component 1 are A, P, LA, CHA (size metrics), and NE (shape metrics). Due to the strong correlation between the A, P, LA, and CHA metrics, and considering that A and CHA were two-dimensional while P and LA were one-dimensional, A and LA were selected as the representative size metrics. Therefore, the A, LA, and NE metrics were used as key metrics to represent component 1. The correlation coefficients of FR and FD metrics with component 2 are both −0.346, higher than the other metrics, so component 2 probably mainly related to shape. At the same time, since the FR and FD metrics were highly correlated with each other, choosing either one was sufficient. Thus, we selected the FR metric as the representative. The most correlated metrics with component 3 were LAO and SWO metrics, with correlation coefficients of 0.682 and 0.676, respectively, much higher than the other metrics. Therefore, component 3 probably mainly related to orientation. Similarly, the LAO and SWO metrics were highly correlated with each other, and thus we selected LAO as the representative. The most correlated metrics with component 4 were ELO and CA metrics, with correlation coefficients of 0.441 and −0.412, respectively, describing elongation and concavity. They were not strongly correlated to each other; thus, they were both selected. Finally, seven metrics, i.e. A, LA, NE, FR, LAO, ELO, and CA, were used as the key metrics for describing the building outlines in our experiments.
4.3. Prediction results of the algorithm decision models
First, the samples of dataset I were randomly divided into training set and test set in a ratio of 8:2. Seven metrics were extracted for each building outline and used as inputs for the RF-based decision-making model. In addition, to evaluate the performance of the model, we used two other machine learning models including back propagation neural networks (BPNN) and support vector machines (SVM).
Classification performance was quantitatively evaluated using accuracy, precision, recall and F1 metrics. The accuracy metric is defined as the ratio of the number of correctly classified samples to the total number of samples. Precision, recall, and F1 were defined as follows:
(2)
(2)
(3)
(3)
(4)
(4)
where TP, FP, and FN are the numbers of true-positive, false-positive, and false-negative classification results, respectively.
The accuracies of the classification results for the test samples in dataset I using the BPNN-, SVM-, and RF-based decision-making models were 60.75%, 62.75%, and 72.5%, respectively. presents the confusion matrices of the results, and the precision, recall, and F1 metrics for the three regularization algorithms.
Table 4. Confusion matrices, and precision, recall, and F1 metrics for testing samples in dataset I using three decision models.
Overall, the RF-based model performed better in terms of classification accuracy than the BPNN- and SVM-based models. This could be attributed to RF's capability to evaluate feature importance, potentially allowing for the identification and emphasis on the most impactful features, subsequently boosting the model’s performance. As shown in , the precision and recall rates of the samples predicted using the RT algorithm are higher than those predicted using the RR and FER algorithms. The performance of the FER algorithm is not quite satisfactory, as it characterized by optimizing the local structures of building outlines, which may result in a weaker adherence to the orientation of the building outlines, while the RR algorithm can better maintain the overall structure of the building outlines. During manual annotation, we might be more inclined to focus on the overall structure of the buildings instead of the local structure, which will lead to a relatively poor prediction result of FER algorithm. In many cases, both the RR and FER algorithms regularized the building outlines well, and as a result, it is difficult for model decision results to be consistent with manual selection results, resulting in a relatively low classification accuracy for these two algorithms. Particularly, BPNN and SVM may exhibit higher sensitivity to these cases, thus result in more susceptible to performance declines. In contrast, the integrated characteristics of RF equip it with enhanced robustness and precision when encountering data irregularities. However, because the selected candidate results were considered satisfactory overall, misclassification between the RR and FER algorithms may not have had a significant impact on the final outcome.
4.4. Results of regularizing building outlines and quality evaluation
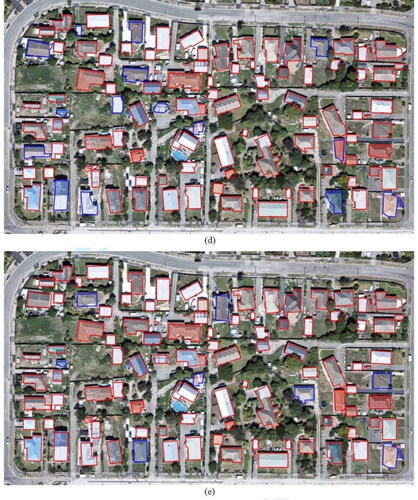
Because the classification accuracy of the RF-based decision-making model was higher than that of the other two models, we used it as the benchmark model and further applied it to regularize the extracted building outlines in dataset II. In addition, the RT, RR, and FER algorithms were independently used to regularize the outlines and were compared with the proposed method to verify the effectiveness of the hybrid strategy. The regularization threshold for the three algorithms was set to the same value, i.e. 6 m, to ensure that similar regularization degrees could be obtained. shows the regularization results produced by the proposed method and three algorithms.
Figure 7. Comparison of the regularization results of three algorithms and the proposed method implemented in this study: (a) extracted irregular building outlines; (b) results of applying the rectangle transformation (RT) algorithm; (c) results of applying the recursive regression (RR) algorithm; (d) results of applying the feature edge reconstruction (FER) algorithm; (e) results of applying the proposed method. The green, red, and blue lines superimposed on the buildings denote the extracted irregular building outlines, good regularization results, and unreasonable regularization results, respectively.
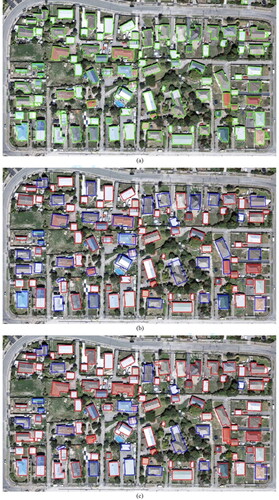
In addition, it can be seen from that for some building outlines, the regularized results of the multiple algorithms were very similar and reasonable. For example, the regularized results of the RT and RR algorithms for the building outlines in Case 5 were similar. Therefore, for the proposed method, regardless of which is selected in the classification model, the final regularization result is acceptable. This result is consistent with the previous analysis.
Table 5. Comparison of the regularization results using different methods.
Further, to quantitatively compare the three algorithms with the proposed method, six metrics, namely, position change (PC), orientation change (OC), area change (AC), shape change (SC), point reduction rate (PRR), and orthogonality preservation (OP) were calculated to evaluate the quality of the building outline regularization results in dataset II. in Appendix lists the equations and descriptions of these metrics, and lists the average values of the six metrics for all building outlines in dataset II regularized by the three single algorithms, and the proposed method.
Table 6. Evaluation of the regularization results obtained by RT, RR, FER algorithms and proposed method.
First, the changes in position and shape (i.e. PC and SC metrics) in the results of the FER algorithm were smaller than those of the RT, RR and the proposed methods. This is because the FER algorithm moved or deleted local concave-convex structures to better maintain the overall. For the OC, AC and PRR metrics, the RT algorithm performed best because it could minimize redundant points while keeping the orientation and area unchanged. In terms of orthogonality preservation (i.e. OP metrics), the regularization results of the RT and RR algorithms were all at right angles, which maximized orthogonality. However, it is difficult for a single algorithm to consider all the metrics. For example, the FER algorithm exhibited poor performance in the AC, OP, and PRR metrics. The proposed method was slightly inferior to the single algorithm in terms of each evaluation metric; however, it showed a certain balance and coordination overall, and produced less poor regularization results, which had certain advantages. Through the above qualitative and quantitative analyzes, it was found that the single algorithm had more or less unreasonable regularization results, whereas the proposed method maintained a balance and achieved good results overall, which was superior to a single algorithm.
4.5. Comparison with other geometric correction-based methods
To demonstrate the advantages and disadvantages of the proposed method, two existing geometric correction-based regularization methods for building outlines were developed for comparison. One was the building footprint regularization tool provided by the ArcGIS software (ESRI, Redlands, CA, USA), a renowned and extensively utilized method. Another was an advanced and effective regularization algorithm (Coarse Adjustment and Fine Adjustment, CAFA) proposed by Wei et al. (Wei et al. Citation2020), both of which are representative. Note that the parameters of the ArcGIS and CAFA methods are differently defined. Therefore, we tuned the parameters of the two reference methods to output the similar regularization degree of our method. As a result, in the ArcGIS method, the maximum distance of the boundary offset was set to 3.5 m and the spatial grid precision was set to 0.25. In the CAFA method, the distance threshold D in the DP algorithm was set to 1 m, the threshold L for distinguishing the long and short edges was set to 10 m; the angle thresholds and
to eliminate over-sharp and over-smooth angles in coarse adjustment, and
and
in fine adjustment were set to were set to
and
and
respectively, and the distance threshold d between the parallel lines was set to 3 m.
Additionally, to evaluate calculation efficiency, we added the average time (AT) metric, which represents the average time taken to process a single building using these methods. lists the average values of seven evaluation metrics for all the building outlines in dataset II regularized by the three methods. Several observations can be drawn from the statistical comparison. First, the changes for orientation and area (i.e. OC and AC metrics) in the results of the proposed method were much smaller than those of the ArcGIS and CAFA method, and in terms of PC and SC metrics, the proposed method slightly outperformed the other two methods. For PRR metric, the proposed method and ArcGIS method have similar performance and show advantage over the CAFA method. However, the proposed method performed slightly poor in terms of the orthogonality preservation (i.e. OP metric), with the other two methods almost maintaining completely right angles. This shortcoming arises from our decision model’s inclination to favor the FER algorithm for some specific building outlines. Considering FER's limited capacity to preserve orthogonality, it contributes to our method’s relative underperformance on the OP metric. Moreover, in terms of calculation efficiency, the average time of regulating a building (i.e. AT metric) in our approach is shorter than ArcGIS and CAFA methods.
Table 7. Evaluation of the regularization results obtained by ArcGIS, CAFA and proposed methods.
Overall, these three methods guarantee good regularization results for most building outlines. However, each of these methods has its own advantages and disadvantages for some building outlines. For a detailed comparison, and lists several typical examples of the regularization results obtained using the three methods. In case 6, results from the ArcGIS and CAFA methods exhibited self-intersections, a flaw absent in the outcomes of the proposed method. This stems from the inherent flaws present in both the ArcGIS and CAFA methods. Our method, which incorporates a selection strategy rooted in supervised learning models, effectively utilizes the intrinsic advantages of the RT algorithm and FER algorithm—both fundamentally adept at preventing self-intersections. Additionally, meticulous measures are undertaken during the manual annotation process to avert the incidence of self-intersections. Such scrupulous attention to detail promotes the model’s effective acquisition and assimilation of this knowledge, allowing our method to significantly mitigate or completely avoid instances of self-interactions.
Table 8. Cases where our method performs better.
Table 9. Cases where our method not meet expectations.
In case 7, it can be found that the CAFA method may produce small ladder structures around the regularized outline, which are unreasonable. The proposed method, while yielding a passable regularization result, exhibits a slight deviation in the orientation of the original building. Finally, for some buildings with specific shapes (e.g. close to a rectangle), such as in Case 8, the proposed method may produce excessive regularization, leading to the removal of locally important features. This is closely related to the samples used for training the decision-making model and requires further improvement in the performance of the classification model.
4.6. Comparison with learning-based method
Further, our method was compared to a classic learning-based method, Deep Snake (Peng et al. Citation2020). The Deep Snake relies on GT for training. In this experiment, 4736 images with a size of 512 × 512 images from the WHU building dataset were used to train the Deep Snake, 1036 images were selected as the validation set and 2416 images as the test set. For training the model, the batch size was set to 8. The learning rate started from 0.0001 and dropped by half at 80, 120, 150, and 170 epochs. The training process was carried out over a total of 200 epochs.
Here, we compared the regularization results obtained by the proposed method and Deep Snake with the GT. lists the average values of seven evaluation metrics for all buildings in the study area. Note that since Deep Snake requires a fixed number of N vertices (N = 128 in this experiment) to describe the output building outlines, the point reduction rate (i.e. PRR metric) is not applicable. Therefore, the number of points (i.e. NOP metric) is used instead of PRR.
Table 10. Evaluation of the regularization results obtained by Deep Snake and proposed methods using ground truth.
It can be observed that Deep Snake exhibits smaller changes in position, orientation, and area (i.e. PC, OC and AC metrics). This may be due to the fact that Deep Snake’s training process exploits GT, as its learning strategy continuously refines the initial outlines to better match the GT. In contrast, our method relies on the initial outlines extracted by the segmentation model and does not leverage GT, resulting in relatively low effectiveness in maintaining position, orientation, and area. However, it is noteworthy that our method outperforms Deep Snake in terms of shape change, number of points, and orthogonality (i.e. SC, NOP and AC metrics). This can be attributed to Deep Snake’s use of a significantly higher number of points compared to the actual number of building points, leading to excessive smoothing. By contrast, our method, with its stronger constraints on shape preservation, number of points, and orthogonality, achieves superior performance in these aspects. Moreover, while Deep Snake demonstrates higher calculation efficiency (i.e. AT metrics), it requires substantial time and computational resources for model training. In contrast, training a random forest is considerably simpler and faster.
and present two typical examples to intuitively compare our method with Deep Snake. In Case 9, our method yielded excellent results, nearly identical to the ground truth in terms of both orthogonality and shape. In contrast, the results obtained by Deep Snake were smoother at the building corners, diminishing orthogonality. In Case 10, Deep Snake produced results that closely matched the GT, while our method showed deviations. This discrepancy is likely due to the failure to successfully select the optimal algorithm from RT, RR, and FER. Additionally, it is worth noting that the drawback of this selection strategy is that if none of the RT, RR, and FER algorithms produce satisfactory regularization results for a building outline, our method may fail to deliver satisfactory outcomes.
Table 11. Cases where our method performs better.
Table 12. Cases where our method not meet expectations.
5. Conclusion
Outline regularization is an essential step in building mapping from RS images. In this study, an algorithmic decision-making model supported by machine learning was proposed to achieve an optimal combination of multiple algorithms. Experimental results show that compared with the independent use of single algorithms, the proposed method has overall advantages in enhancing the orthogonality of building outlines, preserving the position, orientation, area, and shape of buildings, and produced fewer unreasonable regularization results, demonstrating the effectiveness and flexibility of the integration strategy. Similarly, compared to the geometric correction-based methods of ArcGIS and CAFA, the proposed method showed advantages in preserving the area and orientation of the building outlines but performed slightly worse in preserving orthogonality. Compared to the learning-based method Deep Snake, our method shows significant advantages in preserving the shape and orthogonality, though it is slightly inferior in preserving position, orientation, and area.
Additionally, our method has some limitations. First, it relies on the building outlines extracted by the segmentation model. For blob-like building segmentation results, the generated regularization results may deviate from the ground truth. Second, for a few building outlines, the regularization results generated by any of the RT, RR and FER algorithms may be unreasonable. In such cases, our method can only select one among them.
Regarding future research, on the one hand, a single algorithm providing multiple regularization results at multiple scales as the regularization candidates may also has the potential to enhance the proposed selection strategy and improve the results. On the other hand, it is worthwhile to integrate more diverse algorithms to improve the regularization ability of buildings with different characteristics. However, a more rational learning strategies and models with stronger representations should be explored to improve the decision-making abilities of classification models. In addition, a hybrid strategy that combines multiple algorithms can be considered for the RS mapping of other geographic features.
Data availability statement
The code and data that support the findings of this study are available in Figshare at: https://doi.org/10.6084/m9.figshare.25347187.
Disclosure statement
No potential conflict of interest was reported by the author(s).
Additional information
Funding
References
- Abdollahi A, Pradhan B, Alamri AM. 2022. An ensemble architecture of deep convolutional Segnet and Unet networks for building semantic segmentation from high-resolution aerial images. Geocarto Int. 37(12):3355–3370. doi: 10.1080/10106049.2020.1856199.
- Acuna D, Ling H, Kar A, Fidler S. 2018. Efficient interactive annotation of segmentation datasets with Polygon-RNN++. Proceedings of the IEEE/CVF Conference on Computer Vision and Pattern Recognition (CVPR), Salt Lake City, UT, USA, p. 859–868. doi: 10.1109/CVPR.2018.00096.
- Arkin EM, Chew LP, Huttenlocher DP, Kedem K, Mitchell JS. 1991. An efficiently computable metric for comparing polygonal shapes. IEEE Trans Pattern Anal Machine Intell. 13(3):209–216. doi: 10.1109/34.75509.
- Attarzadeh R, Momeni M. 2012. Object-based building extraction from high resolution satellite imagery. Int Archiv Photogrammetr Remote Sens Spatial Information Sci. 39(B4):57–60. doi: 10.5194/isprsarchives-XXXIX-B4-57-2012.
- Awrangjeb M, Zhang C, Fraser CS. 2013. Improved building detection using texture information. Int Arch Photogramm Remote Sens Spatial Inf Sci. XXXVIII-3/W22:143–148. doi: 10.5194/isprsarchives-XXXVIII-3-W22-143-2011.
- Badrinarayanan V, Kendall A, Cipolla R. 2017. SegNet: a deep convolutional encoder-decoder architecture for image segmentation. IEEE Trans Pattern Anal Mach Intell. 39(12):2481–2495. doi: 10.1109/TPAMI.2016.2644615.
- Basaraner M, Cetinkaya S. 2017. Performance of shape indices and classification schemes for characterising perceptual shape complexity of building footprints in GIS. Int J Geograph Information Sci. 31(10):1952–1977. doi: 10.1080/13658816.2017.1346257.
- Bayer T. 2009. Automated building simplification using a recursive approach. In: Gartner G. and Ortag F. eds. Cartography in Central and Eastern Europe. Berlin, Heidelberg: Springer; p. 121–146.
- Buchin K, Meulemans W, Renssen AV, Speckmann B. 2016. Area-preserving simplification and schematization of polygonal subdivisions. ACM Trans Spatial Algorithms Syst. 2(1):1–36. doi: 10.1145/2818373.
- Cheng D, Liao R, Fidler S, Urtasun R. 2019. Darnet: deep active ray network for building segmentation. Proceedings of the IEEE/CVF Conference on Computer Vision and Pattern Recognition.
- Chen W, Long Y, Shen J, Li W. 2011. Structure recognition and progressive simplification of the concaves of building polygon based on constrained D-TIN. Geomatics and Information Sci Wuhan Univ. 36(5):584–587.
- Chen X, Qiu C, Guo W, Yu A, Tong X, Schmitt M. 2022. Multiscale feature learning by transformer for building extraction from satellite images. IEEE Geosci Remote Sensing Lett. 19:1–5. doi: 10.1109/LGRS.2022.3142279.
- Chen D, Shang S, Wu C. 2014. Shadow-based building detection and segmentation in high-resolution remote sensing image. J Multim. 9(1):181–188.
- Chen M, Wu J, Liu L, Zhao W, Tian F, Shen Q, Zhao B, Du R. 2021. DR-Net: an improved network for building extraction from high resolution remote sensing image. Remote Sens. 13(2):294. doi: 10.3390/rs13020294.
- Cui L, Jing X, Wang Y, Huan Y, Xu Y, Zhang Q. 2023. Improved swin transformer-based semantic segmentation of postearthquake dense buildings in urban areas using remote sensing images. IEEE J Sel Top Appl Earth Observations Remote Sensing. 16:369–385. doi: 10.1109/JSTARS.2022.3225150.
- Duchêne C, Bard S, Barillot X, Ruas A, Trevisan J, Holzapfel F. 2003. Quantitative and qualitative description of building orientation. Proceedings of the Fifth Workshop on Progress in Automated Map Generalisation, ICA, Commission on Map Generalisation, Beijing, China.
- Dunaeva AVe, Kornilov FA. 2017. Specific shape building detection from aerial imagery in infrared range. Vestnik Yuzhno-Ural’skogo Gosudarstvennogo Universiteta. Seriya" Vychislitelnaya Matematika i Informatika". 6(3):84–100.
- Feng D, Xie Y, Xiong S, Hu J, Hu M, Li Q, Zhu J. 2021. Regularized building boundary extraction from remote sensing imagery based on augment feature pyramid network and morphological constraint. IEEE J Sel Top Appl Earth Observ Remote Sens. 14:12212–12223. doi: 10.1109/JSTARS.2021.3130038.
- Feng M, Zhang T, Li S, Jin G, Xia Y. 2019. An improved minimum bounding rectangle algorithm for regularized building boundary extraction from aerial LiDAR point clouds with partial occlusions. Int J Remote Sens. 41(1):300–319. doi: 10.1080/01431161.2019.1641245.
- Ferraioli G. 2010. Multichannel InSAR building edge detection. IEEE Trans Geosci Remote Sens. 48(3):1224–1231. doi: 10.1109/TGRS.2009.2029338.
- Girard N, Smirnov D, Solomon J, Tarabalka Y. 2021. Polygonal building extraction by frame field learning. 2021 IEEE/CVF Conference on Computer Vision and Pattern Recognition (CVPR), 20–25 June 2021. doi: 10.1109/CVPR46437.2021.00583.
- Guo L, Deng X, Liu Y, He H, Lin H, Qiu G, Yang W. 2021. Extraction of dense urban buildings from photogrammetric and LiDAR point clouds. IEEE Access. 9:111823–111832. doi: 10.1109/ACCESS.2021.3102632.
- Guo M, Liu H, Xu Y, Huang Y. 2020. Building extraction based on U-net with an attention block and multiple losses. Remote Sens. 12(9):1400. doi: 10.3390/rs12091400.
- He K, Gkioxari G, Dollár P, Girshick R. 2017. Mask R-CNN. Proceedings of the IEEE International Conference on Computer Vision, Venice, Italy, p. 2980–2988. doi: 10.1109/ICCV.2017.322.
- Ji S, Wei S, Lu M. 2019. Fully convolutional networks for multisource building extraction from an open aerial and satellite imagery data set. IEEE Trans Geosci Remote Sens. 57(1):574–586. doi: 10.1109/TGRS.2018.2858817.
- Kong G, Fan H, Lobaccaro G. 2022. Automatic building outline extraction from ALS point cloud data using generative adversarial network. Geocarto Int. 37(27):15964–15981. doi: 10.1080/10106049.2022.2102246.
- Kong L, Qian H, Xie L, Huang Z, Qiu Y, Bian C. 2023. Multilevel regularization method for building outlines extracted from high-resolution remote sensing images. Appl Sci. 13(23):12599. doi: 10.3390/app132312599.
- Li Q, Zorzi S, Shi Y, Fraundorfer F, Zhu XX. 2021. End-to-end semantic segmentation and boundary regularization of buildings from satellite imagery. Proceedings of the IEEE International Geoscience and Remote Sensing Symposium IGARSS, Brussels, Belgium. p. 2508–2511. doi: 10.1109/IGARSS47720.2021.9555147.
- Liang J, Homayounfar N, Ma WC, Xiong Y, Hu R, Urtasun R. 2020. PolyTransform: deep polygon transformer for instance segmentation. Proceedings of the IEEE/CVF Conference on Computer Vision and Pattern Recognition (CVPR), Seattle, WA, USA. p. 9128–9137. doi: 10.1109/CVPR42600.2020.00915.
- Ling H, Gao J, Kar A, Chen W, Fidler S. 2019. Fast interactive object annotation with curve-GCN. Proceedings of the IEEE/CVF Conference on Computer Vision and Pattern Recognition (CVPR), Long Beach, CA, USA. p. 5252–5261. doi: 10.1109/CVPR.2019.00540.
- Liu Y, Gross L, Li Z, Li X, Fan X, Qi W. 2019. Automatic building extraction on high-resolution remote sensing imagery using deep convolutional encoder-decoder with spatial pyramid pooling. IEEE Access. 7:128774–128786. doi: 10.1109/ACCESS.2019.2940527.
- Liu Z, Tang H, Huang W. 2022. Building outline delineation from VHR remote sensing images using the convolutional recurrent neural network embedded with line segment information. IEEE Trans Geosci Remote Sens. 60:1–13. doi: 10.1109/TGRS.2022.3154046.
- Lokhat I, Touya G. 2016. Enhancing building footprints with squaring operations. J Spatial Information Sci. 2016(13):33–60.
- Long J, Shelhamer E, Darrell T. 2015. Fully convolutional networks for semantic segmentation. Proceedings of the IEEE Conference on Computer Vision and Pattern Recognition, Boston, MA, USA. p. 3431–3440. doi: 10.1109/CVPR.2015.7298965.
- Maggiori E, Tarabalka Y, Charpiat G, Alliez P. 2017. Convolutional neural networks for large-scale remote-sensing image classification. IEEE Trans Geosci Remote Sensing. 55(2):645–657. doi: 10.1109/TGRS.2016.2612821.
- Mai G, Jiang C, Sun W, Zhu R, Xuan Y, Cai L, Janowicz K, Ermon S, Lao N. 2023. Towards general-purpose representation learning of polygonal geometries. Geoinformatica. 27(2):289–340. doi: 10.1007/s10707-022-00481-2.
- Marcos D, Tuia D, Kellenberger B, Zhang L, Bai M, Liao R, Urtasun R. 2018. Learning deep structured active contours end-to-end. Proceedings of the IEEE Conference on Computer Vision and Pattern Recognition, Salt Lake City, UT, USA. p. 8877–8885. doi: 10.1109/CVPR.2018.00925.
- Ozdemir E, Karsli F, Kavzoglu T, Bahadir M, Yagmahan A. 2021. A novel algorithm for regularization of building footprints using raw LiDAR point clouds. Geocarto Int. 37(25):7358–7380. doi: 10.1080/10106049.2021.1974104.
- Partovi T, Bahmanyar R, Kraus T, Reinartz P. 2017. Building outline extraction using a heuristic approach based on generalization of line segments. IEEE J Sel Top Appl Earth Observations Remote Sens. 10(3):933–947. doi: 10.1109/JSTARS.2016.2611861.
- Peng S, Jiang W, Pi H, Li X, Bao H, Zhou X. 2020. Deep snake for real-time instance segmentation. Proceedings of the IEEE/CVF Conference on Computer Vision and Pattern Recognition (CVPR), Seattle, WA, USA. p. 8530–8539. doi: 10.1109/CVPR42600.2020.00856.
- Protopapadakis E, Doulamis A, Doulamis N, Maltezos E. 2021. Stacked autoencoders driven by semi-supervised learning for building extraction from near infrared remote sensing imagery. Remote Sens. 13(3):371. doi: 10.3390/rs13030371.
- Qiu F, Sridharan H, Chun Y. 2010. Spatial autoregressive model for population estimation at the census block level using LIDAR-derived building volume information. Cartography and Geographic Information Sci. 37(3):239–257. doi: 10.1559/152304010792194949.
- Raghavan R, Verma DC, Pandey D, Anand R, Pandey BK, Singh H. 2022. Optimized building extraction from high-resolution satellite imagery using deep learning. Multimed Tools Appl. 81(29):42309–42323. doi: 10.1007/s11042-022-13493-9.
- Regnauld N, Edwardes A, Barrault M. 1999. Strategies in building generalisation: modelling the sequence, constraining the choice. Processing of the 19th ICA Workshop on Progress and Developments in Automated Map Generalization, Ottawa, Canada.
- Ronneberger O, Fischer P, Brox T. 2015. U-Net: convolutional networks for biomedical image segmentation. Proceedings of the Medical Image Computing and Computer-Assisted Intervention – MICCAI 2015, Cham: Springer, p. 234–241.
- Schuegraf P, Bittner K. 2019. Automatic building footprint extraction from multi-resolution remote sensing images using a hybrid FCN. IJGI. 8(4):191. doi: 10.3390/ijgi8040191.
- Shrestha S, Vanneschi L. 2018. Improved fully convolutional network with conditional random fields for building extraction. Remote Sens. 10(7):1135. doi: 10.3390/rs10071135.
- Song J, Zhu AX, Zhu Y. 2023. Transformer-based semantic segmentation for extraction of building footprints from very-high-resolution images. Sensors. 23(11):5166. doi: 10.3390/s23115166.
- Su H, Wei S, Liu S, Liang J, Wang C, Shi J, Zhang X. 2020. HQ-ISNet: high-quality instance segmentation for remote sensing imagery. Remote Sens. 12(6):989. doi: 10.3390/rs12060989.
- Wang L, Fang S, Meng X, Li R. 2022. Building extraction with vision transformer. IEEE Trans Geosci Remote Sens. 60:1–11. doi: 10.1109/TGRS.2022.3186634.
- Wei S, Ji S, Lu M. 2020. Toward automatic building footprint delineation from aerial images using CNN and regularization. IEEE Trans Geosci Remote Sens. 58(3):2178–2189. doi: 10.1109/TGRS.2019.2954461.
- Wei S, Zhang T, Ji S, Luo M, Gong J. 2023. BuildMapper: A fully learnable framework for vectorized building contour extraction. ISPRS J Photogramm Remote Sens. 197:87–104. doi: 10.1016/j.isprsjprs.2023.01.015.
- Wei S, Zhang T, Ji S. 2022. A concentric loop convolutional neural network for manual delineation-level building boundary segmentation from remote-sensing images. IEEE Trans Geosci Remote Sens. 60:1–11. doi: 10.1109/TGRS.2021.3126704.
- Wu G, Shao X, Guo Z, Chen Q, Yuan W, Shi X, Xu Y, Shibasaki R. 2018. Automatic building segmentation of aerial imagery using multi-constraint fully convolutional networks. Remote Sens. 10(3):407. doi: 10.3390/rs10030407.
- Xia L, Zhang X, Zhang J, Wu W, Gao X. 2020. Refined extraction of buildings with the semantic edge-assisted approach from very high-resolution remotely sensed imagery. Int J Remote Sens. 41(21):8352–8365. doi: 10.1080/01431161.2020.1775322.
- Xie E, Sun P, Song X, Wang W, Liu X, Liang D, Shen C, Luo P. 2020. PolarMask: single shot instance segmentation with polar representation. Proceedings of the IEEE/CVF Conference on Computer Vision and Pattern Recognition (CVPR), Seattle, WA, USA. p. 12190–12199. doi: 10.1109/CVPR42600.2020.01221.
- Xie Y, Zhu J, Cao Y, Feng D, Hu M, Li W, Zhang Y, Fu L. 2020. Refined extraction of building outlines from high-resolution remote sensing imagery based on a multifeature convolutional neural network and morphological filtering. IEEE J Sel Top Appl Earth Observations Remote Sensing. 13:1842–1855. doi: 10.1109/JSTARS.2020.2991391.
- Xu L, Li Y, Xu J, Zhang Y, Guo L. 2023. BCTNet: bi-branch cross-fusion transformer for building footprint extraction. IEEE Trans Geosci Remote Sens. 61:1–14. doi: 10.1109/TGRS.2023.3262967.
- Xu W, Long Y, Zhou T, Chen L. 2013. Simplification of building polygon based on adjacent four-point method. Acta Geod Cartogr Sin. 42(6):929–936.
- Yan X, Ai T, Zhang X. 2017. Template matching and simplification method for building features based on shape cognition. IJGI. 6(8):250. doi: 10.3390/ijgi6080250.
- Yang HL, Yuan J, Lunga D, Laverdiere M, Rose A, Bhaduri B. 2018. Building extraction at scale using convolutional neural network: mapping of the United States. IEEE J Sel Top Appl Earth Observations Remote Sensing. 11(8):2600–2614. doi: 10.1109/JSTARS.2018.2835377.
- Yang M, Yuan T, Yan X, Ai T, Jiang C. 2022. A hybrid approach to building simplification with an evaluator from a backpropagation neural network. Int J Geograph Information Sci. 36(2):280–309. doi: 10.1080/13658816.2021.1873998.
- Yu M, Chen X, Zhang W, Liu Y. 2022. AGs-Unet: building extraction model for high resolution remote sensing images based on attention gates U network. Sensors. 22(8):2932. doi: 10.3390/s22082932.
- Yu T, Wan H, Tang P, Sheng L. 2022. Building footprint extraction model based on deep supervision and post-processing technology. Proceedings of the 3rd International Conference on Geology, Mapping and Remote Sensing (ICGMRS), Zhoushan, China. p. 209–212. doi: 10.1109/ICGMRS55602.2022.9849247.
- Zhang Q, Chang X, Bian SB. 2020. Vehicle-damage-detection segmentation algorithm based on improved mask RCNN. IEEE Access. 8:6997–7004. doi: 10.1109/ACCESS.2020.2964055.
- Zhang Z, Guo W, Yu W, Yu W. 2019. Multi‐task fully convolutional networks for building segmentation on SAR image. J Eng. 2019(20):7074–7077. doi: 10.1049/joe.2019.0569.
- Zhao K, Kang J, Jung J, Sohn G. 2018. Building extraction from satellite images using mask R-CNN with building boundary regularization. Proceedings of the IEEE Conference on Computer Vision and Pattern Recognition Workshops, Salt Lake City, UT, USA. p. 242–2424. doi: 10.1109/CVPRW.2018.00045.
- Zhou J, Liu Y, Nie G, Cheng H, Yang X, Chen X, Gross L. 2022. Building extraction and floor area estimation at the village level in rural China via a comprehensive method integrating UAV photogrammetry and the novel EDSANet. Remote Sens. 14(20):5175. doi: 10.3390/rs14205175.
- Zorzi S, Fraundorfer F. 2019. Regularization of building boundaries in satellite images using adversarial and regularized losses. Proceedings of the IEEE International Geoscience and Remote Sensing Symposium, Yokohama, Japan. p. 5140–5143.
Appendix
Table A1. Size metrics of building outlines.
Table A2. Orientation metrics of building outlines.
Table A3. Shape metrics of building outlines.
Table A4. Metrics used to evaluate the quality of the regularization results.