
 ?Mathematical formulae have been encoded as MathML and are displayed in this HTML version using MathJax in order to improve their display. Uncheck the box to turn MathJax off. This feature requires Javascript. Click on a formula to zoom.
Abstract
This paper contributes to the literature on carry trade by investigating the dynamic correlation and the dependence structure between the US-dollar carry trade and equity markets in the (Brazil, Russia, India, China and South Africa (BRICS)) economies during sample observations that include regular and crisis periods. Furthermore, the nonlinear Granger causality test based on the feed-forward neural networks (FFNN) model assesses how global volatility predicts the dynamic correlation between the US-dollar carry trade and equity markets in BRICS. The paper finds the dynamic correlations between carry trade and equity markets in BRICS are more pronounced during most global crises. Moreover, the results of the symmetrised Joe Clayton (SJC) copula model showed that the lower tail dependence between the two series is higher during the various crises. Furthermore, the results of the empirical analysis show that global volatility predicts the dynamic correlations between carry trade and equity markets in BRICS only during crises. Asset managers and investors can benefit from this paper's findings regarding portfolio diversification, risk management, asset allocation, and hedging when dealing with equity assets and carry trades.
1. Introduction
Given their exchange rates, the interest rate differential between developing, emerging, and developed economies has created an environment where investors contemplate arbitrage strategies to earn profit at low risk. In this case, investors use the carry trade strategy to reach this objective. The carry trade strategy refers to the situation in which investors move funds from a low-interest currency to invest in a high-interest currency. The profitability of a carry trade strategy is seen in a situation where the gains from an interest rate differential exceed the exchange rate movements. It implies the violation of the theory of uncovered interest rate parity (UIP), which refers to the idea that the difference in interest rates between two countries equals the expected change in exchange rates between the countries’ currencies. It is worth noting that if the UIP condition is not met, an investor could potentially make a risk-free profit through a carry trade strategy by borrowing a currency with a low-interest rate and then converting to and investing in a currency with a higher interest rate. If the exchange rate does not change as expected (based on the interest rate difference), the investor can then make a profit (see Galati & Heath, Citation2007).
Studies show that the carry trade strategy leads to capital flows moving from the funding currencies to the investment’s currency (Tse & Zhao, Citation2012). Therefore, the carry trade strategy might strengthen the investing currency in the short term by channelling funds into high-yielding financial asset markets, such as equity markets. This reality supports the view that equity markets and currency carry trade may be related. It is in that context that Tse and Zhao (Citation2012) investigated the relationship between currency carry trade and US stock markets. The authors find that there is a significant volatility spillover effect running from the US equity market to carry trade. Lee and Chang (Citation2013) found that significant positive relations existed between US equity returns and currency trade; meanwhile, the relationship appeared stronger in bear markets than in bull markets. Wu et al. (Citation2021) investigated the dynamics of the asymmetric dependencies between the carry trade, the bonds and equity markets and found a significant increase in the dependence between the carry trade and stock prices, while the carry trade and bonds were negatively related. Meanwhile, the interdependence between the carry trade and stock returns was more pronounced during the 2008 global financial crisis.
While the above-cited studies focused on the dynamic correlation and dependence between carry trade and equity market returns, none of the past studies has yet to assess the drivers of the correlation or dependence between the two markets, especially the role of global volatility in predicting their correlation. Given that global volatility may affect the source and investment countries differently in the context of carry trade, asset managers and investors should be interested in how to allocate portfolios made of positions in carry trade and equity markets during periods of high or low global volatility. Moreover, past studies are silent on how dynamic correlation or the dependence structure between carry trade and equity markets fare during the different crisis periods in BRICS economies. Being the leading emerging markets, BRICS countries have been attracting interest from investors and asset managers who should be interested in conditions defining the dynamic correlations between carry trade and equity returns.
This study will fill these gaps by investigating the dynamic correlations between carry trade and equity markets in the BRICS economies and assessing the role of global volatility in driving these correlations. Unlike Maake and Bonga -Bonga (Citation2021) who employ a VAR BEKK-GARCH model this paper uses a multivariate Vector Autoregressive Dynamic Conditional Correlation GARCH (VAR-DCC-GARCH) to investigate the dynamic conditional correlations between the US dollar carry trade returns and equity returns for each BRICS economy. The VAR DCC-GARCH model is a framework commonly used to capture the time-varying relationships (time-varying conditional correlation) between financial assets. The VAR part of the model allows us to capture the dependence structure between the assets returns while introducing the DCC GARCH part allows us to take into account the time-varying nature of the variances of the assets. The latter part enables us to model the time-varying volatility spill overs between the assets and more importantly it recognises that correlations between financial assets are not constant but vary over time. The VAR-DCC_GARCH separates the modelling of conditional variances from conditional correlations make it more accessible and easier to implement than the BEKK-GARCH. The estimated conditional correlations from the DCC-GARCH model directly represent the relationships between assets over time, which can be easier to understand and explain to non-technical audiences.
Furthermore, the time-varying symmetrised Joe-Clayton (SJC) copula model is employed to investigate the dynamic tail dependence between US dollar carry trade returns and equity returns of the BRICS economies. Copula model has been used extensively in model the dependence structure between assets. Copula models allow for the estimation of multivariate distributions by separating the modelling of the marginal distribution and the dependence structure. This ensures that no assumption is made on the distribution of the errors for the assets, meaning the errors need not follow the same distribution as in multivariate GARCH models. Moreover, unlike Wu et al. (Citation2021) who use student t copulas to model the dependence structure, we employ an SJC Copula which is a form of Archimedean copula and is able to flexibly capture the dependence structure in the tails. Nonlinear Granger causality tests are used to assess the role of global volatility in predicting the conditional correlations between the carry trade and stock market returns in BRICS economies.
The rest of the paper is organised as follows: Section 2 provides a literature review; Section 3 outlines the methodology; Section 4 discusses the data and the estimation results; and Section 5 concludes the study.
2. Literature Review
The theory of the currency carry trade stipulates the situation where investors use a strategy of moving funds from a low-interest-rate currency to invest in a high-interest-rate currency. Burnside et al. (Citation2008) argued that this strategy is not only applicable to two economies, meaning investors can create a portfolio of currencies on both the investment and funding sides. The carry trade strategy allows investors to optimise returns as the interest rate differential between countries changes. Burnside et al. (Citation2008) further argued that the carry trade strategy eventually depends on the failure of the uncovered interest rate parity (UIP theory).
The violation of the UIP theory is mainly driven by unexpected events, especially those associated with a currency crisis. In the study by Berg and Mark (Citation2018), it is stated that carry trade investors experience significant uncertainty due to the many global risk factors that have a spillover effect on the currency markets. They also find that positive carry trade returns are usually high during regular periods and significantly low during crises. Their results, like the conclusion reached by Burnside et al. (Citation2011), show that investors expect significant compensation to avoid the substantial losses that could occur when they invest in emerging markets during periods of uncertainty.
Fong (Citation2010) investigated the profitability of the yen carry trade using the stochastic dominance analysis from 2001 to 2009. He found that the yen carry trade generated high returns before the 2008 global financial crisis and reached the conclusion that yen carry trade returns outperformed the stock markets of many developed economies. Furthermore, Fong (Citation2010) applied a non-parametric test using stochastic dominance to assess whether high carry trade returns comove with the risk as reflected in global stock market indices.
Cheung et al. (Citation2012) examine the relationship between the yen carry trade and the equity markets of different investment currencies, including the Australian Dollar (AUD), Great British Pound (GBP), and New Zealand Dollar (NZD), using weekly data from 2001 to 2008. the authors employed a regression equation, where the error term exhibits GARCH effects and incorporated three different control variables like commodity prices, the volatility (VIX) index, and US stock returns. The authors found that carry trade returns and stock market returns are positively related. Tse and Zhao (Citation2012) investigated the relationship between US equity returns and yen-dominated carry trade by employing the VAR model and the Exponential GARCH (E-GARCH) model to investigate the volatility spillovers between the US stock returns and the yen carry trade. They found a significant unidirectional spillover of the volatility from the US equity returns to the carry trade market, and the correlation between these markets is strong during the period of high volatility. Lee and Chang (Citation2013) supplemented the study by Tse and Zhao (Citation2012) to investigate the relation between the spillover of currency carry trade and equity returns of the US market using G10 currencies as the target currency and the S&P 500 index. Lee and Chang (Citation2013) employed the generalised VAR model and a Markov-switching model to compute the magnitude of spillovers of currency-carry trade returns and their impact on equity returns under bear and bull market conditions. They found that a significant positive relationship exists between equity returns and spillovers of currency trades. Meanwhile, the relationship appeared stronger in bear markets than in bull markets.
Christiansen et al. (Citation2011) employed the logistic smooth transition regression (LSTR) model to show that the relationship between the carry trade returns and equity returns depends on different economic regimes. Using the daily data from 1995 to 2008, Christiansen et al. (Citation2011) found that the carry trade strategy depends heavily on different economic regimes. The authors argued that investment currencies had experienced a positive exposure to equities, and the exposure is even more significant during crisis periods. They further found that the carry trade returns and stock returns are positively correlated and somewhat negatively correlated with bond markets. Lettau et al. (Citation2014) employed the downside-risk capital assets pricing model (CAPM) to examine the link between carry trade and different assets (which includes currency returns, sovereign bonds, commodity returns, and equity returns) using monthly data running from June 1974 to March 2010. Lettau et al. (Citation2014) reached a similar conclusion to Brunnermeier et al. (Citation2008) to find that the correlation between carry trade and assets returns appears to be strong during market downturns than in upswings.
Bonga-Bonga and Maake (Citation2021) investigated the volatility spillovers between currency carry trade and assets markets (stock and bond markets) in South Africa using the multivariate VAR-BEKK-GARCH method. They found significant volatility spillover between currency carry trade and assets markets’ returns in South Africa. Maake and Bonga-Bonga provide evidence that carry trade transmits more shocks to the stock market than the bond market. This study expanded on this result by investigating the volatility spillover and conditional correlation between US dollar carry trade and the BRICS stock markets.
Wu et al. (Citation2021) investigated asymmetric dependencies and their dynamics across returns to bonds, stocks, and carry trade. They applied conditional copula models using the weekly data running from January 1994 to December 2014, which was then divided into three sub-periods: pre-crisis (from 1994 to 2006), the crisis (from 2007 to 2008), and post-crisis (from 2009 to 2014). The authors used interest rates and currencies of the G10 economies; the Deutsche Bank G10 Currency Future Harvest (DBCFH) Index as a proxy for a carry trade strategy; US 10-year treasury bonds; and the S&P 500 index. Wu et al. (Citation2021) found a significant increase in the dependence between carry trade and stock prices, while carry trade and bonds were negatively related. Meanwhile, the interdependence between carry trade and stock returns was more pronounced during the 2008 global financial crisis. The authors also performed the out-of-sample forecast of dependence between the selected assets and carry trade. The authors found that risk-averse investors benefited more by incorporating asymmetry and dynamics into dependencies’ timing, specifically during the 2008 financial crisis.
The studies by Tse and Zhao (Citation2012) and Fung et al. (Citation2013) focused mainly on the volatility spillovers between carry trade returns and stock markets. Although the study by Tse and Zhao (Citation2012) and Fung et al. (Citation2013) analysed the volatility spillovers between carry trade returns and stock market returns during different periods, which included the 2008 global financial crisis period, the studies did not analyse the relationship between the carry trade returns and stock markets using time-varying methods. Dynamic correlations could show how global and country-specific crises have impacted the relationship between carry trade and stock returns.
3. Methodology
This paper employs a multivariate VAR-DCC-GARCH and the SJC-copula model to investigate the dynamic conditional correlation and the dependence structure, respectively, between the BRICS equity returns and US dollar carry trade returns. Furthermore, the Nonlinear Granger Causality test based on the feed-forward neural networks (FFNN) model is employed to assess the predictive power of global volatility on the dynamic correlation between carry trade and equity returns.
In the VAR-DCC-GARCH model, the mean equations are obtained from a VAR model expressed as.
(1)
(1)
(2)
(2) where
and
represents the returns of US dollar carry trade and BRICS equities at time t respectively.
The error term at period t is represented by .
, and
are estimated parameters for the VAR model.
is the constant parameter used in the VAR model. The study applies the VAR model owing to its ability to account for interdependence between equity returns and carry trade returns for all the selected countries.
From the obtained residuals in Equations (1) and (2), a univariate GJR-GARCH (1,1) model is obtained such asFootnote1
(3)
(3) where
measures the asymmetric volatility.
is the conditional variables,
are the squared shocks.
From Equations (1)–(3), the DCC-GRCH model is obtained such as
(4)
(4) With
representing the square matrix of conditional variance,
represents the time-varying standard deviation matrix and can also be expressed as follows:
(5)
(5) where
represents the conditional covariance
which can be obtained from GJR-GARCH in Equation (3).
in Equation (4) represents the conditional correlation coefficient matrix of the standardised returns and can be expressed as follows:
(6)
(6) The
matrix
can also be decomposed as follows:
(7)
(7) where
is a positive definite matrix and denotes the time-varying conditional covariance matrix of standardised returns,
can be expressed as follows:
(8)
(8) Therefore, the Dynamic Conditional Correlation DCC (1,1) model can be expressed as follows.
(9)
(9) where
represents the unconditional variance matrix;
Furthermore, we can obtain the dynamic conditional correlation coefficient as follows:
(10)
(10)
The parameters of the DCC-GARCH model are obtained from the maximisation of the loglikelihood function given as:
(11)
(11) where
represent the parameters of the model.
It is worth noting that the paper uses a copula model to supplement the correlation analysis. The SJC copula is used due to its ability to model the data that appear to be asymmetrical on both the upper and lower tail of the distribution.
The SJC-copula model which is derived from the Joe-Clayton copula is expressed as:
(12)
(12) where
is lower and upper tail dependencies, respectively and
represent the variables. In this paper, these variables carry trade returns and BRICS stock market returns. The lower and upper tail are expressed as follows:
(13)
(13)
(14)
(14)
4. Data, Estimation and Discussion of Results
4.1. Data
The paper uses daily data from 03 January 2000 to 30 June 2021. The sample includes periods related to major economic crises, such as the 2008 global financial crisis, and the Covid-19 pandemic. Data are collected from DataStream and include the short-term interest rates for all BRICS and the US economies, BRICS economies’ exchange rates against the US dollar, and stock market prices. The BRICS currencies per US dollar are as follows: Brazilian real, Russian Ruble, Indian Rupee, Chinese Yuan, and South African Rand. The stock market indices for BRICS countries are as follows: iBovespa Index; RTS Index; Bombay Stock Exchange; Shanghai Stock Exchange All-Share Index; and Johannesburg Stock Exchange (JSE) All-Share Index. The VIX index is sourced from Bloomberg. The collected data is transformed to compute the carry trade and equity returns. The carry trade returns calculation follows the method suggested by Brunnermeier et al. (Citation2008) and is described as follows:
(12)
(12)
represents the carry trade returns,
is an exchange rate representing the price of US$1 in terms of the domestic currency at time t.
represents the returns in the exchange rate at time t. The situation whereby
suggests the ‘failure of uncovered interest rate parity’ (Fung et al., Citation2013).
represents interest differential between the domestic economy, BRICS in our case, and the foreign economy, the US in our case.
Table reports the descriptive statistics of the different variables. The average carry trade returns ranged between 0% for all BRICS economies except for Russia, with an average of 0.01%. The average stock price returns ranged from 0.030% for China to 0.039% for Russia. The skewness of the US dollar carry-trade returns is negative for Brazil and India and positive for all other BRICS economies. The stock returns for all the BRICS economies exhibit a negative skewness. This negative skewness indicates that the stock returns exhibit a fatter tail on the left side of the distribution for all the BRICS economies except for South Africa. Kurtosis for both carry trade and stock returns across all the BRICS economies is higher than the value of 3, which indicates that overall, returns are characterised by fat tails.
Table 1. Descriptive statistics.
4.2. Estimation Results
The VAR-DCC-GARCH model is estimated following the procedure described above. The results are reported in the appendix, showing the stability of the model. Moreover, Figures report the dynamic conditional correlations between US dollar carry trade returns and the BRICS economies’ stock returns. The dotted areas show significant global crises, such as the global financial crisis of 2008 and COVID-19.
Figure 1. Dynamic correlation between currency carry trade returns and Brazilian stock returns.
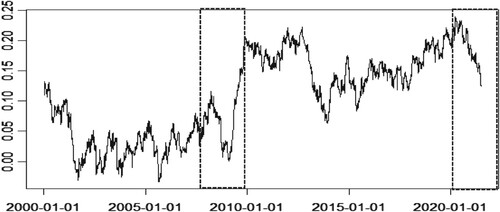
Figure 2. Dynamic Correlation between currency carry trade returns and Russian stock returns.
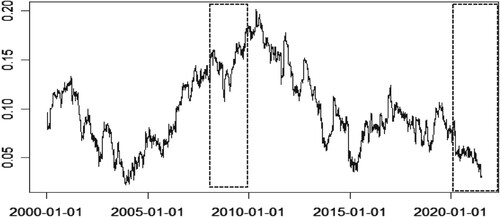
Figure 3. Dynamic Correlation between US dollar carry trade returns and Indian stock returns.
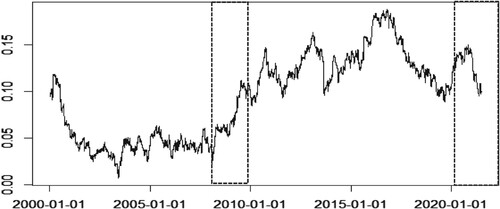
Figure 4. Dynamic Correlation between US dollar carry trade returns and Chinese stock returns.
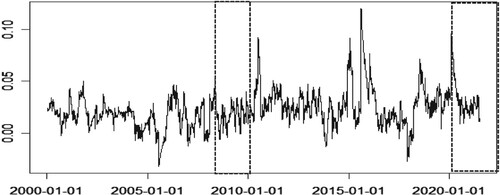
Figure 5. Dynamic Correlation between US dollar carry trade returns and South African stock returns.
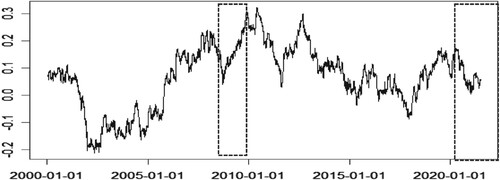
Figure shows that there is an overall positive conditional correlation between US dollar carry trade returns and Brazilian stock returns over the selected sample. However, the dynamic correlation series displayed in Figure shows a delayed increase in correlation during the global financial crisis and a delayed decrease during the COVID-19 crises. This outcome shows that the dynamic correlation between the carry trade and equity returns do not behave the same way during all the crises. The delayed positive trend of the dynamic correlation between the variables is due certainly to the negative carry trade returns during the pick of the 2008 global financial crisis coupled with the negative equity returns due to the global negative sentiment by global investors. In fact, as the 2008 financial crisis was triggered by the US, the ensued depreciation of the US dollar led to the negative returns of the US dollar carry trade at the time equity market was negative. Nonetheless, during the COVID-19, the US was mostly seen as a safe haven for many investors (see Cheema et al., Citation2022; Disli et al., Citation2021). The negative return of global equity market that ensued coincided with the appreciation of the US dollar that lead to the positive returns of the US carry trade and thus, the negative correlation between the carry trade and equity returns. This same pattern of the correlation trends is observed in all the BRICS countries as depicted in Figures , except in CHINA, where the pattern is not as pronounced as in other BRICS countries, especially during COVID-19. The outcome is expected given that COVID-19 crisis was triggered by CHINA. These results differ from those reported by Bonga-Bonga and Rangoanana (Citation2022), which established that the relationship between equity returns and carry trade returns could be positive or negative depending on the chosen quantiles. Our study shows how the relationship between the two asset returns varies over time but has remained mostly positive throughout the sample. Our results unlike those of Bonga-Bonga and Rangoanana (Citation2022) track the dependence structure over time not specific quantiles. Our results in in line with Bonga and Rangoanana (Citation2022) who a positive relationship in the upper quantiles of the equity market and a negative relationship at lower quantiles of the equity market returns.
The changing pattern of the correlation between the carry trade and equity markets shows that the correlation between the two markets do not behave the same way during all the crisis periods. Asset managers and investors need first to identify the nature and type of crisis before anticipating the trend of the correlation between the two markets, which correlation is information for asset allocation and portfolio optimisation. Some other studies have also documented the existence of a strong correlation between carry trade returns and equity returns (for example, Tse & Zhao, Citation2012). However, unlike our findings, which show a time-varying dependence structure, their results show that the correlation is constant throughout the sample period,
4.3. SJC-Copula Model Estimation Results
While the results of the dynamic correlation between carry trade and stock returns provide insight into how the two series correlate during specific periods, they are short of providing insight into how the two series fare when both are in the lower quantile or tails (during through or recession) and in upper quantile or tails (during boom periods). To this end, the study makes use of the SJC-copula methodology. The SJC-copula model's relevance is due to its ability to capture the asymmetric dependence of time series in the lower and upper tails. The results obtained from this copula method are shown in Table . Figures report the time-varying lower and upper tail dependence between the carry trade returns and stock returns of the BRICS economies.
Figure 6. Tail dependence between carry trade returns and stock returns for Brazil; Panel A: Lower tail dependence Panel B: Upper tail dependence.
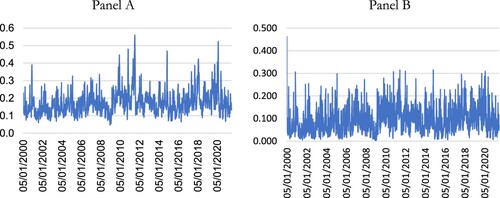
Figure 7. Tail dependence between carry trade returns and stock returns for Russia; Panel A: Lower tail dependence Panel B: Upper tail dependence.
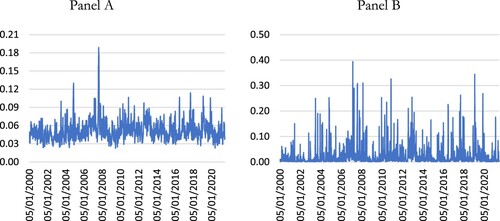
Figure 8. Tail dependence between carry trade returns and stock returns for India; Panel A: Lower tail dependence Panel B: Upper tail dependence.
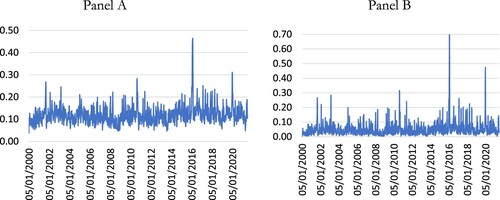
Figure 9. Tail dependence between carry trade returns and stock returns for China; Panel A: Lower tail dependence Panel B: Upper tail dependence.
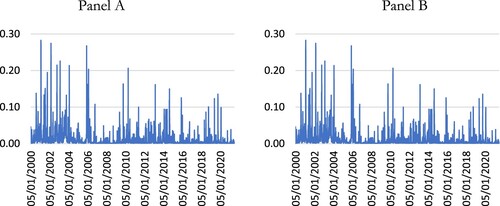
Figure 10. Tail dependence between carry trade returns and stock returns for South Africa.
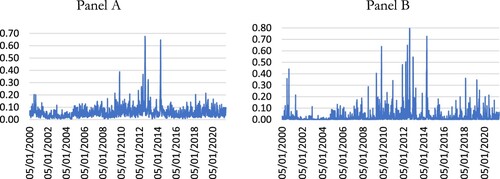
Table 2. The estimation of SJC Copula parameters.
Table reports the results from the SJC-copula model, which is also used to investigate the lower and upper tail dependence between the carry trade returns and stock returns of BRICS economies. As shown in Table , most parameters are statistically significant, which provides evidence that there is generally a tail dependence between the carry trade returns and stock returns of BRICS economies. The log-likelihood is higher for China, Russia, and South Africa, which means the upper and lower tail dependence between the carry trade returns and stock returns is highly significant for those economies compared to Brazil and India (Table ).
Table 3. Nonlinear Granger causality test.
Figures display the results of the asymmetric dependence between the carry trade and stock returns. Panel A on each figure reports the lower tail dependencies, while panel B reports the upper tail dependencies.
Figure shows that in Brazil, the correlations between carry trade returns and stock returns are generally higher in the lower tail than the upper tail. The lower tail dependence between the two series is higher during the various crises, showing that the high correlation observed during crisis periods with the DCC model is owing to negative returns for both carry trade and stock returns. The high dependence on lower tails during crisis periods is evident for most of the BRICS countries, as shown in most figures below.
However, it is essential to note that the upper tail dependence between carry trade and equity market returns shows high spikes, reflecting the boom periods characterised by positive dependence between the two returns. The excellent performance of equity and carry trade returns, primarily after the global financial crisis, was the prime driver of this positive dependence. Other studies such as Wu et al. (Citation2021) have also documented a dependence structure between carry trade and and equity returns using copulas. However, our results are different in that, Wu et al. (Citation2021) use an elliptical copula which focuses on the entire distribution, while we use an Archimedean copula and specifically focus on the relationship in the tails of the distribution.
4.4. Causality Between Global Volatility and the Dynamic Correlation Between Carry Trade and Stock Returns
While studies show that global volatility, as measured by the VIX index, can significantly impact carry trade returns (Bonga-Bonga & Rangoanana, Citation2022; Chen & Qi, Citation2018), no literature ever assessed how global volatility could predict or affect the dynamic correlation between carry trade and equity returns. Such insight is vital for investors and asset managers who rely on the correlation between assets to optimise portfolios successfully.
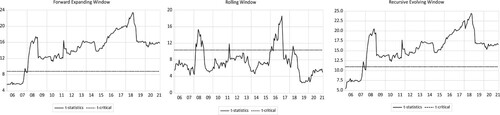
Considering the nonlinear trend in the dynamic correlation between the carry trade and equity returns, as illustrated in Figures , it may not be appropriate to rely on a linear causality method to evaluate the predictive capacity of VIX regarding this dynamic correlation. Therefore, we turn to the time-varying Granger causality method introduced by Shi et al. (Citation2018) and Shi et al. (Citation2020) within this context. These authors extended the methodology originally proposed by Phillips et al. (Citation2015) for testing and time-stamping price bubbles, resulting in a nonlinear Granger causality test. To accommodate changes in Granger causal orderings over time and to precisely time-stamp these alterations, the authors put forward recursive estimation methods employing three algorithms to produce a sequence of test statistics. These algorithms include the forward expanding window, the rolling window, and the recursive evolving window. For a comprehensive understanding of this methodology, please refer to Shi et al. (Citation2018) and Shi et al. (Citation2020).
The results of the nonlinear Granger causality analysis, as discussed below, will specifically emphasise the three algorithms mentioned earlier. Within each figure, we provide time series data for the Wald test statistics (t-statistics) generated by each algorithm, along with the corresponding 95% critical value (t-critical). It is important to highlight that the null hypothesis, which posits the absence of Granger causality, is rejected if the dynamics of the t-statistics is higher than the t-critical.
Given that the series used are not stationary, Shi et al. (Citation2020) suggest the use of the lag-augmented vector autoregressive (LA-VAR) method for the nonlinear Granger causality test. It is worth noting that we use different order for the VAR model of each country selected according to the Akaike Information Criteria (AIC).
In the results of the nonlinear Granger causality test, we observe three key patterns. Firstly, the VIX does ‘Granger’ cause the dynamic correlation between equity and carry trade returns across all sample observations. This is consistently true for China and, to a certain degree, for India. As shown in Figure , for China, there is no causality from VIX to the dynamic correlation between equity and carry trade returns across all three algorithms used. This observation can be attributed to the stationarity of the dynamic correlation between equity and carry trade returns in China, as demonstrated in Figure . Considering the mean-reverting nature of this correlation, it becomes clear that fluctuations in VIX do not affect the mean-reverting behaviour of this dynamic.
The second pattern observed is that the null hypothesis of no Granger causality between equity and carry trade returns is more frequently rejected during calm periods as opposed to turbulent ones, particularly following the 2008 global financial crisis. This trend is evident in Brazil and Russia, as illustrated in Figures and . Essentially, this suggests that only unexpected fluctuations in the VIX (those occurring during calm periods) significantly impact the dynamics of equity and carry trade returns (Figure ). It's crucial to recognise that during crisis periods, changes in the VIX are generally anticipated. In the realm of rational expectations, investors form their expectations based on all available information, meaning that anticipated changes in any shock are already factored into these expectations. Conversely, unanticipated shocks disrupt these expectations, leading to potential adjustments, as discussed by Bampi and Colombo (Citation2021).
Figure 11. Time-varying Granger causality of VIX to the dynamic correlation: Brazil.
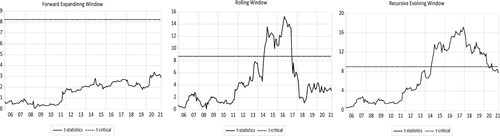
Figure 12. Time-Varying Granger causality of VIX to the dynamic correlation: China.
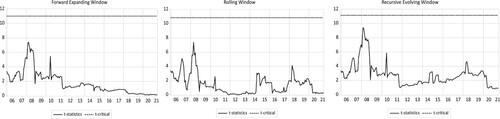
Figure 13. Time-varying Granger causality of VIX to the dynamic correlation: India.
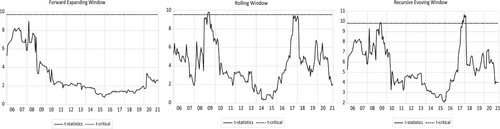
Figure 14. Time-varying Granger causality of VIX to the dynamic correlation: Russia.
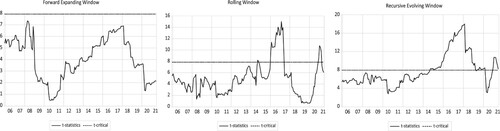
Figure 15. Time-varying Granger causality of VIX to the dynamic correlation: South Africa.
Comparing Figures and , we observe that the periods during which the VIX Granger causes the dynamic correlation between equity and carry trade returns correspond to the periods when this correlation dynamics increases. This phenomenon can be explained by the fact that both carry trade and equity returns tend to react simultaneously to global risks. This synchronicity indicates a shared sensitivity to overarching market conditions, particularly during periods of unexpected volatility as indicated by changes in the VIX.
The final observed trend pertains specifically to South Africa, where global risk is found to Granger cause the dynamics of equity and carry trade returns for most of the sample periods. This tendency is likely attributable to the volatile nature of both the currency and equity markets in South Africa, which are highly susceptible to global risks. As documented by Gnagne and Bonga-Bonga (Citation2020), these markets in South Africa demonstrate a pronounced sensitivity to international risk factors, suggesting that global risk indicators, such as the VIX, are significant predictors of market behaviour within the country. This pronounced impact underscores the interconnectedness of South African markets with global economic conditions, reflecting a broader vulnerability to external shocks and fluctuations in the global risk landscape.
Identifying when the VIX influences the dynamic correlation between equity and carry trade returns is crucial for investors and asset managers in making informed decisions regarding portfolio diversification, risk management, asset allocation, and hedging.
In terms of portfolio diversification and asset allocation, understanding the specific timing of how the correlation between carry trade and equity returns responds to global volatility shocks can greatly assist portfolio managers and investors. This knowledge enables them to strategically add or reduce carry trade investments in an equity portfolio at opportune times. Doing so can effectively lower the overall portfolio risk and enhance risk-adjusted returns, forming a key component of their risk management strategies.
Furthermore, asset managers and investors can leverage insights into the time-varying response of the correlation between carry trade and equity returns to global volatility shocks for hedging purposes. With this information, they can make more informed decisions on when to hedge their equity exposure using the currency market. This approach serves as a safeguard against potential losses, particularly in times of heightened global volatility.
Overall, the nuanced understanding of the relationship between global volatility indicators like the VIX and market dynamics offers a valuable tool for optimising investment strategies, enhancing portfolio resilience, and achieving better financial outcomes in an ever-changing economic landscape.
5. Conclusions and Recommendations
This paper investigated the dynamic correlation and dependence structure between the US dollar-funded carry trade and stock markets of the BRICS economies from January 2000 to June 2021 by using the VAR-DCC GARCH and SJC copula models, respectively. Furthermore, the paper assessed how global volatility could predict the correlations between the two markets.
The results of the dynamic correlation model show that the dynamic correlation between stock returns and US dollar carry trade returns for all BRICS is different during selected crisis periods, and it often displays a delay shift during these periods. Meanwhile, these dynamic correlations appeared more pronounced during most global crisis periods, such as the global financial crisis in 2008 and the COVID-19 crisis. Moreover, the results of the SJC model showed that the lower tail dependence between the two series is higher during the various crises, showing that the high correlation observed during crisis periods with the DCC model is owing to negative returns for both carry trade and stock returns.
The study utilises a time-varying Granger causality method, as proposed by Shi et al. (Citation2018, Citation2020), to examine if global volatility forecasts carry trade and equity returns. The results indicate that the influence of VIX in Granger causing the dynamic conditional correlation between equity and carry trade returns is inconsistent, manifesting in three distinct patterns. First, for countries like China, and to some extent India, VIX does not Granger cause the dynamic correlation between equity and carry trade returns. Second, in nations like Brazil and Russia, the null hypothesis of non-Granger causality between these returns is predominantly rejected during calm periods rather than in turbulent times post the 2008 financial crisis. This pattern is attributed to the differential impacts of anticipated and unanticipated VIX changes on the dynamics of equity and carry trade returns. Finally, the study notes a consistent influence of global risk in Granger causing the dynamics between equity and carry trade returns throughout most of the sample period in South Africa. These findings are crucial for asset managers and investors regarding portfolio diversification, risk management, asset allocation, and hedging strategies. Understanding the correlation between these variables is key to portfolio selection and diversification. Moreover, the study offers valuable insights into the specific periods when global volatility might affect these correlations, aiding in more informed investment and portfolio allocation decisions.
Disclosure statement
No potential conflict of interest was reported by the author(s).
Data Availability Statement
The data that support the findings of this study are available from the corresponding author, MM, upon reasonable request.
Additional information
Notes on contributors
Kabelo Collen Makhanya
Kabelo Collen Makhanya is a recent Master's graduate of the University of Johannesburg and currently works as a senior economist at the National Treasury in South Africa.
Lumengo Bonga-Bonga
Professor Lumengo Bonga-Bonga is the head of research at the School of Economics, University of Johannesburg. Prof. Bonga Bonga is an experienced and highly rated researcher who specialises in International Finance and Financial Economics. Prof. Bonga Bonga has published in many highly ranked international journals and a lot of citations from his work.
Mathias Mandla Manguzvane
Dr. Mathias Mandla Manguzvane is a lecturer in the School of Economics at the University of Johannesburg. His research expertise is in the field of financial Economics. He has published in several internationally recognised journals.
Notes
1 The choice and the order of the model is determined from Akaike Information Criteria.
References
- Bampi, R. E., & Colombo, J. A. (2021). Heterogeneous effects of foreign exchange appreciation on industrial output: Evidence from disaggregated manufacturing data. The Quarterly Review of Economics and Finance, 80, 431–451.
- Berg, K. A., & Mark, N. C. (2018). Measures of global uncertainty and carry-trade excess returns. Journal of International Money and Finance, 88, 212–227. https://doi.org/10.1016/j.jimonfin.2017.07.010
- Bonga-Bonga, L., & Maake, T. (2021). The relationship between carry trade and asset markets in South Africa. Journal of Risk and Financial Management, 14(7), 300. https://doi.org/10.3390/jrfm14070300
- Bonga-Bonga, L., & Rangoanana, S. M. (2022). Carry trade and capital market returns in South Africa. Journal of Risk and Financial Management, 15(11), 498. https://doi.org/10.3390/jrfm15110498
- Brunnermeier, M. K., Nagel, S., & Pedersen, L. H. (2008). Carry trades and currency crashes. NBER Macroeconomics Annual, 23(1), 313–348. https://doi.org/10.1086/593088
- Burnside, C., Eichenbaum, M., Kleshchelski, I., & Rebelo, S. (2011). Do peso problems explain the returns to the carry trade? Review of Financial Studies, 24(3), 853–891. https://doi.org/10.1093/rfs/hhq138
- Burnside, C., Eichenbaum, M., & Rebelo, S. (2008). Carry trade: The gains of diversification. Journal of the European Economic Association, 6(2-3), 581–588. https://doi.org/10.1162/JEEA.2008.6.2-3.581
- Cheema, M. A., Faff, R., & Szulczyk, K. R. (2022). The 2008 global financial crisis and COVID-19 pandemic: How safe are the safe haven assets? International Review of Financial Analysis, 83, 102316. https://doi.org/10.1016/j.irfa.2022.102316
- Chen, Q., & Qi, Y. (2018). Global volatility and Forex returns in East Asian countries. Journal of International Financial Markets, Institutions and Money, 56, 28–41.
- Cheung, Y. L., Cheung, Y. W., & He, A. W. (2012). Yen carry trades and stock returns in target currency countries. Japan and the World Economy, 24(3), 174–183. https://doi.org/10.1016/j.japwor.2012.01.010
- Christiansen, C., Ranaldo, A., & Söderlind, P. (2011). The time-varying systematic risk of carry trade strategies. Journal of Financial and Quantitative Analysis, 46(4), 1107–1125. https://doi.org/10.1017/S0022109011000263
- Disli, M., Nagayev, R., Salim, K., Rizkiah, S. K., & Aysan, A. F. (2021). In search of safe haven assets during COVID-19 pandemic: An empirical analysis of different investor types. Research in International Business and Finance, 58, 101461. https://doi.org/10.1016/j.ribaf.2021.101461
- Fong, W. M. (2010). A stochastic dominance analysis of yen carry trades. Journal of Banking & Finance, 34(6), 1237–1246. https://doi.org/10.1016/j.jbankfin.2009.11.017
- Fung, H. G., Tse, Y., & Zhao, L. (2013). Are stock markets in Asia related to carry trade? Pacific-Basin Finance Journal, 25, 200–216. https://doi.org/10.1016/j.pacfin.2013.08.010
- Galati, G., & Heath, A. (2007, December). What drives the growth in FX activity? Interpreting the 2007 triennial survey. BIS Quarterly Review.
- Gnagne, P. X., & Bonga-Bonga, L. (2020). The impact of exchange rate volatility on the security markets in Brics economies. International Economics/Economia Internazionale, 73(1), 21–50.
- Lee, H. C., & Chang, S. L. (2013). Spillovers of currency carry trade returns, market risk sentiment, and U.S. market returns. The North American Journal of Economics and Finance, 26, 197–216. https://doi.org/10.1016/j.najef.2013.10.001
- Lettau, M., Maggiori, M., & Weber, M. (2014). Conditional risk premia in currency markets and other asset classes. Journal of Financial Economics, 114(2), 197–225. https://doi.org/10.1016/j.jfineco.2014.07.001
- Phillips, P. C., Shi, S., & Yu, J. (2015). Testing for multiple bubbles: Historical episodes of exuberance and collapse in the S&P 500. International Economic Review, 56(4), 1043–1078.
- Shi, S., Hurn, S., & Phillips, P. C. (2020). Causal change detection in possibly integrated systems: Revisiting the money–income relationship. Journal of Financial Econometrics, 18(1), 158–180.
- Shi, S., Phillips, P. C., & Hurn, S. (2018). Change detection and the causal impact of the yield curve. Journal of Time Series Analysis, 39(6), 966–987.
- Tse, Y., & Zhao, L. (2012). The relationship between currency carry trades and U.S. stocks. Journal of Futures Markets, 32(3), 252–271. https://doi.org/10.1002/fut.20516
- Wu, C. C., Huang, M., & Wu, C. C. (2021). The role of asymmetry and dynamics in carry trade and general financial markets. Financial Review, 56(2), 331–353. doi:10.1111/fire.12250
Appendix
Table A1. VAR-DCC-GARCH estimation results.