
 ?Mathematical formulae have been encoded as MathML and are displayed in this HTML version using MathJax in order to improve their display. Uncheck the box to turn MathJax off. This feature requires Javascript. Click on a formula to zoom.
ABSTRACT
In recent times, landslides have become a major concern in the southeast part of Bangladesh. This study aims to develop comprehensive landslide risk mapping by applying the analytical hierarchy process (AHP) and geospatial techniques in Ukhiya and Teknaf Upazilas, a highly populated Rohingya Refugee Settlement area. To assess the landslide risk, we selected 12 influencing criteria of hazard, vulnerability and exposure under the relevant components of risk, such as precipitation intensity, landslide inventory, distance to fault line, stream density, distance to stream network, elevation, aspect, slope, geology, normalized difference vegetation index (NDVI), land use and land cover (LULC), and population density. These spatial criteria were weighted using the AHP model. The weighted overlay techniques were then used to produce the landslide risk map. The findings demonstrate that 2.19% of the total area is classified as a very high risk zone, and 12.74% is categorized as a high risk zone. Moderate risk areas cover 23.08% of the total area. The risk map is validated by the landslides inventory. The outcomes can be used by the concerned authorities to take the necessary steps to reduce the impact of landslides.
Introduction
Landslide is a motion of landmass (earth or debris) or downward movement of rocks on a slope. This movement can be triggered by various external factors such as rainfall, earthquakes, variations in water level, storm waves, or rapid erosion of streams that can cause shear stress to either increase or decrease quickly in slope-forming materials (Cruden Citation1991). In hilly terrain areas around the world, landslides have resulted in numerous deaths and significant economic losses. It killed over 18,000 people and affected about 4.8 million people worldwide from 1998 to 2017 (UNISDR Citation2018). In comparison to other continents, Asia is one of the most prone and vulnerable areas to landslides, with the largest number of adverse accidents and deaths. In Asia, 3,456 disasters were recorded between 1970 and 2019, resulting in the deaths of 975,778 people and economic losses of US$ 1,204 billion (WMO Citation2020). India, Nepal, China, and Japan are considered the most vulnerable regions to landslide disasters in this continent (Kirschbaum et al. Citation2010; Petley, Dunning, and Rosser Citation2005; Wu Citation2017), and Bangladesh is the most recent addition to this list (CDMP-II Citation2012). Bangladesh is extremely vulnerable to natural disasters like cyclones, floods and storm surges due to its geographic position, terrain features, abundance of rivers, coastline morphology, and monsoon climate (Moniruzzaman Citation2012).
Landslide disasters have been common in the past in the heavily settled area of Bangladesh. However, in recent times, many landslides have resulted from intensified human activities, including hill cutting for slums and suburban housing construction (Ahmed Citation2017). In the southeast part of Bangladesh, landslides have become a significant concern since 2000 (Alam Citation2020). For example, a series of devastating landslide incidents resulted in over 725 deaths in the Chittagong Hill Districts from 2000 to 2018 (Sultana Citation2020). The impacts of the intense weather incidents (Khan et al. Citation2020), demographic influence in flatlands, acceleration in urban growth, changes in hill slopes, deforestation, and a lack of cultural awareness have been classified as emerging challenges to mitigate the loss due to landslides at the national level (Alam Citation2020).
Recently, Cox’s Bazar District has been categorized as a highly susceptible area to landslides. More specifically, Ukhiya and Teknaf UpazilasFootnote1 are highly susceptible due to the changes in hill slopes for the development activities to accommodate a large number of Rohingya refugees. Since 25 August 2017, 655,000 Rohingya refugees had arrived in Cox’s Bazar District, and the number reached nearly 860,000 at the end of the year (Imtiaz Citation2018). According to the Inter Sector Coordination Group (Citation2019) weekly report, 12 different landslides and erosions affected 98 refugees from 14 to 20 June, and four different landslides and erosions affected 40 refugees from 20 to 27 June 2019. A continuous 14 in. of rainfall for 72 h in July 2019 resulted in 26 landslides with one causality and 4,500 homeless in the refugee camps of Cox’s Bazar, Bangladesh. Moreover, in September 2019, 16 separate floods affected nearly 20,000 refugees, including 2,000 refugees who had been displaced by new landslides (Jonathan Citation2019).
It is necessary to identify the landslide risk zones to mitigate the probable loss in the area that contains a large number of local inhabitants as well as Rohingya refugees. As a result, landslide risk mapping can be a solution to reduce the damages (Regmi et al. Citation2014). The interaction of certain dangers that make humans, entities, and ecosystems vulnerable and exposed are described as risks (Hoque et al. Citation2019). The risk of a damaging landslide in a spatial (“where”) and temporal (“when”) sense, as well as magnitude (“how large”) of the occurrence, can be described as a landslide hazard (Bui et al. Citation2011). Vulnerability, on the other hand, refers to the degree of damage that can be incurred by hazards to people's possessions, livelihoods, and the environment (Hoque et al. Citation2017). In this study, the produced risk map provides crucial resources to help in sustainable construction and land use planning decisions. Furthermore, the successful use of these maps will significantly minimize landslide damage risk and other cost effects.
Qualitative maps are generated by adding weights to all variable landslide maps that rely on the expertise of the researcher, while quantitative methods include strategies to examine the relation between landslide criteria based on various models (Park et al. Citation2013). Based on factors connected to the consequences of landslides and locations where historical landslides have occurred, both qualitative and quantitative approaches are tested (Ahmed Citation2015; Park et al. Citation2013). In landslide risk mapping, different methods are used with the key goal of designing landslide hazard zoning maps (Bathrellos et al. Citation2012; Highland and Bobrowsky Citation2008). Geographic Information System (GIS) and Remote Sensing (RS) techniques have recently gained popularity in landslide mapping, and are widely used for landslide susceptibility (Ahmed Citation2015; El Jazouli, Barakat, and Khellouk Citation2019; Tehrani and Husken Citation2019), hazard evaluation (Bachri and Shresta Citation2010), risk analysis (Pathak Citation2016), as well as landslide management (Kavzoglu, Sahin, and Colkesen Citation2014; Talaei Citation2014). The Analytical Hierarchy Process (AHP) developed by Thomas L. Saaty in 1970 has been used by many researchers to assess landslide risk worldwide (Bachri and Shresta Citation2010; Boroumandi, Khamehchiyan, and Nikudel Citation2015; El Jazouli, Barakat, and Khellouk Citation2019). It incorporates multiple criteria for the risk components to develop a detailed spatial risk map by adding the weight and ranking those criteria on a hierarchical structure (Roy and Blaschke Citation2015).
Landslide-related studies in the southeast part of Bangladesh are mainly concentrated on the areas of Bandarban and Rangamati. Because of their high elevated hilly areas and frequent landslides during the monsoon, researchers most of the time concentrate on those areas while studying landslides. However, they do not take Ukhiya and Teknaf Upazilas into account for an extensive landslide risk assessment. Most of the studies that have been done in Ukhiya and Teknaf Upazilas are focused on the camps of Rohingya refugees (Ahmed et al. Citation2020a; Ahmed, Firoze, and Rahman Citation2020b; Tehrani and Husken Citation2019). One more study was also conducted in Cox’s Bazar Municipality area, following the AHP method (Ahmed Citation2015). The study aims to develop a risk scenario for the Cox’s Bazar Municipality, integrating landslide hazard, vulnerability and exposure.
A massive influx of Rohingya refugees occurred in the south-eastern region, mostly in Ukhiya and Teknaf Upazilas in 2017. As a result, a large number of forests have been degraded, which accelerated many landslide conditioning factors. Because of that, there might be a devastating landslide which can result in loss of life and property on a larger scale. In this study, a variety of criteria have been used to produce the landslide risk map more accurately. No other previous studies concentrated both on the host communities and refugees at the same time. Whereas most of them focused only on the refugee camps (Kamal, Ahmed et al. Citation2022a; Kamal, Hossain et al. Citation2022b), this study assessed far beyond that. This paper is focused on developing a comprehensive landslide risk map emphasizing both the highly populated Rohingya refugee camps and the local communities. In addition to a wide variety of factors to get a more accurate output, we have considered a historical landslide inventory dataset, which will make the research more scientific. It can be helpful for the researchers who will conduct future research in this area to identify and validate the risk zones in the host communities and the refugee camps. This study will give a clear view to the concerned authorities to take the necessary steps to mitigate the loss due to landslides.
Materials and methods
In this study, geospatial techniques, a combination of RS and GIS, and multi-criteria weighting technique AHP were used to assess the landslide risk in Ukhiya and Teknaf Upazilas, focusing on the refugee camp area. To assess the landslide risk, 12 conditioning factors have been considered (), such as precipitation intensity, landslide inventory, distance to fault line, stream density, distance to stream network, elevation, aspect, slope, geology, NDVI, LULC, and population density. All data layers were projected to the Universal Transverse Mercator (UTM) zone 46 North system, using the Datum of World Geodetic System (WGS)-1984.
Figure 1. Flowchart of landslide risk assessment method used in this research.
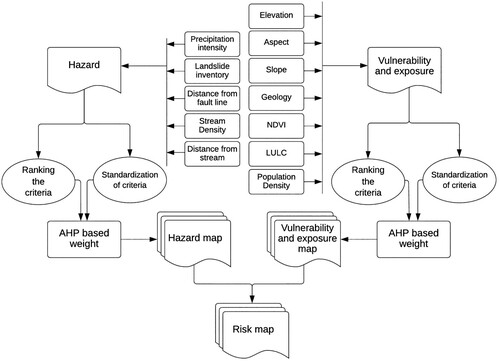
Risk is typically a combination of hazard, exposure, and vulnerability. Therefore, risk assessment studies must consider how risk elements such as hazard, exposure, and vulnerability interrelate with each other (Hoque et al. Citation2019). In this study, the following equation (Eq. 1) was used for risk assessment in the study area.
(1)
(1)
Study area
This study focuses on the landslide risk assessment in the highly populated Rohingya refugee settlement area of Ukhiya and Teknaf Upazilas (excluding Saint-Martin Island), which is in the southeast part of Cox’s Bazar District, Bangladesh. Ukhiya and Teknaf Upazilas cover an area of 261.80 and 388.66 km2, respectively, and their population are 207,379 and 264,389, respectively (BBS Citation2011). The settlement area is located between 20.867°N to 21.283°N latitude and 92.30°E to 92.10°E longitude, bounded by the Naf River and the Arakan State of Myanmar on the east, the Bay of Bengal on the southwest, and Ramu Upazila of Bangladesh on the north ().
Figure 2. Study area, showing the administrative boundary of Ukhiya and Teknaf Upazilas and the Rohingya refugee camps located in the area.
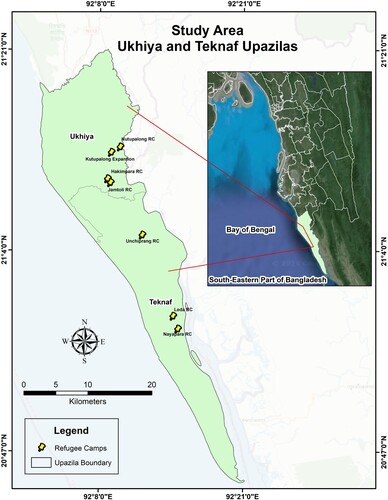
This study is conducted in five Unions (local administrative area) of Ukhiya Upazila named Haldiapalong, Jaliapalong, Palongkhali, Rajapalong, and Ratnapalong and five Unions of Teknaf Upazila named Baharchhara, Nhilla, Sabrang, Teknaf, and Whykong. Both Upazilas are bordered by tropical evergreen and semi-evergreen forests and other vegetation (Rahman, Islam, and Chowdhury Citation2019). This area is considered a highly landslide risk-prone area for several reasons, including its high-slope mountains, geological and geomorphological formation, and the presence of the Indian tectonic plate underneath the Burmese plate. Slope is a key contributing factor that can destabilize the land, and the average slope of the area is about 15 degrees to more than 20 degrees, which is higher than the anticlinal area (Hossain et al. Citation2023). Forest cover in the mountainous regions acts as a natural barrier against the landslide, and our study area is primarily characterized by its dense forests, with more than 25 percent of that region consisting of protected forest areas, natural reserves, and national parks (Hassan et al. Citation2018; Hossen, Hossain, and Uddin Citation2019). However, the major concern arose after the influx of refugees when almost 1284.84 hectares of vegetation cover were cleared in the Teknaf Upazila and 102.87 hectares were cleared in the Teknaf Wildlife Sanctuary alone (Imtiaz Citation2018). The existence of these natural features and anthropogenic changes after 2017 made this area a hotspot for landslide risk assessment to mitigate future loss.
Data set and sources
In this study, 12 different types of landslide conditioning factors were considered under hazard, vulnerability, and exposure to assess landslide risk. Data from a wide range of national and international organizations and multiple field investigations were used to map all the chosen criteria ().
Table 1. Data types and sources used to assess landslide risk.
Production of thematic data layers
A number of thematic data layers for precipitation intensity (Boroumandi, Khamehchiyan, and Nikudel Citation2015; Jaedicke et al. Citation2014; Torkashvand, Irani, and Sorur Citation2014), landslide inventory (El Jazouli, Barakat, and Khellouk Citation2019; Jaedicke et al. Citation2014), distance to fault line (Boroumandi, Khamehchiyan, and Nikudel Citation2015; El Jazouli, Barakat, and Khellouk Citation2019; Pourghasemi, Pradhan, and Gokceoglu Citation2012; Torkashvand, Irani, and Sorur Citation2014), stream density (Boroumandi, Khamehchiyan, and Nikudel Citation2015), distance to stream network (Pourghasemi, Pradhan, and Gokceoglu Citation2012), elevation (El Jazouli, Barakat, and Khellouk Citation2019; Pourghasemi, Pradhan, and Gokceoglu Citation2012; Torkashvand, Irani, and Sorur Citation2014), aspect (Boroumandi, Khamehchiyan, and Nikudel Citation2015; El Jazouli, Barakat, and Khellouk Citation2019; Pourghasemi, Pradhan, and Gokceoglu Citation2012), slope (Boroumandi, Khamehchiyan, and Nikudel Citation2015; El Jazouli, Barakat, and Khellouk Citation2019; Pourghasemi, Pradhan, and Gokceoglu Citation2012; Torkashvand, Irani, and Sorur Citation2014), geology (Jaedicke et al. Citation2014), NDVI (Ahmed Citation2015; Tehrani and Husken Citation2019), LULC (Boroumandi, Khamehchiyan, and Nikudel Citation2015; El Jazouli, Barakat, and Khellouk Citation2019; Jaedicke et al. Citation2014; Pourghasemi, Pradhan, and Gokceoglu Citation2012), and population density (Jaedicke et al. Citation2014) were produced. All these factors are responsible for the occurrence of landslides in the area. In recent times, many anthropogenic activities have also made the area susceptible to landslides. These criteria were selected for the risk assessment upon analyzing all the historical data on landslides in the area.
Precipitation intensity
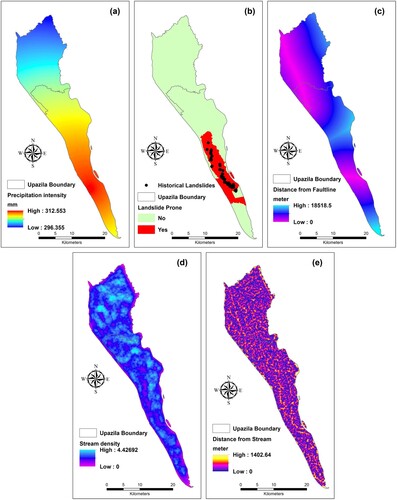
Depending on the ground condition, including terrain, soil type, and land cover characteristics, precipitation can work as a triggering factor for the landslide (Naranjo Citation2007). Analyzing previous rainfall data, it is evident that Cox’s Bazar District experienced the highest amount of rainfall in the southern part of Bangladesh. In this study, a precipitation intensity map is produced from the historical averaged monthly rainfall dataset for the station of Cox’s Bazar and Teknaf in the year 2018–2020, which is collected from the Bangladesh Meteorological Department (BMD) (a). The created raster layer demonstrates the area receiving low to high rainfall during this period. A high rate of precipitation in an area can destabilize the slope which can result in the landslide hazard.
Figure 3. Hazard mapping criteria layers (a) precipitation intensity, (b) landslide inventory, (c) distance from fault line, (d) stream density, and (e) distance from stream
Landslide inventory
Landslide inventory plays an important role in providing the basic details for any landslide zoning, which includes vulnerability, risk, and hazard zoning (Fell et al. Citation2008). Usually, a landslide inventory database comprises detailed information about the landslide and is collected through extensive field work and other sources (Gopinath et al. Citation2023). A total number of 58 landslide points were collected from historical landslide data sourced from newspapers, articles, and various organizations and later verified through extensive field surveys that were conducted between 2019 and 2020. Landslides at these 58 points were mainly caused by rainfall and hill cutting. Casualties had also been recorded for different landslides. The landslide inventory map shows the historical landslide points of the area (b).
Distance from fault line
Landslides are common in geological fault areas because tectonic breaks deteriorate the resilience of the surrounding rock (Chen, Panahi, and Pourghasemi Citation2017). Fault lines that exist in the study area are mainly east-dipping thrust faults on the western limb, while some of them also have west-dipping thrust faults on the eastern limb. Fault line data were collected from the Geological Survey of Bangladesh. Euclidean distance method is applied by using the ArcMap software to measure the distance from the fault line (c). The generated map shows the distance of the areas from the fault line. Areas located near the tectonic structures are more susceptible to landslides. These phenomena are aided by selective degradation and water flow along fault planes (Pourghasemi, Pradhan, and Gokceoglu Citation2012).
Stream density
Slope stability largely depends on a slope’s closeness to the drainage structures where streams may significantly make an impact on the stability by the erosion of the slopes or the saturation of the bottom part of the material, resulting in a rise in water levels (Gökceoglu and Aksoy Citation1996; Saha, Gupta, and Arora Citation2002). A drainage density map was produced using digital elevation model (DEM) data (d). To create a stream density map, we extracted all the streams from the DEM using ArcMap software. First of all, the flow direction function from ArcGIS’s hydrology tool was used to ascertain the direction of water based on the slope derived from the DEM. Then, a flow accumulation operation was performed to determine the potential accumulation of water at each point to get the stream layer. After extracting all the streams, stream density was calculated by using the kernel density tool.
Distance from stream
The saturation degree of the materials on the slope is a vital variable that determines the slope’s stability (Yalcin and Bulut Citation2007). In this study, the steam network was developed from the DEM, and the Euclidean distance method was applied to measure the distance of places from the streams (e). Areas with a lower distance from the stream tend to contribute more to the landslide events.
Elevation
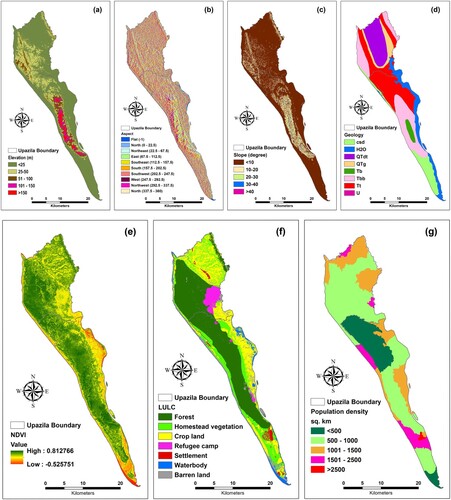
The impact of elevation on landslides is largely determined by its effect on various biophysical factors and human activities (Adnan et al. Citation2020). Because of the topographic nature of the research region, which consists of various highly elevated areas that influence the likelihood of landslides, elevation was chosen as a significant determinant. Such topography plays an important role in landslide activity, where higher elevated areas are considered the most vulnerable zone than the lower elevated areas because of hill cutting and clearing of the forest (Ahmed Citation2021; Mind’je et al. Citation2020). In this research, an elevation map was produced from a 30 m × 30 m DEM (a). The maximum elevation is found in the Teknaf peninsula with a height of more than 150 m above sea level.
Figure 4. Vulnerability and exposure mapping criteria layers: (a) elevation, (b) aspect, (c) slope, (d) geology, (e) NDVI, (f) LULC, and (g) population density.
Aspect
Aspect is known as a primary landslide-influencing component that is considered in many research related to landslides (Fernández et al. Citation1999; Saha et al. Citation2005). It plays a crucial role in determining how meteorological events, such as the intensity of rain and the amount of daylight, impact the susceptibility of landslides by influencing the morphological structure of the region. For example, slopes with certain aspects may receive more intense rainfall or sunlight, leading to faster saturation and increased landslide risk. Additionally, the slope’s filtering capability, which is influenced by various variables, also contributes to this susceptibility (Pourghasemi, Pradhan, and Gokceoglu Citation2012). In this research, using the aspect toolbox from ArcMap on the DEM, aspects are categorized into nine classes, i.e. flat (−1), north (0–22.5, 337.5–360), northeast (22.5–67.5), east (67.5–112.5), southeast (112.5–157.5), south (157.5–202.5), southwest (202.5–247.5), west (247.5–292.5), and northwest (292.5–337.5), to present the relationship between aspect and landslides (b).
Slope
Slope degree is the key parameter for analyzing its stability (Lee and Min Citation2001). As there is a direct relation between slope degree and landslide, it is often used to prepare landslide susceptibility maps (Clerici et al. Citation2002; Lee Citation2005). Because of the development of settlements and the cutting of the hills, a lot of steepness is created in the area, which makes it highly vulnerable to landslide risk. As a result, a slope map is prepared from the DEM by using ArcGIS 10.5 software’s slope tool. Based on the slope map, the study area is divided into five categories to demonstrate how steep the places are in the study area (c).
Geology
Since rock permeability varies based on the rock type, geology is a significant landslide conditioning element (Vojteková and Vojtek Citation2020). In this study, the geological data type of the study area was collected from the Geological Survey of Bangladesh. The surface geology map of the study area includes a total of eight classes, where csd, H2O, QTdt, QTg, Tb, Tbb, Tt represent beach and dune sand, water body, Dupi Tila Formation, Girujan Clay, Bhuban Formation, Boka Bil Formation, and Tipam Sandstone, respectively (d). The predominant geological composition of the study region consists of Tipam sandstone (Tt), Girujan clay (QTg), and Dupi Tila (QTdt) formations, which are predominantly composed of fluvial sandstone, clay, and beach soil. The data revealed that the majority of slope collapses took place in the residual soil and weathered silty sandstone layers (Kamal et al. Citation2022a; Kamal et al. Citation2022b). These geological layers have been rasterized and reclassified into classes based on their contributions to the slope instability.
Normalized difference vegetation index (NDVI)
Vegetation cover is one of the major factors for assessing the landslide risk. If the amount of vegetation cover decreases in the hilly area, then the area becomes more susceptible to landslides. To assess the amount of vegetation cover in the study area, we performed NDVI analysis by using 10 m × 10 m sentinel-2 satellite imagery (e). This method helps to assess the amount of vegetation from multispectral satellite images (Gandhi et al. Citation2015). The magnitude of the NDVI index ranges from − 1 to 1. Values ranging from 0.2 to 0.4 represent sparse vegetation, 0.4 to 0.6 indicate moderately dense vegetation, and dense vegetation lies between 0.6 and 1 (Alex, Ramesh, and Hari Citation2017; Quader et al. Citation2021). An NDVI map is created by using the following formula (EquationEq. 2(2)
(2) ) to analyze the sentinel-2 imagery:
(2)
(2) For sentinel-2 imagery, band 8 and band 4 represent the near-infrared (NIR) and red bands, respectively.
Land use and land cover (LULC)
Slope stability is mostly dependent on land use and vegetation cover (Ocakoglu, Gokceoglu, and Ercanoglu Citation2002). In this study, a hybrid classification method was used to classify seven different types of land cover () in the study area using 10 m × 10 m sentinel-2 satellite imagery with the help of ERDAS Imagine 2015 (f). Hybrid classification is the combination of both unsupervised and pixel-based supervised classification techniques (Tang and Pannell Citation2009). For this image, first of all, ISODATA (iterative self-organizing data analysis) classification was applied to find the clusters of spectrally related pixels. A number of 35 classes were chosen to segregate the image. As there were some errors in the unsupervised classification to identify the features as per location, the recode method was applied based on the pixel-based supervised classification. An area of interest (AOI) was delineated in the wrongly classified areas to recode them into the desired one. The final output demonstrates that the area is mostly covered by the forest.
Table 2. Number of classes for hybrid classification of the study area.
Any image classification must include an accuracy assessment to determine the degree of precision of a classified image (Islam, Uddin, and Hossain Citation2021). Confusion matrix was used to calculate the overall accuracy of the image (Brandt et al. Citation2013). The overall accuracy is determined by the total number of correctly classified points divided by the total number of reference points (Islam, Uddin, and Hossain Citation2021). 100 points were used for the accuracy assessment. Those training samples were generated using stratified random sampling techniques. The overall accuracy of the classified image is 86%, and the kappa coefficient is 0.83. The kappa value above 0.80 represents strong agreement between the reference and the classified data (Negassa, Mallie, and Gemeda Citation2020).
Population density
The number of people living per sq. km is defined as the population density of that area which needs to be taken into consideration while determining the vulnerability. A higher amount of vulnerability lies in the area that contains a large population, as there is a high chance of greater damage to life, property, and services (Arrogante-Funes et al. Citation2021). In this study, a projected population dataset for the lowest administrative area for 2020 was used to produce the population density layer (g). Then, population per sq. km was calculated by dividing the total population by the total area of that particular administrative unit. The layer was subsequently rasterized and reclassified into five groups by using ArcMap.
Standardization of criteria layers and alternative ranking
Each criterion was rated into five points, where 1 represents very low risk, and 5 indicates very high risk. Low, moderate, and high risk were identified by classes 2, 3, and 4, respectively. A raster layer was created for each criterion in a 30 m pixel to apply the weighted overlay technique, where each criterion was converted into a raster from the vector layer.
The following equation (Eq. 3) was used to create a standardized layer for each criterion, where linear scale transformation brought the entire alternative values into a common range from 0 to 1 (Hoque et al. Citation2019).
(3)
(3) where p represents standardized score, min and max refer to the minimum and maximum values of each dataset, respectively, and x = a value of the single cell in the dataset.
Analytical hierarchy process (AHP)
Several approaches for landslide mapping have been used in different studies, such as on-ground monitoring, geospatial approach, geomorphologic approach, factors overlay, statistic models, as well as geotechnical process model (Bachri and Shresta Citation2010; Zinck et al. Citation2001). This study used the analytical hierarchy process to weight the criteria for developing the risk map. Saaty’s AHP approach is based on multi-criteria assessment (MCA) techniques, which were developed in the mid-1970s (Ahmed Citation2015). The AHP method was used to rank a set of alternatives. First of all, the AHP hierarchy was created. Then, a pairwise comparison was conducted for each landslide-triggering factor with every other factor that we considered in this study. These comparisons were set out by specialized groups of people including faculties researching landslides and stakeholders working on landslide management. In this process, comparison matrices were formed for the influential elements, and the elements were evaluated pairwise following Saaty’s scale. On that scale, a score of 1 suggests that two criteria are equally significant, while a score of 9 indicates a significant disparity in importance. Finally, the AHP model considers the pairwise comparison as an input and generates the relative weights as output (Bachri and Shresta Citation2010; Sangchini et al. Citation2016). These scores, reflective of expert judgments, underpin the weight matrix developed for this study, as shown in . The application of these scores is consistent with the methodology reported by Swetha and Gopinath (Citation2020), ensuring that our weighting approach aligns with established AHP practices.
Table 3. Weights and consistency ratios of criteria calculated from the pairwise comparison matrices.
The consistency ratio (CR) is a consistency index used in AHP to calculate the degree of consistency (Reis et al. Citation2012). It is calculated using the following formula (Eq. 4):
(4)
(4) where the random index (RI) indicates the randomly produced average consistency index, and the consistency index (CI) can be calculated as follows (Eq. 5):
(5)
(5) where λmax means the greatest eigenvalue of the matrix and n indicates the matrix order (Malczewski Citation2010; Reis et al. Citation2012). The weights and consistency ratios of the criteria are presented in .
In determining the weights for the 12 criteria in the AHP model, each criterion was thoroughly assessed to determine its relative significance in contributing to landslide risk. Direct influence on slope stability was assessed by considering factors such as precipitation intensity, proximity to fault lines, and hydrological parameters. Additionally, the area’s characteristics like population density were assessed for their relation to the possible impact of landslides on human settlement and the surrounding environment.
Results and discussion
Hazard mapping
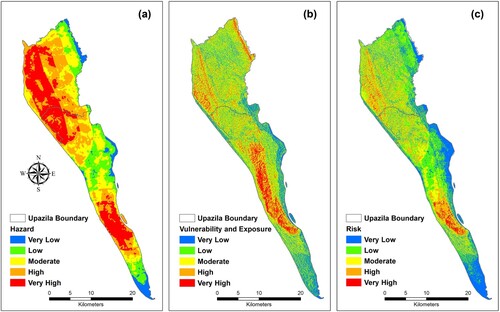
Landslide hazard refers to the probability of encountering a landslide that has the potential to cause harm within a certain timeframe, at a particular location, and of a specified scale (Kamal, Ahmed et al. Citation2022a; Kamal, Hossain et al. Citation2022b). The produced hazard map (a) shows the spatial variation and degree of the landslide hazard in the study area. This spatial scenario was developed by overlaying the layers of distance to the stream network, stream density, precipitation, landslide frequency, and distance to the fault line. When there are no seismic events, heavy rainfall is often the main cause of landslides. However, certain factors, such as the saturation of hillslopes caused by previous rainfall, may also play a role (Emberson, Kirschbaum, and Stanley Citation2021). In the hazard map, 149.30 sq. km. (26.07%) of the area is considered a very high landslide hazard zone. On the other hand, 30.53 sq. km. (5.33%) of the area is considered a very low landslide hazard zone, where 89.64 sq. km. (15.65%), 138.27 sq. km. (24.14%), and 165.02 sq. km. (28.81%) of the area are identified as low, moderate, and high hazard zone respectively. Most of the very high hazard zone is in Teknaf Union, where a large number of hilly areas exist. Some parts of this zone are found near Inani and Shamlapur areas; and in the Teknaf wildlife sanctuary. High and moderate hazard zones cover most of the area along with Rajapalong, Court Bazar, and Bhalukia of Ukhiya in the north; Balukhali, Whaikhyang, Noapara, and Bardell refugee camps at the center; and Teknaf Union in the south. The low hazard zone covers the low land on the border of the study area. The main reasons for the high hazard of landslides are high stream density and access to the fault line.
Figure 5. Risk components maps along with the risk map of the study area; (a) hazard, (b) vulnerability and exposure, and (c) risk.
Vulnerability and exposure mapping
While vulnerability encompasses the human dimensions of disasters, such as social, economic, and cultural factors, exposure refers to the elements at risk of damage by potential hazards (Ahmed Citation2021). The spatial pattern of the vulnerability and exposure is derived from the GIS layers of slope, elevation, aspect, NDVI, geology, LULC, and population density. All of these factors have a substantial impact on the landslide vulnerability in the area. In this study, the produced vulnerability and exposure map (b) illustrates that 41.06 sq. km. (7.22%) of the study area is very highly vulnerable to landslides, and 98.12 sq. km. (17.25%) of the area is of very low vulnerability. Teknaf Union, and part of Whaikhyang and Palongkhali Unions are identified as belonging to the very highly vulnerable zone to landslides. This map gives a comprehensive overview of the vulnerable and exposed communities living under the landslide risk zones. Some of the studies found that slopes with more than 4.6° and 15.7° have a frequency ratio value over 1 and 1.5, respectively (Rabby and Li Citation2020). Accordingly, these areas are highly vulnerable because of the high elevation, greater degree of slope, geology of the area, and reduction of vegetation cover. Besides, 163.14 sq. km. (28.68%) of the area is of low vulnerability, 160.92 sq. km. (28.29%) of the area is moderately vulnerable, and 105.59 sq. km. (18.56%) of the area is highly vulnerable to landslides. Also, the increasing population living along the hills makes them exposed to landslides. Uncontrolled and extensive hill cutting along with unplanned settlements are considered as some of the main reasons for landslides (Rahman, Ahmed, and Di Citation2017). The vulnerability and exposure map also shows the pattern in Teknaf area with large population density and settlement in the high elevated and steep slope of mountainous areas.
Risk mapping
Landslide risk refers to the occurring probability of a landslide and the resulting impacts and damages (Kamal, Ahmed et al. Citation2022a; Kamal, Hossain et al. Citation2022b). We simulated the landslide risk in the Ukhiya and Teknaf Upazilas using a weighted overlay analysis of all the parameters reflecting hazard, vulnerability and exposure. The produced risk map (c) shows that 12.47 sq. km. (2.19%) of the study area falls under a very high risk zone and 72.46 sq. km. (12.74%) falls under the high risk zone for the landslide. A maximum of 131.26 sq. km. (23.08%) area has been identified as a moderate risk zone. 139.53 sq. km. (24.53%) area has been identified as a very low risk zone, and 213.01 sq. km. (37.45%) has fallen under a low risk zone for the landslide. Risk mapping in this area addresses the complexities and uncertainties associated with the quantitative assessment of landslide risk (Huang et al. Citation2022). Sites that are identified as highly risky are due to several criteria. As a result of a large number of Rohingya influx in Ukhiya and Teknaf Upazilas (shown in ), huge amounts of forests are degraded, and some parts of the study area have become risky for the landslide. High risk sites are found in central Teknaf, Teknaf wildlife sanctuary, and part of western Palongkhali. In the context of refugee camps, our study found Leda and Nayapara camps, where a large number of refugees are living, are in the highest risk zone.
The representation of the risk scenario in this analysis was developed based on the spatial overlap of the causative factors, i.e. the higher the spatial intersection of the positively associated contributing factors, the higher the landslide risk. The reasons why this area is mostly identified as a risk zone are forest clearing at a higher rate, a high level of precipitation, and the addition of a large number of refugees located in the area that reduce the resistance of the hilly area. During the monsoon season, this region receives a high amount of precipitation and becomes prone to landslides. IOM (Citation2022) reported that more than 940 and 910 slope failure events were recorded in Kutupalong Registered Camp (KRC) alone between June 2019 and July 2021, respectively. At that time, an early warning system developed by Ahmed et al. (Citation2020a) could have been applied to the high risk sites identified in this study to reduce the casualties. The current approach to landslide risk assessment can address the shortcomings of the existing techniques of evaluating landslide hazards based only on the physical factors without considering the incorporation of social vulnerability elements (Zhou et al. Citation2021). Similarly, we conducted our assessment considering the physical aspects along with the population density.
Correlation of the assessed risk with experimental impact
A total of 58 landslide points were collected to identify the deadliest landslide zones in the field. These incidents are considered for comparison with the assessed risk output of the study. According to the landslide inventory dataset, almost all the deadliest landslides took place from the central part to the southern part of the Teknaf Union. The assessed risk zone of this study strongly correlates with the inventory dataset and found the assessed area mostly falls either in the high risk zone or very high risk zone. Some of the landslide points from the inventory dataset do not align with the assessed risk area, as those points fall under the moderate risk zone and a few fall under the low risk zone. For example, this study designates the central-north part of Teknaf Union as a moderate risk zone, whereas there is a pretty high chance of a landslide based on the landslide inventory dataset. Almost 67.27% of the historical landslide episodes are located in the high or very high risk zones of the study, whereas 22.41% of the landslide episodes located in the moderate risk zones. Only 10.34% landslide events fall under the low and very low risk zones of the assessed result.
Conclusion
In this study, we prepared a comprehensive landslide risk map of Ukhiya and Teknaf Upazilas, a highly populated Rohingya Refugee Settlement area, located in the southeast part of Bangladesh. We used geospatial techniques to prepare and process data of various landslide triggering criteria, while multi-criteria weighting technique AHP was used to weight the criteria. The landslide map was validated using the landslide inventory data. The risk map illustrates high-risk areas located in the center of Teknaf, Teknaf wildlife sanctuary, and part of western Palongkhali, where some parts are close to the Rohingya refugee camps. Some of these sites had already experienced low to moderate level of landslides. The concerned authorities can be proactive in mitigating future losses in these areas by using the results of this study. This study will help them assess and identify the severe and moderate landslide-prone areas properly so they can take the necessary steps before any landslide disaster occurs.
Although we tried to utilize the available data sources and expert opinions properly, several limitations including data quality may affect the findings of the study. The collection of quality and up-to-date data required for the consideration of 12 criteria was challenging. Compared to using a 10-m resolution DEM, high-resolution topographic data such as LiDAR might add more value to the assessment. For LULC classification, high-resolution satellite images could have been better than sentinel-2. Historical landslide inventory data is also not that much available and authentic for the region. Furthermore, an assessment of mitigation capacity could make the result more fruitful, but again this was prevented by a lack of relevant data.
Despite all these limitations mentioned above, the results of the study are still very useful for developing strategies to mitigate the loss due to landslides in the area. Many forest covers that were degraded need to be planted again in the high risk zone so that they can make soils resist landslides. As many Rohingya are settled in these areas, they degrade the forest area at a faster rate to meet the needs for makeshift shelter and firewood. So, these people should be managed properly and resettled from the forest area. Then, the hill cutting should be strictly monitored so that the slopes do not become vulnerable to landslides. If all these anthropogenic causes can be maintained properly, it is expected that the loss of life and property due to landslides may be reduced. Overall, the study suggests that some of the crucial anthropogenic factors that trigger the landslide in the study area are deforestation and slope alteration that make the land unstable. Also, natural factors that are contributing through high precipitation, large number of stream flows, and high elevation. As a result, proper land use planning is required in the study area through some fast-growing species plantation, relocation of refugees and local inhabitants living from the high risk sites, and ensuring slop stabilization through grass planting or concrete slope retention walls.
Acknowledgments
We are thankful to the Bangladesh Meteorological Department, the Geological Survey of Bangladesh, Cox’s Bazar local administration, NASA Earthdata, and the United States Geological Survey for providing the necessary data that we required. We are also grateful to the anonymous reviewers for their valuable comments to improve the quality of the manuscript.
Disclosure statement
No potential conflict of interest was reported by the author(s).
Data availability statement
Raw data were generated at Jagannath University, Bangladesh. Derived data supporting the findings of this study are available from the corresponding author (Muhammad Al-Amin Hoque) on request.
Additional information
Funding
Notes
1 Upazila is a sub-unit of a district.
References
- Adnan, Mohammed Sarfaraz Gani, Md Salman Rahman, Nahian Ahmed, Bayes Ahmed, Md Fazleh Rabbi, and Rashedur M. Rahman. 2020. “Improving Spatial Agreement in Machine Learning-Based Landslide Susceptibility Mapping.” Remote Sensing 12 (20): 3347. https://doi.org/10.3390/rs12203347
- Ahmed, Bayes. 2015. “Landslide Susceptibility Modelling Applying User-Defined Weighting and Data-Driven Statistical Techniques in Cox’s Bazar Municipality, Bangladesh.” Natural Hazards 79 (3): 1707–1737. https://doi.org/10.1007/s11069-015-1922-4
- Ahmed, Bayes. 2017. Community Vulnerability to Landslides in Bangladesh.. London: University College London.
- Ahmed, Bayes. 2021. “The Root Causes of Landslide Vulnerability in Bangladesh.” Landslides 18 (5): 1707–1720. https://doi.org/10.1007/s10346-020-01606-0
- Ahmed, Nahian, Adnan Firoze, and Rashedur M. Rahman. 2020b. “Machine Learning for Predicting Landslide Risk of Rohingya Refugee Camp Infrastructure.” Journal of Information and Telecommunication 4 (2): 175–198. https://doi.org/10.1080/24751839.2019.1704114
- Ahmed, Bayes, Md. Shahinoor Rahman, Peter Sammonds, Rahenul Islam, and Kabir Uddin. 2020a. “Application of Geospatial Technologies in Developing a Dynamic Landslide Early Warning System in a Humanitarian Context: The Rohingya Refugee Crisis in Cox’s Bazar, Bangladesh.” Geomatics, Natural Hazards and Risk 11 (1): 446–468. https://doi.org/10.1080/19475705.2020.1730988
- Alam, Edris. 2020. “Landslide Hazard Knowledge, Risk Perception and Preparedness in Southeast Bangladesh.” Sustainability 12 (16): 1–12.
- Alex, Elsu C, K. V. Ramesh, and Sridevi Hari. 2017. “Quantification and Understanding the Observed Changes in Land Cover Patterns in Bangalore.” International Journal of Civil Engineering and Technology 8 (4): 597–603.
- Arrogante-Funes, Patricia, Adrián G. Bruzón, Fátima Arrogante-Funes, Rocío N. Ramos-Bernal, and René Vázquez-Jiménez. 2021. “Integration of Vulnerability and Hazard Factors for Landslide Risk Assessment.” International Journal of Environmental Research and Public Health 18 (12): 1–21.
- Bachri, Syamsul, and Rajendra P Shresta. 2010. “Landslide Hazard Assessment Using Analytic Hierarchy Processing (AHP) and Geographic Information System in Kaligesing Mountain Area of Central Java Province Indonesia.” 5th annual international workshop & expo on sumatra tsunami disaster & recovery 2010.
- Bathrellos, George D., Kalliopi Gaki-Papanastassiou, Hariklia D. Skilodimou, Dimitrios Papanastassiou, and Konstantinos G. Chousianitis. 2012. “Potential Suitability for Urban Planning and Industry Development Using Natural Hazard Maps and Geological–Geomorphological Parameters.” Environmental Earth Sciences 66 (2): 537–548. https://doi.org/10.1007/s12665-011-1263-x
- BBS, Bangladesh Bureaue of Statistics. 2011. “Population and Housing Census.”
- Boroumandi, Mehdi, M. Khamehchiyan, and Mohammad Reza Nikudel. 2015. “Using of Analytic Hierarchy Process for Landslide Hazard Zonation in Zanjan Province, Iran.” Engineering Geology for Society and Territory 2: 951–955. https://doi.org/10.1007/978-3-319-09057-3_165
- Brandt, Jodi S., Michelle A. Haynes, Tobias Kuemmerle, Donald M. Waller, and Volker C. Radeloff. 2013. “Regime Shift on the Roof of the World: Alpine Meadows Converting to Shrublands.” Biological Conservation 158: 116–127. https://doi.org/10.1016/j.biocon.2012.07.026
- Bui, Dieu Tien, Owe Lofman, Inge Revhaug, and Oystein Dick. 2011. “Landslide Susceptibility Analysis in the Hoa Binh Province of Vietnam Using Statistical Index and Logistic Regression.” Natural Hazards 59 (3): 1413–1444. https://doi.org/10.1007/s11069-011-9844-2
- CDMP-II, Comprehensive Disaster Management Programme-II. 2012. Landslide Inventory & Land-use Mapping,DEM Preparation, Precipitation Threshold Value & Establishment of Early Warning Devices. Ministry of Food and Disaster Management, Disaster Management and Relief Division, Government of the People’s Republic of Bangladesh.
- Chen, Wei, Mahdi Panahi, and Hamid Reza Pourghasemi. 2017. “Performance Evaluation of GIS-Based new Ensemble Data Mining Techniques of Adaptive Neuro-Fuzzy Inference System (ANFIS) with Genetic Algorithm (GA), Differential Evolution (DE), and Particle Swarm Optimization (PSO) for Landslide Spatial Modelling.” CATENA 157: 310–324. https://doi.org/10.1016/j.catena.2017.05.034
- Clerici, Aldo, Susanna Perego, Claudio Tellini, and Paolo Vescovi. 2002. “A Procedure for Landslide Susceptibility Zonation by the Conditional Analysis Method.” Geomorphology 48 (4): 349–364. https://doi.org/10.1016/S0169-555X(02)00079-X
- Cruden, D. M. 1991. “A Simple Definition of a Landslide.” Bulletin of the International Association of Engineering Geology 43 (1): 27–29. https://doi.org/10.1007/BF02590167
- El Jazouli, Aafaf, Ahmed Barakat, and Rida Khellouk. 2019. “GIS-multicriteria Evaluation Using AHP for Landslide Susceptibility Mapping in Oum Er Rbia High Basin (Morocco).” Geoenvironmental Disasters 6 (1): 3. https://doi.org/10.1186/s40677-019-0119-7
- Emberson, R. A., D. B. Kirschbaum, and T. Stanley. 2021. “Landslide Hazard and Exposure Modelling in Data-Poor Regions: The Example of the Rohingya Refugee Camps in Bangladesh.” Earth's Future 9 (2): 1–22. https://doi.org/10.1029/2020EF001666.
- Fell, R., J. Corominas, C. Bonnard, L. Cascini, E. Leroi, and W. Z. Savage. 2008. “Guidelines for Landslide Susceptibility, Hazard and Risk Zoning for Land use Planning.” Engineering Geology 102 (3-4): 85–98. https://doi.org/10.1016/j.enggeo.2008.03.022
- Fernández, Clemente Irigaray, Tomás Fernández Del Castillo, Rachid El Hamdouni, and José Chacón Montero. 1999. “Verification of Landslide Susceptibility Mapping: A Case Study.” Earth Surface Processes and Landforms 24 (6): 537–544. https://doi.org/10.1002/(SICI)1096-9837(199906)24:6<537::AID-ESP965>3.0.CO;2-6
- Gandhi, L., G. Meera, S. Parthiban, Nagaraj Thummalu, and A. Christy. 2015. “Ndvi: Vegetation Change Detection Using Remote Sensing and Gis – A Case Study of Vellore District.” Procedia Computer Science 57: 1199–1210. https://doi.org/10.1016/j.procs.2015.07.415
- Gökceoglu, C., and H. Aksoy. 1996. “Landslide Susceptibility Mapping of the Slopes in the Residual Soils of the Mengen Region (Turkey) by Deterministic Stability Analyses and Image Processing Techniques.” Engineering Geology 44 (1-4): 147–161. https://doi.org/10.1016/S0013-7952(97)81260-4
- Gopinath, Girish, Nalukudiparambil Jesiya, Ashokan Laila Achu, Arun Bhadran, and Udayar Pillai Surendran. 2023. “Ensemble of Fuzzy-Analytical Hierarchy Process in Landslide Susceptibility Modeling from a Humid Tropical Region of Western Ghats, Southern India.” Environmental Science and Pollution Research 9: 1–18.
- Hassan, Mohammad Mehedy, Audrey Culver Smith, Katherine Walker, Munshi Khaledur Rahman, and Jane Southworth. 2018. “Rohingya Refugee Crisis and Forest Cover Change in Teknaf, Bangladesh.” Remote Sensing 10: 689. https://doi.org/10.3390/rs10050689
- Highland, L. M., and Peter Bobrowsky. 2008. The Landslide Handbook – A Guide to Understanding Landslides. Circular 1325. Reston, Virginia: U.S. Geological Survey.
- Hoque, Muhammad Al-Amin, Stuart Phinn, Chris Roelfsema, and Iraphne Childs. 2017. “Tropical Cyclone Disaster Management Using Remote Sensing and Spatial Analysis: A Review.” International Journal of Disaster Risk Reduction 22: 345–354. https://doi.org/10.1016/j.ijdrr.2017.02.008
- Hoque, Muhammad Al-Amin, Biswajeet Pradhan, Naser Ahmed, and Sanjoy Roy. 2019. “Tropical Cyclone Risk Assessment Using Geospatial Techniques for the Eastern Coastal Region of Bangladesh.” The Science of the Total Environment 692: 10–22. https://doi.org/10.1016/j.scitotenv.2019.07.132
- Hossain, Farhad, A S M Maksud Kamal, Sumiya Sadeak, and Md. Yousuf Gazi. 2023. “Quantitative Soil Erosion Risk Assessment due to Rapid Urbanization in the Cox’s Bazar District and Rohingya Refugee Camps in Bangladesh.” Stochastic Environmental Research and Risk Assessment 37 (3): 989–1006. https://doi.org/10.1007/s00477-022-02314-y
- Hossen, Saddam, Mohammed Kamal Hossain, and Mohammad Fahim Uddin. 2019. “Land Cover and Land use Change Detection by Using Remote Sensing and GIS in Himchari National Park (HNP), Cox's Bazar, Bangladesh.” Journal of Science Technology and Environment Informatics 7 (2): 544–554. https://doi.org/10.18801/jstei.070219.56
- Huang, Faming, et al. 2022. “Uncertainty Pattern in Landslide Susceptibility Prediction Modelling:Effects of Different Landslide Boundaries and Spatial Shape Expressions.” Geoscience Frontiers 13 (2): 1–13.
- Imtiaz, Sakib. 2018. “Ecological Impact of Rohingya Refugees on Forest Resources:Remote Sensing Analysis of Vegetation Cover Change in Teknaf Peninsula in Bangladesh.” Ecocycles 4 (1): 16–19. https://doi.org/10.19040/ecocycles.v4i1.89
- Inter Sector Coordination Group. 2019. “MONSOON RESPONSE IN ROHINGYA REFUGEE CAMPS.”
- IOM, International Organization for Migration. 2022. “Incident Monitoring: Rohingya Refugee Camps, Bangladesh. IOM Needs and Population Monitoring (NPM) Team in Cox's Bazar Bangladesh.”
- Islam, Md. Saiful, Md. Asraf Uddin, and Mallik Akram Hossain. 2021. “Assessing the Dynamics of Land Cover and Shoreline Changes of Nijhum Dwip (Island) of Bangladesh Using Remote Sensing and GIS Techniques.” Regional Studies in Marine Science 41: 1–9.
- Jaedicke, Christian, et al. 2014. “Identification of Landslide Hazard and Risk ‘Hotspots’ in Europe.” Bulletin of Engineering Geology and the Environment 73 (2 ): 325–339.
- Jonathan, Eno. 2019. Assessing Landslide Risk in Rohingya Refugee Camps. Columbia: State of the Planet.
- Kamal, A. S. M. Maksud, Bayes Ahmed, Sumya Tasnim, and Peter Sammonds. 2022a. “Assessing Rainfall-Induced Landslide Risk in a Humanitarian Context: The Kutupalong Rohingya Camp in Cox's Bazar, Bangladesh.” Natural Hazards Research 2 (3): 230–248. https://doi.org/10.1016/j.nhres.2022.08.006
- Kamal, A. M., F. Hossain, M. Z. Rahman, B. Ahmed, and P. Sammonds. 2022b. “Geological and Soil Engineering Properties of Shallow Landslides Occurring in the Kutupalong Rohingya Camp in Cox’s Bazar, Bangladesh.” Landslides 19 (2): 465–478. https://doi.org/10.1007/s10346-021-01810-6
- Kavzoglu, Taskin, Emrehan Kutlug Sahin, and Ismail Colkesen. 2014. “Landslide Susceptibility Mapping Using GIS-Based Multi-Criteria Decision Analysis, Support Vector Machines, and Logistic Regression.” Landslides 11 (3): 425–439. https://doi.org/10.1007/s10346-013-0391-7
- Khan, Md Jamal Uddin, A. K. M. Saiful Islam, Sujit Kumar Bala, and G. M. Tarekul Islam. 2020. “Changes in Climate Extremes Over Bangladesh at 1.5, 2, and 4 °C of Global Warming with High-Resolution Regional Climate Modeling.” Theoretical and Applied Climatology 140 (3-4): 1451–1466. https://doi.org/10.1007/s00704-020-03164-w
- Kirschbaum, Dalia Bach, Robert Adler, Yang Hong, Stephanie Hill, and Arthur Lerner-Lam. 2010. “A Global Landslide Catalog for Hazard Applications: Method, Results, and Limitations.” Natural Hazards 52 (3): 561–575. https://doi.org/10.1007/s11069-009-9401-4
- Lee, S. 2005. “Application of Logistic Regression Model and its Validation for Landslide Susceptibility Mapping Using GIS and Remote Sensing Data.” International Journal of Remote Sensing 26 (7): 1477–1491. https://doi.org/10.1080/01431160412331331012
- Lee, Saro, and Kyungduck Min. 2001. “Statistical Analysis of Landslide Susceptibility at Yongin, Korea.” Environmental Geology 40 (9): 1095–1113. https://doi.org/10.1007/s002540100310
- Malczewski, Jacek. 2010. “Multiple Criteria Decision Analysis and Geographic Information Systems.” In Vol. 142, in Trends in Multiple Criteria Decision Analysis, edited by Matthias Ehrgott, José Rui Figueira, and Salvatore Greco, 369–395. Boston: Springer.
- Mind’je, Richard, Lanhai Li, Jean Baptiste Nsengiyumva, Christophe Mupenzi, Enan Muhire Nyesheja, Patient Mindje Kayumba, Aboubakar Gasirabo, and Egide Hakorimana. 2020. “Landslide Susceptibility and Influencing Factors Analysis in Rwanda.” Environment, Development and Sustainability 22 (8): 7985–8012. https://doi.org/10.1007/s10668-019-00557-4.
- Moniruzzaman, Md. 2012. “Geospatial Analysis of Damage, Loss, Recovery and Reconstruction: A Case on Cyclone Sidr.” PhD diss. Savar: Department of Geography and Environment, Jahangirnagar University.
- Naranjo, Laura. 2007. “Connecting Rainfall and Landslides | Earthdata.”
- Negassa, Milkessa Dangia, Demissie Tsega Mallie, and Dessalegn Obsi Gemeda. 2020. “Forest Cover Change Detection Using Geographic Information Systems and Remote Sensing Techniques: A Spatio-Temporal Study on Komto Protected Forest Priority Area, East Wollega Zone, Ethiopia.” Environmental Systems Research 9 (1): 1–14. https://doi.org/10.1186/s40068-020-0163-z.
- Ocakoglu, Faruk, Candan Gokceoglu, and Murat Ercanoglu. 2002. “Dynamics of a Complex Mass Movement Triggered by Heavy Rainfall: A Case Study from NW Turkey.” Geomorphology 42 (3-4): 329–341. https://doi.org/10.1016/S0169-555X(01)00094-0
- Park, Soyoung, Chuluong Choi, Byungwoo Kim, and Jinsoo Kim. 2013. “Landslide Susceptibility Mapping Using Frequency Ratio, Analytic Hierarchy Process, Logistic Regression, and Artificial Neural Network Methods at the Inje Area, Korea.” Environmental Earth Sciences 68 (5): 1443–1464. https://doi.org/10.1007/s12665-012-1842-5
- Pathak, Dinesh. 2016. “Remote Sensing and GIS Application in Landslide Risk Assessment and Management.” Journal on Geoinformatics, Nepal, 52–57. https://doi.org/10.3126/njg.v15i1.51186
- Petley, Dave, Stuart Dunning, and N. J. Rosser. 2005. “The Analysis of Global Landslide Risk Through the Creation of a Database of Worldwide Landslide Fatalities.” In Landslide Risk Management, edited by Oldrich Hungr, Robin Fell, Réjean Couture, and Erik Eberhardt, 367–374. CRC Press.
- Pourghasemi, Hamid Reza, Biswajeet Pradhan, and Candan Gokceoglu. 2012. “Application of Fuzzy Logic and Analytical Hierarchy Process (AHP) to Landslide Susceptibility Mapping at Haraz Watershed, Iran.” Natural Hazards 63 (2): 965–996. https://doi.org/10.1007/s11069-012-0217-2
- Quader, Mohammad Abdul, Hemal Dey, Md. Abdul Malak, and Abdul Majed Sajib. 2021. “Rohingya Refugee Fooding and Changes of the Physical and Social Landscape in Ukhiya, Bangladesh.” Environment, Development and Sustainability 23 (3): 4634–4658. https://doi.org/10.1007/s10668-020-00792-0
- Rabby, Yasin Wahid, and Yingkui Li. 2020. “Landslide Susceptibility Mapping Using Integrated Methods: A Case Study in the Chittagong Hilly Areas, Bangladesh.” Geosciences 10 (12): 1–26.
- Rahman, Md. Shahinoor, Bayes Ahmed, and Liping Di. 2017. “Landslide Initiation and Runout Susceptibility Modeling in the Context of Hill Cutting and Rapid Urbanization: A Combined Approach of Weights of Evidence and Spatial Multi-Criteria.” Journal of Mountain Science 14 (10): 1919–1937. https://doi.org/10.1007/s11629-016-4220-z
- Rahman, M., M. S. Islam, and T. A. Chowdhury. 2019. “Change of Vegetation Cover at Rohingya Refugee Occupied Areas in Cox’s Bazar District of Bangladesh: Evidence from Remotely Sensed Data.” Journal of Environmental Science and Natural Resources 11: 9–16. https://doi.org/10.3329/jesnr.v11i1-2.43360
- Regmi, Amar Deep, Krishna Chandra Devkota, Kohki Yoshida, Biswajeet Pradhan, Hamid Reza Pourghasemi, Takashi Kumamoto, and Aykut Akgun. 2014. “Application of Frequency Ratio, Statistical Index, and Weights-of-Evidence Models and Their Comparison in Landslide Susceptibility Mapping in Central Nepal Himalaya.” Arabian Journal of Geosciences 7 (2): 725–742. https://doi.org/10.1007/s12517-012-0807-z.
- Reis, Selçuk, A. Yalcin, M. Atasoy, R. Nisanci, T. Bayrak, M. Erduran, C. Sancar, and S. Ekercin. 2012. “Remote Sensing and GIS-Based Landslide Susceptibility Mapping Using Frequency Ratio and Analytical Hierarchy Methods in Rize Province (NE Turkey).” Environmental Earth Sciences 66 (7): 2063–2073. https://doi.org/10.1007/s12665-011-1432-y.
- Roy, Dulal Chandra, and Thomas Blaschke. 2015. “Spatial Vulnerability Assessment of Floods in the Coastal Regions of Bangladesh.” Geomatics, Natural Hazards and Risk 6 (1): 21–44. https://doi.org/10.1080/19475705.2013.816785
- Saha, Ashis, R. P. Gupta, and Manoj Arora. 2002. “GIS-based Landslide Hazard Zonation in the Bhagirathi (Ganga) Valley, Himalayas.” International Journal of Remote Sensing 23 (2): 357–369. https://doi.org/10.1080/01431160010014260
- Saha, Ashis K., Ravi P. Gupta, Irene Sarkar, Manoj K. Arora, and Elmar Csaplovics. 2005. “An Approach for GIS-Based Statistical Landslide Susceptibility Zonation—with a Case Study in the Himalayas.” Landslides 2 (1): 61–69. https://doi.org/10.1007/s10346-004-0039-8
- Sangchini, Ebrahim Karimi, Seyed Naim Emami, Naser Tahmasebipour, Hamid Reza Pourghasemi, Seyed Amir Naghibi, Seyed Abdolhossein Arami, and Biswajeet Pradhan. 2016. “Assessment and Comparison of Combined Bivariate and AHP Models with Logistic Regression for Landslide Susceptibility Mapping in the Chaharmahal-e-Bakhtiari Province, Iran.” Arabian Journal of Geosciences 9 (3): 1–15. https://doi.org/10.1007/s12517-015-2258-9.
- Sultana, Neegar. 2020. “Analysis of Landslide-Induced Fatalities and Injuries in Bangladesh: 2000-2018.” Cogent Social Sciences 6 (1): 1–26.
- Swetha, T. V., and Girish Gopinath. 2020. “Landslides Susceptibility Assessment by Analytical Network Process: A Case Study for Kuttiyadi River Basin (Western Ghats, Southern India).” SN Applied Sciences 2 (11): 1–16. https://doi.org/10.1007/s42452-020-03574-5.
- Talaei, Reza. 2014. “Landslide Susceptibility Zonation Mapping Using Logistic Regression and its Validation in Hashtchin Region, Northwest of Iran.” Journal of the Geological Society of India 84 (1): 68–86. https://doi.org/10.1007/s12594-014-0111-5
- Tang, Yanbing, and Clifton W. Pannell. 2009. “A Hybrid Approach for Land Use/Land Cover Classification.” GIScience & Remote Sensing 46 (4): 365–387. https://doi.org/10.2747/1548-1603.46.4.365
- Tehrani, Faraz S., and Lieke Husken. 2019. “Landslide Susceptibility Mapping of Refugee Camps in Bangladesh.” ICONHIC2019 - 2nd international conference on natural hazards & infrastructure, chania, Greece.
- Torkashvand, Ali Mohammadi, Akram Irani, and Jaliledin Sorur. 2014. “The Preparation of Landslide map by Landslide Numerical Risk Factor (LNRF) Model and Geographic Information System (GIS).” The Egyptian Journal of Remote Sensing and Space Science 17 (2): 159–170. https://doi.org/10.1016/j.ejrs.2014.08.001
- UNISDR, United Nations Office for Disaster Risk Reduction. 2018. “Economic Losses, Poverty & DISASTERS.”
- Vojteková, Jana, and Matej Vojtek. 2020. “Assessment of Landslide Susceptibility at a Local Spatial Scale Applying the Multi-Criteria Analysis and GIS: A Case Study from Slovakia.” Geomatics, Natural Hazards and Risk 11 (1): 131–148. https://doi.org/10.1080/19475705.2020.1713233
- WMO, World Meteorological Organization. 2020. “2020 State of Climate Services: Risk Information and Early Warning Systems.”
- Wu, Chunhung. 2017. “Comparison and Evolution of Extreme Rainfall-Induced Landslides in Taiwan.” ISPRS International Journal of Geo-Information 6 (11): 367. https://doi.org/10.3390/ijgi6110367
- Yalcin, Ali, and Fikri Bulut. 2007. “Landslide Susceptibility Mapping Using GIS and Digital Photogrammetric Techniques: A Case Study from Ardesen (NE-Turkey).” Natural Hazards 41 (1): 201–226. https://doi.org/10.1007/s11069-006-9030-0
- Zhou, Xiaoting, Weicheng Wu, Yaozu Qin, and Xiao Fu. 2021. “Geoinformation-based Landslide Susceptibility Mapping in Subtropical Area.” Scientific Reports 11 (1): 1–21.
- Zinck, J Alfred, Jaime López, Graciela I Metternicht, Dhruba P Shrestha, and Lorenzo Vázquez-Selem. 2001. “Mapping and Modelling Mass Movements and Gullies in Mountainous Areas Using Remote Sensing and GIS Techniques.” International Journal of Applied Earth Observation and Geoinformation 3 (1): 43–53. https://doi.org/10.1016/S0303-2434(01)85020-0