
ABSTRACT
This article presents on trends in military spending, building on the most recent military expenditure data by the Stockholm International Peace Research Institute (SIPRI). World military spending grew for the eighth consecutive year in 2022, up 3.7 per cent to an all-time high of $2240 billion. The increase in world spending in 2022 was largely due to three factors: Russia’s invasion of Ukraine; the increase in military spending by Central and Western Europe countries as a reaction to the invasion and expenditure rises in major powers in Asia, namely China, India and Japan. There were two major military expenditure related developments in 2022 linked to the war in Ukraine. Firstly, Central and Western European responded to the deteriorating security situation by announcing plans to substantially increases their military spending. Some of the acutest increases in military spending took place in countries with close geographical proximity to Russia and Ukraine. Secondly were the immediate and record levels of military aid sent to Ukraine. Based on official figures for the largest donors and other assistance funds, at least $30 billion worth of military aid was given to Ukraine in 2022, with the US as the largest provider accounting for around two-thirds of all military aid
Introduction
Military expenditure data has been a core part of the research and work for the Stockholm International Peace Research Institute (SIPRI) since its establishment in 1966. With the original rationale to provide impartial data in hopes of contributing to disarmament negotiations, the SIPRI Military Expenditure database has developed to become one of the most comprehensive and authoritative open-sourced databases on military spending (see Perlo-Freeman and Sköns Citation2016 for details on the history of SIPRI’s military expenditure database).
Since 1966, the SIPRI military expenditure database has contributed to and facilitated academic and policy-orientated research in Economics, Political Science and International Relations. Well-known research strands involving military expenditure include but are not limited to: the economic effects of military spending; demand or determinants of military spending; the relationship between military spending and debt; the political economy of military spending; and military spending and corruption.
The SIPRI military expenditure database currently covers 174 countries from 1949 to 2022. The data is provided in the form of seven variables: military spending in local currency financial year; military spending in local currency calendar year; military spending in current US$; military spending in constant US$; military spending as a share of GDP; military spending per capita; and military spending as a share of total government spending. Due to the issue of information availability, not all country time series date back to 1949 and the variables military spending per capita and military spending as a share of total government spending cover only the period 1988 to 2022. Where possible, SIPRI only uses primary sources to compile its military expenditure data.Footnote1
To provide an easily identifiable measure of the scale of resources absorbed by the military, military expenditure is defined in the following manner. Military expenditure includes all current and capital spending on personnel (salaries, pensions and social services for the military and civil personnel), operations and maintenance of the armed force and Ministry of Defence, military research and development, military infrastructure spending (i.e. military bases or hospitals) and military aid. SIPRI does not count civil defence and current expenditures on previous military activities, such as veterans’ benefits, demobilization, conversion and weapon destruction as part of its military expenditure figures.Footnote2
This article contributes to the knowledge of military expenditure in three ways. First, it provides an overview of the developments in military spending during 2022, globally, in the world’s main regions and by the major military spenders. Second, the article investigates the immediate effect of Russia’s invasion of Ukraine on military expenditure decisions in the countries both near the conflict and sees Russia as a prominent threat. Central and Western European countries precisely fit this classification. Third, one notable development in 2022 was the amount of military aid given to Ukraine to support its war effort. This article offers a summary of the military aid countries gave Ukraine in 2022, albeit with detailed country examples.
The next section of this article details some considerations in using the military expenditure data for econometric analysis. Section three presents recent trends and developments in world military spending, focusing particularly on the top military spenders and events in 2022. Section four touches on key developments in military spending in each of the five regions. Section five serves two purposes. First, it starts by analyzing changes in military expenditure and military burden of Central and Western European countries against the backdrop of the military spending pledges announced since February 2022. Second, the section details the financial military aid countries have given Ukraine since the invasion began. The sixth and final section offers some concluding remarks.
The Use and Considerations of Military Expenditure Data for Empirical Analysis
Of the seven measures of military expenditure data SIPRI publishes, the two most common measures used in econometric analysis are military expenditure in constant US$ and military spending as a share of GDP. By removing the effects of inflation and expressing the financial cost of military activities in a common currency, military expenditure given in constant US dollar is ideal for analysis aimed at either across country, over time or both. Military spending as a share of GDP, also known as military burden, represents the economic cost associated with the military relative to the economy. In other words, it shows how much of available total output is devoted to military activities. The measure, being a share, is comparable across country and over time without the complications of choosing a price deflator or base year exchange rate. This measure is also ideal for cross-country or over time analysis, but it does carry the drawback of not offering any information about the level of military expenditure.
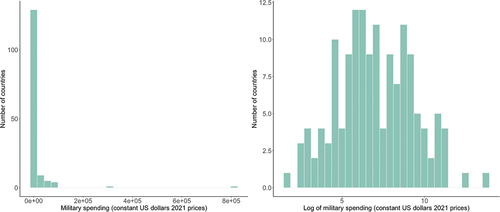
Irrespective of which measure of military spending users choose, there needs to be careful consideration of the data, such as the shape or distribution over time and across countries. If neglected, these features may influence simple descriptive analysis such as correlations, as well as results stemming from more complex statistical inference methods. For those intending to use military expenditure in constant US dollars, shows that the distribution of the variable is heavily skewed to the right with two clear outliers, the US and China. This distribution can be problematic to popular estimation techniques such as Ordinary Least Squares (OLS). The skewedness and the presence of glaring outliers can affect the distribution and variance of the error term, which lead to incorrect confidence intervals and standard errors. One possible way to deal with this at least partly is to transform the data using logarithms. Logarithmic functions shrink the differences between large and small values; as a result, the distribution of logged values approximates a normal distribution. Of course, it is important to bear in mind that this transformation changes the interpretation of estimates.
Figure 1. Histogram of military spending in 2022, log and non-logged (constant 2021 US$).
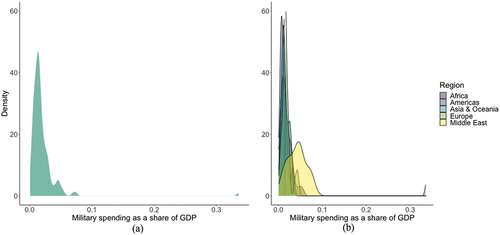
For the variable military spending as a share of GDP, while there is less of a concern for normality in the data distribution (see ) there is substantial heterogeneity between regions. On average, the standard deviation of military burden is lowest in the Americas, followed by Asia and Oceania, Africa, Europe and the Middle East. This is reflected in the position of the density plots where the Americas is the leftist curve while the Middle East is the rightmost k-density plot (see ). Analysis using military burden should account for region-specific heterogeneity.
Figure 2. 2a,2b. Density plot of military burden, 2022, overall and by region.
Developments in Global Military Expenditure
The rising trend in global military spending that remained unbroken amid the pandemic-related economic downturn continued in 2022. At $2240 billion, world military spending was estimated to have risen by 3.7 per cent from 2021 to the highest level SIPRI has ever recorded (see ). Growth in world spending in 2022 – the eighth consecutive rise – was largely due to Russia’s invasion of Ukraine and increases in Asia, namely China, India and Japan.
Figure 3. World military expenditure, by region, 1988-2022.
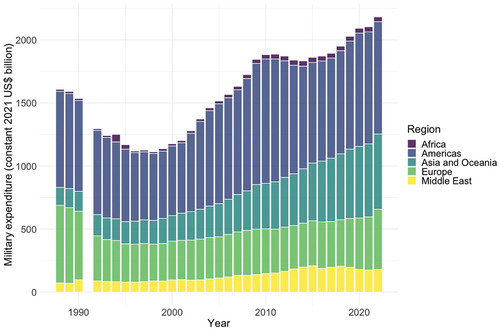
Despite the increase in world military spending, the global military burden – world military expenditure as a share of world GDP – remained at 2.2 per cent as world GDP rose concomitantly with world military spending. In fact, world military burden at 2.2 per cent is one of the lowest since the end of the cold war. The only years for which world military burden was as low as 2.2 per cent was in 2014, 2018 and 2021. Average military spending as a share of government expenditure in 2022 was 6.2 per cent, 0.1 percentage points lower compared to 2021, while per capita world military spending rose for the sixth consecutive time in 2022 to $282.
displays the evolution of world military spending between 1988 and 2022 and divides the expenditures into five geographical regions. Countries in the Americas accounted for the largest share of the total world military spending in 2022, 42 per cent. Asia and Oceania spent an equivalent to 26 per cent of the world total, followed by Europe with 22 per cent. The Middle East accounted for 8.3 per cent. Africa spent far less, at 1.8 per cent of the world’s total.
World military spending is highly concentrated within the top spenders, where even moderate changes in the largest spenders affect the global trend. The top three spenders in the world, the US, China and Russia account for 56 per cent of the world total. Enlarging the group to the top 15 spenders amounts to $1842 billion or 82 per cent of world spending.
United States
SIPRI’s estimate of United States military spending includes categories outside what the Department of Defense (DoD) reports. This is based on the assessment that US military activities extend to additional departments. US military expenditure, according to SIPRI methodology, includes spending by the DoD, Department of Energy (DoE), Department of State (DoS), funding for the National Intelligence Programme and additional military aid allocations to Ukraine. In the case of the DoE, expenditure relates to the upkeep and maintenance of the country’s nuclear arsenal and the DoS covers foreign military aid given to recipients globally.
US spending in 2022 was $877 billion. Despite a nominal growth of 8.8 per cent, the real increase in 2022 was a marginal 0.7 per cent. The U.S.A remained by far the largest military spender in the world, accounting for 39 per cent of world military spending and allocating three times more than the second largest spender, China. One major development in 2022 was the amount of military aid that US Congress appropriated in response to Russia’s renewed invasion of Ukraine. US military aid to Ukraine in 2022 totalled $19.9 billion or 2.3 per cent of US military spending. This was the largest donation of military aid by any country to a single beneficiary in any year since the end of the cold war (see section IV for more).
The 2022 US military spending budget marked the first year after the Budget Control Act (BCA) ended. In 2011, amid an ongoing crisis about rising national debt and deficit, former President Obama established the BCA as a way to resolve the problem by temporarily raising the debt ceiling in exchange for future spending cuts. One spending area targeted by cuts would be discretionary spending, of which military spending accounted for over half the total US discretionary budget (Ahmed, Mahmood, and Shadmani Citation2022). The BCA came into effect in 2012 and lasted till 2021.
One ongoing research question within the military expenditure literature that gained policy prominence is the link between military expenditure and debt (Caruso and Di Domizio Citation2017; Paleologou Citation2013; Norrlof and Wohlforth Citation2019). In the case of US, military spending was one of the main contributors to higher levels of debt. Other countries, such as Greece, have also relied on debt to partly fund their military (Dimitraki and Kartsaklas Citation2018)). By 2022, 10 years on from the implementation of the BCA, an analysis shows that the BCA failed to effectively constrain US military spending. The US congress and both former President Obama and Trump repeatedly enacted legislation to increase the spending limit, which defeated the original purpose of the BCA. One of the methods used to circumvent the cap was through specific budget categories on emergency spending not limited by the BCA. An example of this was spending on Overseas Contingency Operations (OCO). Between 2012-2021 in which the BCA was in effect, an estimated $880 billion was allocated to the military outside the spending caps for OCO. Concomitantly, US debt as a share of GDP continued to rise. According to the World Bank, central government debt went from 95 per cent of GDP in 2013 to 120 per cent of GDP by 2021.
China
China, the world’s second largest spender, allocated an estimated $292 billion to its military in 2022. This represents a 4.2 per cent increase from the previous year and a 63 per cent increase from 2013. Remarkably, China has been consistently increasing its military expenditure for 28 years, the longest streak by any country in the SIPRI Military Expenditure Database. However, the growth rate in 2022 was the second-lowest since 1995, higher only than the increase of 2.6 per cent in the previous year. Both years saw economic challenges brought by China’s stringent ‘Zero-COVID’ policy, which only ended in December 2022. China’s military burden remained steady at 1.6 per cent of GDP in 2022 and has stayed relatively stable between 1.6 per cent and 1.8 per cent over the last decade.
The recent developments reflect the longer trend of China’s military spending: it has grown in tandem with the pace of GDP growth in the last three decades. During the rapid economic expansion in the 1990s and 2000s, its military budget increased drastically, by 122 per cent between 1993 and 2002, followed by a 152 per cent growth between 2003 and 2012. With an economic slowdown in the 2010s, the growth rate of its military spending slowed, leading to a comparatively lower 63 per cent increase between 2013-22. Similarly, military expenditure as a percentage of government expenditure has been on a steady decline, from 13 per cent in 1989 (the first year when data for China was available) to 4.8 per cent in 2022.
The continued growth in China’s military spending can be attributed to its efforts to modernize the People’s Liberation Army (PLA). The current priorities of military expenditure align with the 14th five-year plan (2021-2025) for the PLA, which aims to enhance the arms-industrial base and develop cutting-edge military technologies, including military application of artificial intelligence. According to the most recent available data on budget allocation in 2020, equipment costs accounted for the largest portion (37 per cent) of China’s official defence budget, followed by training & maintenance (33 per cent) and personnel cost (30 per cent).
The existing literature has widely acknowledged that the official national defence budget does not account for all of China’s military spending. Despite efforts by analysts to produce more accurate estimates of China’s military expenditure, the lack of public transparency and spending disaggregation has been a major challenge. China’s reporting to the UN Report on Military Expenditures (UNMILEX) is irregular, with low frequency and limited details. This limits the ability of researchers and policymakers to gain a complete understanding of the world’s second biggest military spender.
To create a more comprehensive assessment of the financial resources China allocates to military purposes, SIPRI revised its original methodology of estimating Chinese military expenditure in 2021 (Wang Citation1999; Tian and Su Citation2021). The new estimate includes six components, five of which are excluded in the official defence budget but important elements of what SIPRI defines as military expenditure. Actual expenditure information is available for four of the six components: national defence, the People’s Armed Police, pension payments to demobilized and retired soldiers, and additional military construction spending. Together, these four categories accounted for 91 per cent of China’s total spending in 2022. Estimates are made for the two remaining components: the China Coast Guard and additional funding for military research, development, testing and evaluation. The combined share of these two components was 8.7 per cent of the total in 2022. Therefore, the SIPRI figure for 2022 is 33 per cent, or 489 billion yuan ($73 billion), higher than the figure published in the official state budget.
Russia
SIPRI’s estimate of Russian military spending includes several categories, according to a methodology developed by Julian Cooper (Cooper Citation1998). The estimate can be divided into two broad sets. The first, Russia’s official defence budget, which is the ‘national defence’ budget line available in Russian official documentation (‘национальная оборона’). The second comprises additional line items related to expenditure on the armed forces. These can be labelled as ‘other military expenditure’ (Cooper Citation2022). These additional budget lines encompass for instance housing, education, and health for the armed forces, but also spending for paramilitary forces, border guards and support for the Baikonur space center. Since 2015, the ‘national defence’ portion has accounted for 70-80 per cent of total estimated military spending.
Russia’s military spending have grown in recent years. Russia’s State Armament Programme 2011-2020 was an ambitious modernization plan for the country’s armed forces, which was underpinned by significant funding. Accordingly, Russia’s military spending grew by 50 per cent between 2011 and 2016, the year when it reached a peak due to the government’s repayment of bank loans for the arms industry (Wezeman Citation2020). Although 2017 showed a decrease, Russian military spending has since 2018 returned to a upward trend. In 2021 the ‘national defence’ budget line was revised upwards multiple times. In the Budget Law of 8 December 2020, ‘national defence’ for 2021 was set at 3118 billion roubles ($42.3 billion). Eventually, information from the State Treasury regarding actual spending for the year 2021 showed that 3573 billion roubles ($48.4 billion) had been spent under this budget line. As 2021 had been a year of high commodity prices, Russia’s spending increase was likely funded through oil and gas export revenues.
The revised spending increases are likely to have been spent on operational activities, given that additional funds could not be easily allocated to weapon production and procurement. This coincided with the troop build-up alongside the Ukrainian border that ultimate led to the 2022 full-scale invasion.
Russian military spending amounted to $86.4 billion in 2022, an increase of 9.2 per cent. The growth in spending reflects the costs of the war against Ukraine. The implications of this full-fledged conventional war unsurprisingly influenced Russia’s total military spending in 2022. The available data shows that the costs of the war increased compared to what had initially been budgeted for. In the budget law for the period 2022-2024, voted at the end of 2021, the ‘national defence’ budget line was initially planned at 3502 billion roubles ($50.1 billion). Actual spending, estimated based on October 2022 documents, was instead 4679 billion roubles ($67.0 billion), a 34 per cent increase. Categories where spending rose included procurement and maintenance and the paramilitary troops of the national guard (Rosvgardia) who are also deployed in Ukraine.
With the end of the conflict nowhere in sight, it is likely that the Russian government will continue to prioritise military spending. This would be despite the foreseeable fall in this source of income, given Western sanctions including the oil price cap and attempts to diversify supply for energy away from Russia. However, the expected decline in budgetary transparency will make Russian military spending estimates increasingly difficult.
Ukraine
Ukraine’s military spending estimate is also composed of several categories. The main spending item is the figure for the functional defence budget, extracted from budgetary execution figures of the Ukrainian Ministry of Finance. Between 2021 and 2022, the budget line ‘defence’ increased almost 10-fold from 127.5 billion hryvnia ($4.7 billion) to 1142.9 billion ($35.0 billion). Additional categories include estimates for pensions, border guards and paramilitary troops. As 2022 figures were not available for the last two categories, they have been estimated based on 2021 data.
Altogether, SIPRI estimated Ukraine’s military spending totalled $44.0 billion in 2022, a 640 per cent increase over 2021. The trajectory of Ukraine’s military spending was already on the rise before 2022. Between 2014 and 2021, following the annexation of Crimea and prior to Russia’s full-scale invasion, Ukraine’s military spending was up by 73 per cent. The growth rates were even more staggering when considering a decade-long perspective: 1661 per cent growth between 2013 and 2022.
Looking at military spending from different perspectives further highlighted the economic costs for a country at war. Ukraine’s military burden, or military spending as share of GDP, reached 34 per cent in 2022, against 3.2 per cent in 2021. This was due to the combination of the hike in military spending and economic contraction due to Russia’s invasion. According to IMF estimates, Ukraine’s GDP declined by 35 percentage points in 2022. Budget execution documents further show that defence amounted to over 40 per cent of the state budget in 2022.
Key Developments in Military Spending Around the World
Military spending increased in 4 of the 5 regions in 2022, the only region where spending fell was in Africa. In the Americas, higher military spending was primarily due to rising US spending. In Asia and Oceania, spending rose for the 34th consecutive year. European military expenditure increased by 13 per cent, the highest year-on-year increase since the end of the cold war. Total spending by countries in the Middle East rose for the first time in four years.
Africa
Military expenditure in Africa fell by 5.3 per cent to $39.4 billion in 2022. The 2022 decline in spending was the biggest percentage drop since 2000. The five largest spenders in Africa – Algeria, Morocco, South Africa, Nigeria and Angola – all had decreases in their military expenditure. Before the 5.3 per cent decrease, spending by African countries was trending upward following three consecutive years of increases.
Both Algeria and Morocco, neighbours and the two largest spenders in Africa, decreased military spending in 2022. Amid historical rivalries and the ongoing territorial dispute over Western Sahara, Algeria’s military spending fell by 3.7 per cent in 2022 to $9.1 billion, while spending marginally fell by 0.2 per cent in Morocco to $5.0 billion.
Nigeria’s military expenditure, the region’s third largest, fell by the most, down 38 per cent in 2022 to $3.1 billion. The decrease in spending comes after a 56 per cent increase in 2021 as the state looked to strengthen the country’s military capabilities in response to a plethora of security challenges ranging from banditry to armed conflicts against the non-state armed groups. On top of the ongoing security crisis, the country witnessed in 2022 the most devastating seasonal floods in a decade. As a result, resources shifted temporarily from military spending to rebuilding infrastructure damaged or destroyed by the floods.
Rising government debt is increasingly concerning in Nigeria as debt repayment in 2022 consumed roughly 80 per cent of the country’s total government revenue. The need to fund military and non-military spending has coincided with slow economic growth and high inflation. The country has increasingly resorted to debt to cover its spending gaps.
Despite the fall in spending of the five largest African military spenders, some countries had substantial spending increases. Ethiopia’s military spending rose by the fastest rate of any African country, up 88 per cent to $1.0 billion in 2022. The increase coincided with a government offensive against the Tigrayan People’s Liberation Front (TPLF). Notwithstanding the intensified hostilities, there was hope that the two-year civil war would end after the Ethiopian government and the TPLF signed a peace agreement on 2 November 2022.
Americas
Military spending by countries in the Americas totalled $961 billion in 2022, 0.3 per cent higher than in 2021 and up by 3.5 per cent from 2013. North American countries (i.e. the U.S.A and Canada) accounted for 94 per cent of total regional spending in 2021 (for the description of US spending, see above and also in section IV), with 4.8 per cent in South America, and 1.2 per cent in Central America and the Caribbean.
Military spending in Central America and the Caribbean totaled $11.2 billion in 2022, marking a 6.2 per cent decrease compared to 2021, but a 38 per cent increase from 2013. The subregion accounts for only 0.5 per cent of the world’s total military expenditure. The use of military forces to curb armed criminal activity was the main driver of military spending in the region.
Mexico is the largest spender in Central America and the Caribbean, with $8.5 billion followed by the Dominican Republic ($761 million) and Honduras ($478 million). The 16 per cent increase in the Dominican Republic expenditure in 2022 was related to border tensions with Haiti. The escalating political instability, gang violence, economic and humanitarian crisis in Haiti have raised concerns in the Dominican Republic, leading to investments in operational, procurement spending, and even the construction of a wall on the border between the two countries in 2022 to hinder the flow of drugs, weapons, contraband, and migrants.
Combined military spending for South American countries in 2022 was $46.1 billion, a decrease of 6.1 per cent compared to 2021 and down 5.4 per cent compared to 2013. Most of the countries in the subregion decreased their military budgets in 2022. At $2.6 billion Argentina’s military expenditure fell by 32 per cent in 2022, this coincided with record levels of inflation, poor economic performance, and a political crisis involving corruption allegations and the attempted assassination of the vice president Cristina Kirchner.
Brazil, the biggest spender in the South America, also experienced a decrease in military expenditure in 2022, with a reduction of 7.9 per cent. Despite the close ties between President Jair Bolsonaro and the military sector, the period 2019-22 were marked by a decline in total military spending. However, there was variation in spending type, and Bolsonaro’s search for military support is reflected in the amount spent on personnel and the consignment of positions in the executive branch for military personnel. Since its implementation, spending on personnel rose from 72 per cent in 2019 to 78 per cent of total military expenditure in 2022. The shift in the composition of Brazilian military spending illustrates the relationship between politicians and the military (Hunter and Vega, 2021). Where to gain the support of the military, Bolsonaro expanded the military’s role in government and state positions.
Asia and Oceania
The combined military expenditure in Asia and Oceania was $575 billion in 2022, an increase of 2.7 per cent from 2021 and up 45 per cent from 2013. This continued an uninterrupted upward trend dating back to at least 1989, the earliest year for which SIPRI has an estimate for regional military spending. The regional increase in 2022 was due primarily to China, India and Japan, which collectively accounted for 73 per cent of total regional spending in 2022. The regional growth over the last decade has been driven by two interrelated and mutually reinforcing factors: the rising tensions and threat perceptions particularly in East Asia and South Asia, and the pursuit of military modernisation and self-reliance by major military powers in the region.
In East Asia, military spending by South Korea and Japan grew by 37 per cent and 18 per cent between 2013 and 2022 to $46.3 billion and $46.0 billion respectively, mainly driven by perceived threat from China and North Korea. Notably, Japan is currently undergoing a significant shift in its military policy. It has abandoned its post-World War II era cap on military spending of 1 per cent of GDP and aims to increase the country’s security spending to 2 per cent of GDP by 2027.
Likewise, geopolitical tensions in South Asia are driving the military spending growth of India and Pakistan. In 2022, India increased its military spending by 6.0 per cent to $81.4 billion, representing a 47 per cent increase from 2013 amid border disputes with China and Pakistan. Pakistan’s military spending in 2022 was $10.3 billion, 46 per cent higher than in 2013. Both countries are prioritizing self-reliance in arms development and production, with India earmarking 68 per cent of its capital outlays budget for procurement from domestic arms producers in 2022.
Among smaller spenders in the region, economic circumstances were the predominant factor driving changes in military spending (Ball et al. Citation2021). Sri Lanka, for example, reduced its military spending by 31 per cent in 2022 to $1.1 billion due to a severe economic crisis and inflation rate of 48 per cent. Similarly, the nine countries in Southeast Asia with available data saw a 4.0 per cent decrease in military spending in 2022, bringing the total to $43.1 billion. This decline has been ongoing since 2020, primarily due to the economic consequences of the COVID-19 pandemic.
In 2022 total military expenditure in Oceania totalled $35.3 billion, 0.5 per cent more than in 2021. Spending rose by 48 per cent over the decade 2013-22. The four countries that make up spending in the subregion are Australia, Fiji, New Zealand and Papua New Guinea.
Europe
Total military spending in Europe in 2022 amounted to $480 billion, 13 per cent higher than in 2021, marking a 38 per cent increase from 2013. The Russian invasion of Ukraine in February 2022 was undoubtedly the main driver of the high year-on-year military expenditure increase in the region.
In Central and Western Europe, military spending increased by 3.6 per cent year-on-year to reach $345 billion, 30 per cent more than its lowest point in 2014 and the highest level since the end of the cold war. The recent upwards trend in subregional spending reflects how countries view their security situation in relation to Russia. Security through deterrence and military strength has been the political narrative since Russia’s illegal annexation of Crimea. The subregional and country observations (see below), reinforce the agreed-upon hypothesis in the determinants of military expenditure literature that strategic factors such as proximity or actions of an ‘enemy’ has a positive and significant effect on the level of military spending (George and Sandler Citation2018; Albalate, Bel, and Elias Citation2012).
Throughout the decade 2013-2022, the most acute increases in Central and Western European military expenditure have been recorded in proximity with Russia and Ukraine, ranging from the 29 per cent increase in Finland to the 353 per cent spike in Lithuania. At $1.7 billion, Lithuania’s military spending in 2022 reached its highest point to date, 27 per cent more than in 2021. The increase in Lithuanian military spending was implemented through two supplementary budgets, increasing the amount of money the Ministry of Finance was authorized to borrow to fulfil its burden-sharing obligations NATO. In fact, at 2.5 per cent of GDP, Lithuania reached the threshold agreed upon by NATO members for the fifth consecutive year.
In 2022, Finnish military expenditure reached $4.8 billion, an increase of 36 per cent compared to 2021 and the second-highest increase in Central and Western Europe after Luxembourg. The 2021-22 increase was the highest since 1963. The country shares a 1300 km border with Russia, and the decision to allocate extra funding to military expenditure came after the invasion of Ukraine that was viewed to have ‘fundamentally change[d] Finland’s security environment’. Procurement accounted for roughly a third of the total appropriation, and the country envisages $1.8 billion in additional procurement over the next four years, focusing on anti-tank and anti-aircraft weapons, air and sea defence systems, and artillery rounds. In April 2023, Finland became the 31st NATO member, formally ending the policy of non-alignment. Finland’s military burden in 2022, prior to joining NATO, reached 1.7 per cent of GDP, up from 1.3 per cent in 2021.
Poland was another example where spending on its military shifted substantially in the past 10 years. At $16.6 billion, Polish military spending is at an all-time high, up by 11 per cent since 2021 and 95 per cent since 2013. In the immediate aftermath of the Russian invasion, NATO members are increasingly considering the 2 per cent of GDP commitment as a floor instead of a ceiling. On average, Poland has matched the requirement since the commitment was restated in 2014. In 2022, Poland’s military burden reached 2.4 per cent, the highest since 1993 and the third highest in Central and Western Europe, after Greece and Lithuania. According to a legislation passed in March 2022, the goal for 2023 is 4 per cent of GDP.
One piece of literature that has gained prominence in recent years has been the work on burden sharing in NATO (Sandler and Shimizu Citation2014). As European NATO members announce spending increases that are tied to economic output, these developments will have a substantial impact on the burden-sharing literature (Kivimäki Citation2019). Any existing imbalance between US and European allied contributions may be expected to decline in the coming years.
One new development to the SIPRI military expenditure database is the inclusion of the European Union (EU) as a military spender entity. The military spending of the EU is based on payments from the European Defence Fund (EDF). In July 2022, the European Defence Fund (EDF), the instrument established by the European Commission to foster research and development (R&D) collaboration among companies across EU member states, announced the results of its 2021 call for proposals, with $1.3 billion being split among 61 projects. Awarded in 2022, this sum is added to the total military expenditure of the region for the year, effectively making the EU the 25th largest military spender in Central and Western Europe.
In the subregion Eastern Europe, military spending rose by a substantial 58 per cent to $135 billion in 2022. This upsurge was almost entirely because of Russia’s invasion of Ukraine (see above), which drove military spending upward in both countries. Russia accounted for 64 per cent of the subregional total and Ukraine for 33 per cent.
Middle East
Estimated military expenditure in the Middle East reached $184 billion in 2022. This is 3.2 per cent higher than in 2021 but still 1.5 per cent lower than in 2013. Saudi Arabia’s increase in military spending was the main factor pushing regional spending upwards in 2022.
Saudi Arabia is the largest military spender in the region and the fifth largest in the world. In 2022, Saudi Arabia’s military spending grew by 16 per cent to reach an estimated $75.0 billion. The eight-year long war in Yemen, where Saudi Arabia leads a military coalition against the Houthi, worsened again in 2022. This comes after a moment of negotiations in early 2022. A nationwide ceasefire between the Houthis and the coalition forces – the first in many years – created a momentary improvement for peace prospects. However, after being renewed a few times, the ceasefire fell apart in late 2022. An intensification of missile and air strikes by both sides ensued.
Saudi Arabia’s military expenditure has been very volatile over the decade. The increase in 2022 was the first since 2018, and spending has been on an overall downward trend since the start of the country’s involvement in the conflict in Yemen, in 2015: spending fell by 23 per cent between 2015 and 2022. Both the decline since 2015 and the 2022 rise can be at least partly attributed to variations in oil prices in the international market. This link is well established in the literature. Perlo-Freeman and Brauner (Citation2012), for instance, have found a strong link between oil revenues and military spending. Al-Malawi (Citation2015) and Ali and Abdellatif (Citation2015) have found similar results for the Middle East.
One common feature among Middle Eastern countries is the high ratio between military spending and the economy. Six of the ten largest military burdens are in the Middle East: Saudi Arabia (7.4 per cent), Qatar (7.0 per cent), Oman (5.2 per cent), Jordan (4.8 per cent), Israel (4.5 per cent) and Kuwait (4.5 per cent). One of the explanations for such concentration is the role played by political institutions (Lopes da Silva, Citation2022). Research has found a strong association between large military burdens and autocratic regimes (Brauner Citation2012, Citation2015; Töngür, Hsu, and Elveren Citation2015). Middle Eastern countries seem to match these findings: with the exception of Israel, all countries in the Middle East with large military burdens are closed autocracies (Lührmann, Tannenberg, and Lindberg Citation2018).
The Effects of the War in Ukraine on Military Spending and Military Aid to Ukraine
The Impact of the War in Ukraine on Central and Western European Military Expenditure
A consequence of Russia’s invasion of Ukraine was rising military expenditure by countries in Western and Central Europe. The reaction by countries to increase their spending is central to the determinants of military expenditure literature. Apart from economic capacity, threat perception is commonly discussed in the literature as having a significant driving factor in military expenditure (Hauenstein, Smith, and Souva Citation2021; Zielinski, Fordham, and Schilde Citation2017).
In the case of the war in Ukraine, the full-scale invasion by Russia in February 2022 certainly affected military spending decisions in 2022, but concerns about Russian aggression have been building for much longer. Many countries in Central and Western Europe were concerned about the threat of Russia since it annexed Crimea in 2014. Military spending was already rising in many of the former Eastern Bloc states since 2014 and Russia’s actions in 2022 pushed these rising perceptions even higher.
In the immediate aftermath of Russia’s invasion, Central and Western European countries were quick to announce plans to increase military spending. The announced increases in military spending, albeit oriented towards the same goal, differed in terms of their targeted increase, timelines and status.
Timeline-wise, some of the announced increases took place in 2022 while the majority were planned for the medium term. Lithuania is an example of an immediate reaction to increase its military spending. In March 2022, Lithuania’s parliament was quick to unanimously approve a proposal to increase 2022 military spending to 2.5 per cent of GDP. As a result, military spending rose 15 per cent in 2022 compared to 2021. Denmark and Sweden are examples of a medium-term response. Despite both countries increasing their military spending in 2022, Denmark only plans to increase its spending to 2 per cent of GDP by 2033 and Sweden by 2026.
Aside from the timeline, another distinction between the various pledges are the targets. Following Russia’s annexation of Crimea in 2014, NATO set 2 per cent of GDP as the guideline for the military spending of its members.Footnote3 Several countries have thus chosen to formulate their expenditure goals to increase their military burden, and at least 12 Central and West European countries have tagged their military spending to economic output. However, there are variations in the size of the targeted burdens.
Austria, a non-NATO member plans to increase spending to only 1 per cent of its GDP. In contrast, Poland, a NATO member and one of Ukraine’s staunchest allies amid the war, intends to raise its military burden to 4 per cent of its GDP in 2023, with the ultimate goal of eventually reaching 5 per cent. In contrast, Portugal’s military burden fell by 0.2 percentage points to 1.4 per cent in 2022. In total, only eight Central and West European countries had a military burden of 2 per cent of GDP or more in 2022. Of the Central and West European countries that announced an increase in military spending in 2022, Greece had the highest military burden (3.7 per cent of GDP), while Ireland had the lowest (0.2 per cent).
Despite the numerous announcements, not all countries increased their military spending in 2022. As a matter of fact, military expenditure fell in several Central and Western European countries, of which Bosnia and Herzegovina had the largest, an 11 per cent drop. There are two reasons for the variation in spending changes. Firstly, most countries that had falling spending in 2022 pledged to increase their spending, but with longer time frames or later starting dates. For example, while Austria, Croatia and Slovenia all had falling military spending in 2022, these countries had plans to increase spending starting in 2023.
Secondly, soaring inflation also explains the differences in military spending changes in the subregion. In 2022 inflation among advanced economies reached its highest rate in 40 years. Countries in the eurozone, for example, endured 10 per cent inflation. This led to large differences between changes in military spending in constant prices (i.e. in real terms) and in current prices: the gap between the two figures shows the extent of the impact of inflation (see ). The average gap was nearly 11 percentage points, but the gap extended to more than 20 percentage points in extreme cases of Estonia and Lithuania.
Figure 4. Difference between relative changes in military expenditure in current and constant values in Central and Western Europe, 2022.
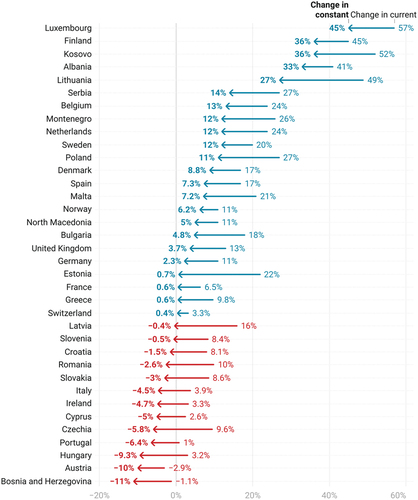
For several countries (see ), military spending fell or increased marginally in real terms despite spending significantly more in nominal terms. For example, the UK’s military spending in 2022 rose by 13 per cent in current prices, but high inflation meant that in real-terms spending only rose by 3.7 per cent. In Czechia, despite a supplementary budget to increase military spending, inflation of 16 per cent reduced a 9.6 per cent nominal increase to a 5.8 per cent real decrease.
Financial Value of Military Aid to Ukraine, 2022
One major development in 2022 was the amount of military assistance that countries around the world sent Ukraine. The estimated value of military aid differs substantially between countries, but the total financial value of military aid given to Ukraine in 2022 reached into the tens of billions of US dollars and was the biggest international military aid effort given to a single country in a single year.
In counting military spending, SIPRI includes the financial value of the military aid in the spending estimates of the donor country and not the beneficiary country. The amount of military aid included by SIPRI may differ from country-specific announcements. Whereas country announcements are often based on the estimate value of the military stock donated, these have already been paid for by the donor country when it acquired the weapons. If the estimated value of the given military stock was added to the donors military spending, this would be double counting. Instead, SIPRI includes in its military aid figures the replacement costs of the military equipment stocks donated. In addition, SIPRI’s estimate of the financial value of the military aid includes financial contributions, training and operational costs and payments to procure additional military equipment for the Ukrainian armed forces.
Based on available figures for the biggest donors and announced figures for other assistance funds, SIPRI estimates that financial military aid to Ukraine totalled at least $30 billion in 2022. Military aid was given to Ukraine in numerous forms (see below) and from at least 25 countries, of which the three largest contributors were the U.S.A, the UK and Germany.
The U.S.A allocated $19.9 billion worth of military aid to Ukraine in 2022. US military aid to Ukraine in 2022 has mostly been channelled through supplemental appropriations to the budgets of the DoD and DoS. The three main assistance programmes through which military aid was disbursed to Ukraine in 2022 were the Presidential Drawdown Authority (PDA), the Ukraine Security Assistance Initiative (USAI) and Foreign Military Finance (FMF). A fourth and much smaller category was International Military Education and Training (IMET).
Of the four assistance programmes the US used to aid Ukraine, the PDA was the biggest. Under the 1961 Foreign Assistance Act, the US president has the authority, via a PDA, to direct the Secretary of State to transfer ‘defense articles and defense services’ from existing stocks to a foreign country without approval from Congress. In 2022, President Biden directed 27 PDAs to Ukraine with estimated equipment values ranging from $100 to $1 billion. SIPRI only includes the replacement cost of the US stocks sent to Ukraine via the PDA. Official figures put the replacement costs of the PDA to $12.6 billion in 2022, 63 per cent of the total $19.9 billion US military aid given to Ukraine.
The second largest military assistance programme the US used to support Ukraine was the USAI. Unlike the PDAs, under the USAI, the US government procures military equipment from the arms industry. Moreover, while PDA is designed to boost Ukraine’s military capability immediately, USAI is generally much slower with the purpose to strengthen the capabilities of the Ukrainian armed forces over the long term. In 2022, both the replacement costs of the PDA and USAI were funded through supplemental appropriations to the budgets of the DoD.
Foreign military finance (FMF) was the third largest category through which the US sent military assistance to Ukraine. Unlike the PDA and USAI, FMF falls under the budget of the DoS. In 2022, FMF to Ukraine was $1.3 billion. IMET support to Ukraine, also funded via the DoS, amounted to only $3 million in 2022.
As the second and third largest military aid donors to Ukraine, the UK and Germany spent an estimated $2.5 billion and $2.0 billion, respectively. In the case of the UK, military aid mainly was through bilateral financial aid and multinational assistance funds such as the UK-led, International Fund for Ukraine (IFU). The IFU is akin to USAI in design such that donor money would be used to purchase and transport military equipment to Ukraine from countries or industry. For Germany, the estimated $2.0 billion includes contributions to the European Peace Facility (EPF) (see below), bilateral financial assistance and procurement of military equipment for Ukraine from industry.
When the Ukrainian government called on the international community to provide military aid, the European Union (EU) reacted by coordinating military assistance to Ukraine through the European Peace Facility (EPF). Created in 2021, the purpose of the EPF was for the EU to provide financial, technical, or material aid to its partner countries to prevent conflicts, build peace, and strengthen international security. Since Russia’s full-scale invasion of Ukraine, the EPF has been one of the EU’s main ways to direct military aid to Ukraine. In 2022, EPF funds earmarked for Ukraine amounted to $3.2 billion which have been used, similar to the PDA, to reimburse part of the cost sustained by EU member states that provided military equipment to the Ukrainian Armed Forces. EU member states directly finance the EPF in proportions determined by their gross national income (GNI).
Other countries outside the EU to have provided military aid to Ukraine include Australia, Canada, New Zealand and Norway. While the US, UK and Germany have dwarfed some of the contributions by these smaller states, the combination of support has proved vital to boost the military capability of the Ukraine Armed Forces. SIPRI’s estimate of the financial value of the military aid to Ukraine indicates the sheer level of military effort sustained by Ukraine over 2022.
Conclusion
Military expenditure has increased substantially in 2022, up for the eighth straight year to the highest level ever recorded. The increase took place in four of the world’s five regions, with only spending in Africa falling. World military spending is highly concentrated with the 15 biggest spenders accounting for 82 per cent of world spending. Thus, spending changes by the largest spenders have a large impact on the trend of world spending. The increased spending by Russia and Ukraine; Central and Western European countries’ spending response to Russia’s invasion of Ukraine; and the spending rises in Asia led by China, India and Japan were the main contributors to the 2022 rise in world military spending. The special section highlighted the immediate response by Central and Western European countries to Russia’s invasion of Ukraine and showed that despite common willingness to increase spending, there can be substantial differences between countries in the goals and timelines. Finally, solidarity with Ukraine by many European and non-European countries was showcased in the levels of military aid donated in 2022. The US, UK and Germany were the three largest contributors for the military aid Ukraine received.
The developments in military spending in 2022 has some important linkages to the military expenditure literature. For example, the response by Central and Western European countries to Russia’s invasion is directly related to research questions in the determinants of military spending literature. In the case of the Nigeria and the U.S.A spending developments are associated with research on the funding of military spending, with specific links to debt. For countries in the Middle East, research questions of interest have to do with the role of institutions and political regime on military burden and the correlation between military spending and oil revenues.
Finally, an interesting future research question is to specifically look at the use of taxation, the main source of government revenue, to fund military spending. As countries increasingly consider the use of tax to finance military spending, this has important economic and social consequences.
Disclosure statement
No potential conflict of interest was reported by the authors.
Notes
1. For sources and methods of the SIPRI Military Expenditure Database see ‘Sources and methods’, https://www.sipri.org/databases/milex/sources-and-methods.
2. For further details on the definition of SIPRI’s Military Expenditure data see, https://www.sipri.org/databases/milex/sources-and-methods#definition-of-military-expenditure.
3. This was not the first time NATO members agree to allocate military spending to a set level of GDP. In 1977 NATO agreed members agreed on a guideline of 3 per cent of GDP and in 2006, NATO defence ministers agreed on a 2 per cent of GDP target.
References
- Ahmed, H. A., S. Mahmood, and H. Shadmani. 2022. “Defense and Non-Defense Vs Debt: How Does Defense and Non-Defense Government Spending Impact the Dynamics of Federal Government Debt in the United States?” Journal of Government and Economics 7: 100050. https://doi.org/10.1016/j.jge.2022.100050.
- Albalate, D., G. Bel, and F. Elias. 2012. “Institutional Determinants of Military Spending.” Journal of Comparative Economics 40 (2): 279–290. https://doi.org/10.1016/j.jce.2011.12.006.
- Ali, H. E., and O. A. Abdellatif. 2015. “Military Expenditures and Natural Resources: Evidence from Rentier States in the Middle East and North Africa.” Defence and Peace Economics 26 (2): 5–13. https://doi.org/10.1080/10242694.2013.848574.
- Al-Malawi, N. 2015. “Do Natural Resources of Rentier States Promote Military Expenditures? Evidence from GCC Countries.” Journal of Economic & Financial Studies 3 (3): 49–53. https://doi.org/10.18533/jefs.v3i02.103.
- Ball, D., Béraud-Sudreau, L., Huxley, T., Mohan, C. R. “Asia’s New Geopolitics: Military Power and Regional Order .” In: Adelphi Series. Vol. 59. 478–480. Routledge:Abingdon;2021. 71–124.
- Brauner, J. 2012. “Military Spending and Democratisation.” Peace Economics Peace Science and Public Policy 18 (3): 1–17. https://doi.org/10.1515/peps-2012-0003.
- Brauner, J. 2015. “Military Spending and Democracy.” Defence and Peace Economics 26 (4): 409–423. https://doi.org/10.1080/10242694.2014.960245.
- Caruso, R., and M. Di Domizio. 2017. “Military Spending and Budget Deficits: The Impact of US Military Spending on Public Debt in Europe (1988–2013).” Defence and Peace Economics 28 (5): 534–549. https://doi.org/10.1080/10242694.2016.1228259.
- Cooper, J. 1998. “The Military Expenditure of the USSR and the Russian Federation, 1987–97.” SIPRI Yearbook 1999: 243–259.
- Cooper, J., 2022, “Implementation of the Russian Federal Budget During January-July 2022 and Spending on the Military”, SIPRI Background Paper.
- Dimitraki, O., and A. Kartsaklas. 2018. “Sovereign Debt, Deficits and Defence Spending: The Case of Greece.” Defence and Peace Economics 29 (6): 712–727. https://doi.org/10.1080/10242694.2017.1289497.
- George, J., and T. Sandler. 2018. “Demand for Military Spending in NATO, 1968–2015: A Spatial Panel Approach.” European Journal of Political Economy 53: 222–236. https://doi.org/10.1016/j.ejpoleco.2017.09.002.
- Hauenstein, M., M. Smith, and M. Souva. 2021. “Democracy, External Threat and Military Spending.” Research & Politics 8 (4): 1–13. https://doi.org/10.1177/20531680211049660.
- Kivimäki, T. 2019. “Power, Contribution and Dependence in NATO Burden Sharing.” European Security 28 (1): 66–84. https://doi.org/10.1080/09662839.2019.1578750.
- Lopes da Silva D. 2022. “Political Accountability and Military Spending.“ Defence and Peace Economics 1–18. https://doi.org/10.1080/10242694.2022.2129128.
- Lührmann, A., M. Tannenberg, and S. I. Lindberg. 2018. “Regimes of the World (Row): Opening New Avenues for the Comparative Study of Political Regimes.” Politics & Governance 6 (1): 60–77. https://doi.org/10.17645/pag.v6i1.1214.
- Norrlof, C., and W. C. Wohlforth. 2019. “Is US Grand Strategy Self-Defeating? Deep Engagement, Military Spending and Sovereign Debt.” Conflict Management and Peace Science 36 (3): 227–247. https://doi.org/10.1177/0738894216674953.
- Paleologou, S. M. 2013. “A Dynamic Panel Data Model for Analyzing the Relationship Between Military Expenditure and Government Debt in the EU.” Defence and Peace Economics 24 (5): 419–428. https://doi.org/10.1080/10242694.2012.717204.
- Perlo-Freeman, S., and E. Sköns. 2016. “Snakes and Ladders: The Development and Multiple Reconstructions of the Stockholm International Peace Research Institute’s Military Expenditure Data.” The Economics of Peace & Security Journal 11 (2): 5–13. https://doi.org/10.15355/epsj.11.2.5.
- Sandler, T., and H. Shimizu. 2014. “NATO Burden Sharing 1999-2010: An Altered Alliance.” Foreign Policy Analysis 10 (1): 43–60. https://doi.org/10.1111/j.1743-8594.2012.00192.x.
- Tian, N., and F. Su. 2021. A New Estimate of China’s Military Expenditure. SIPRI, Stockholm: January.
- Töngür, Ü., S. Hsu, and A. Y. Elveren. 2015. “Military Expenditures and Political Regimes: Evidence from Global Data, 1963-2000.” Economic Modelling 44: 68–79. https://doi.org/10.1016/j.econmod.2014.10.004.
- Wang, S. 1999. “The Military Expenditure on China, 1989-98.” SIPRI Yearbook 1999 (Appendix 7D). 334–350.
- Wezeman, S. T., 2020, ‘Russia’s Military Spending: Frequently Asked questions’, SIPRI Topical Backgrounder, 27 Apr. 2020. https://www.sipri.org/commentary/topical-backgrounder/2020/russias-military-spending-frequently-asked-questions
- Zielinski, R. C., B. O. Fordham, and K. E. Schilde. 2017. “What Goes Up, Must Come Down? The Asymmetric Effects of Economic Growth and International Threat on Military Spending.” Journal of Peace Research 54 (6): 791–805. https://doi.org/10.1177/0022343317715301.