
Abstract
Objectives: In order to gain an insight into labile plasma iron (LPI) in iron metabolism microenvironment in MDS.
Methods: We performed ELISA, quantitative real-time polymerase chain reaction, flow cytometry, MRI T2* assays to test LPI, iron biochemical parameters, and liver iron concentration (LIC) among 22 MDS patients.
Results: LPI has a statistical difference (P < 0.001 by analysis of variance (ANOVA)), which decreased gradually, among three groups, while no difference was found in adjusted serum ferritin (ASF) (P = 0.086 by ANOVA). After DFO treatment, serum hepcidin expression increased from 301.26 ± 59.78 to 340.33 ± 49.78 µg/l (P = 0.032), while hepcidin/ASF was upregulated gradually from 0.16 ± 0.08 to 0.22 ± 0.03 (P = 0.045). APAF-1 expression (P = 0.047) and erythroid apoptosis rate (P = 0.009) decreased significantly, respectively. No statistical difference was found in EPO (P = 0.247) and GDF15 expression (P = 0.172). LIC dropped from 9.83 ± 4.84 to 6.28 ± 4.01 mg/g dry weight (P < 0.001). No significant difference was found in cardiac T2* (P = 0.594). LPI has a closer connection to LIC than ASF (r = 0.739, P < 0.001 vs. r = 0.321, P = 0.034).
Discussion: LPI seems to be a real-time indicator which reflects body iron loading status instantaneously. Despite the limited knowledge available on LPI speciation in different types and degrees of IO, LPI measurements can be and are in fact used for identifying systemic IO and for initiating/adjusting chelation regimens.
Introduction
Myelodysplastic syndromes (MDS) comprise a heterogeneous group of hematopoietic stem cell malignancies characterized by peripheral cytopenias and have a substantial risk of progression to acute myeloid leukemia.Citation1 The most common form of cytopenia observed in MDS is anemia.Citation2 The majority of patients with MDS require RBC transfusions for management of symptomatic anemia, with high cumulative transfusion needs placing them at risk for development of iron overload.Citation3 Some patients present with anemia become transfusion dependent during the clinical course of the disease.Citation4 The relative risk of iron loading compared with the intrinsic risk of the disease is most pronounced in patients with refractory anemia, refractory anemia with ringed sideroblasts, or lower-risk MDS with isolated chromosome 5q-. In human body, circulating iron is bound to transferrin. When the binding capacity of transferrin is exceeded, nontransferrin-bound iron (NTBI) species appear in the plasma.Citation5 NTBI contributes to the generation of reactive oxygen species (ROS). ROS-induced damage may enhance the apoptotic activity of MDS-derived hematopoietic precursors and induce mitochondrial defects and cytochrome c release, thus triggers the apoptosis combined with apoptotic protease-activating factor 1 (APAF-1) increase.Citation6 Labile plasma iron (LPI) represents the most toxic fraction of NTBI that is both redox active and chelatable.Citation7 Sustained levels of LPI over time may compromise organ function and overall survival.Citation8 Evidence of hematologic improvement in patients with MDS exists with DFO treatment.Citation9 After intensive development work with T2* and R2* sequencing techniques, MRI is now able to fulfill the task as a noninvasive, reliable, and well-tolerated method to diagnose iron overload.Citation10 Here, we performed an observation of LPI, iron biochemical parameters, including serum ferritin (SF), hepcidin, and so on, and MRI T2* of MDS patients, to take a close look at LPI for the duration of DFO treatment.
Materials and methods
Patients
Patients diagnosed with MDS between 2010 and 2014 at the Department of Hematology in the Sixth People's Hospital affiliated to Shanghai Jiaotong University (Shanghai, China) were enrolled in this study. Total 22 MDS patients were included, and written informed consent in accordance with the Declaration of Helsinki was obtained from patients or the next of kin, caretakers, guardians on the behalf of the children participants prior to the study. Patients were categorized according to the 2008 version of the World Health Organization (WHO) Classification of MDS. We defined refractory cytopenia with unilineage dysplasia/refractory anemia with ring sideroblasts/5q- syndrome/refractory cytopenia with multilineage dysplasia as low-risk group (n = 15), while refractory anemia with excess blasts-1/refractory anemia with excess blasts-2 as high-risk group (n = 7), as Table showed. Before DFO treatment, their transfusion requirement is 2.37 ± 1.34 U RBC per month. Patients began DFO treatment when their adjusted serum ferritin (ASF), described below, was over 1000 mg/l and received iron chelation therapy regularly in the next 26 weeks. The iron biochemical parameters were tested at week 0, week 4, and week 26. Only MRI T2* for liver and heart was performed at week 0 and week 26, respectively. Besides DFO treatment, transfusion therapy was used to ameliorate anemia. The study was approved by the Ethics Committee of the Sixth People's Hospital affiliated to Shanghai Jiao Tong University.
Table 1 The basic parameters of MDS patients according to their WHO classification
Laboratory studies and ELISA assay
SF and erythropoietin (EPO) were detected to assess iron overload using standard commercial assays at the clinical laboratory of Shanghai Sixth People's Hospital. Considering inflammation may affect the result of SF, C-reactive protein (CRP) was measured along with SF. They are both acute-phase reactants. CRP served as adjustment for SF. ASF was adopted when CRP was higher than 10.0 mg/l. ASF is defined as SF (mg/l) divided by the log10 of CRP (mg/l). If CRP was equal to or less than 10.0 mg/l, the ASF was simply the SF.Citation11 Except SF, serum hepcidin levels were used to determine iron loading level. Peripheral blood samples collected from enrolled patients were added into non-anticoagulation test tubes for use. After 30 minutes, when blood samples were clotted, a 15-minute centrifugation was performed at 1000g to separate serum. Obtained serum was stored at −20°C in aliquots to avoid repetitive freeze–thaw cycles. Serum hepcidin levels were determined using a commercial ELISA kit following manufacturer's protocol (Cusabio Biotech, China).
LPI assay
LPI was assessed (Aferrix, Tel-Aviv, Israel, using the FeROS assay) at screening. This assay measures the redox activity of iron in serum. A reducing agent (ascorbate) and an oxidizing agent (atmospheric oxygen) cause the labile iron in the tested sample to oscillate between its oxidized (Fe3+) and reduced (Fe2+) form, generating ROS via the Fenton reaction. The ROS are detected by an oxidation-sensitive probe (dihydrorhodamine), which becomes fluorescent when oxidized by ROS. The assay employs a selective iron chelator that blocks redox cycling of iron to specifically identify iron-mediated ROS generation. Comparison of the fluorescence generated in the reaction in the presence and absence of the iron chelator translates into an accurate estimate of the quantity of LPI in the tested sample.
Magnetic separation of CD235a+ cells
Bone marrow mononuclear cells (BMMNCs) were isolated from 7 ml of bone marrow samples with heparin sodium as the anticoagulant; 5 ml for positive selection of CD235a cells and 2 ml for flow cytometry assays. CD235a+ mature erythrocytes and erythroid precursor cells were separated from BMMNCs with magnetic microbeads (Miltenyi Biotec, Bergisch Gladbach, Germany), according to manufacturer's protocol.
Flow cytometry assay for erythroid apoptosis and ROS
To assess the erythroid apoptosis rate, a cell solution at 106/ml was prepared by adding PBS. A total 100 µl of the cell suspension was incubated with PE-conjugated anti-CD235a monoclonal antibody at room temperature away from light for 15 minutes. After incubation, the cells were washed once by PBS. Then, the cells were incubated with 5 µl of FITC-conjugated Annexin V for 10 minutes. Additional staining with 5 µl of 7AAD was performed to discriminate dead and live cells. The cells were analyzed by flow cytometry within half an hour on a FACS Calibur (Becton Dickinson, Franklin Lakes, NJ, USA). All antibodies were purchased from Invitrogen, Carlsbad, CA, USA.
ROS was tested by Reactive Oxygen Species Assay Kit (Beyotime Biotech, Shanghai, China), following manufacturer protocol. DCFH-DA is a fluorescence probe and can be oxidized to DCF by ROS. Then, we measured the mean fluorescence intensity of DCF to test ROS.
Quantitative real-time PCR (RT-PCR) assay
The RNA extracted from CD235a+ cells using RNeazy Mini Kit (QIAGEN, Hilden, Germany) served as the template for all reverse transcriptase reactions. Synthesized cDNA was obtained from 10 µl of RNA via random priming, with the use of RevertAidTM First Strand cDNA Synthesis Kit (Fermentas, Waltham, MA, USA) following the manufacturer's protocol. The polymerase chain reaction (PCR), total 20 µl in volume and includes the following: 2 µl of cDNA solution mixed with 10 µl of SYBR® Premix Ex Taq™II (Takara, Kusatsu, Japan), 0.4 µl for each of forward primers and reverse primers, and 7.2 µl of RNase-free water. A fluorescent quantitation PCR cycler (Roche, Vaud, Switzerland) was used for amplification of APAF-1 and GAPDH with the following primer pairs: APAF-1 forward (for), GTCTGCTGATGGTGCAAGGA; APAF-1 reverse (rev), GATGGCCCGTGTGGATTTC; GDF15 forward (for), GTGTTGCTGGTGCTCTCGTG; GDF15 reverse (rev), CGGTGTTCGAATCTTCCCAG; GAPDH forward (for), GCACCGTCAAGGCTGAGAAC; GAPDH reverse (rev), GTGGTGAAGACGCCAGTGGA. The amplification procedure consisted of three steps: (1) denaturation at 95°C for 5 seconds; (2) annealing at 62°C for 20 seconds; and (3) extension at 72°C for 10 seconds (43 cycles). The threshold cycle (Ct) was subsequently determined. Expression levels of APAF-1 and growth differentiation factor 15 (GDF15) normalized to GAPDH and relative to a calibrator, was expressed as 2−ΔΔCt (fold difference).
MRI T2* assay
The theoretical foundation of MRI T2* is that iron deposition disrupts the homogenous magnetic field and shortens T1 and T2 times in a concentration-dependent manner. All patients underwent MRI examination with a 3.0 T Siemens MRI unit (Siemens, Munich, Germany) at week 0 and week 26, respectively. Cardiac and liver iron levels were measured using a 10–15-second breath-hold multiple-gradient echo T2* sequence. Average T2* values were measured using the region of interest (ROI) in the left ventricle septum and liver parenchyma. Liver ROI were sampled in regions devoid of blood vessels. T2* values were calculated by fitting the data to mono-exponential decay curves. Liver iron concentration (LIC) were calculated using an accepted conversion formula.Citation12 Cardiac T2* < 20 ms or LIC > 2 mg/g is considered as a sign of iron overload.Citation3 Meanwhile, alanine aminotransferase (ALT) and left ventricular ejection fraction (LVEF) were tested to reflect liver and heart function, respectively.
Statistical methods
The statistical analysis was performed using the SPSS 17.0 software (SPSS, Inc., Chicago, IL, USA). Quantitative data were expressed as means ± SD and tested by Student's t-test, paired Student's t-test, or ANOVA. A linear correlation analysis was performed between LPI and LIC, ASF and LIC, LIC and cardiac T2*. P < 0.05 was considered as statistical significant.
Results
LPI and ASF in MDS patients during DFO treatment
Figure shows the change of LPI and ASF in MDS patients in the duration of DFO treatment. LPI has a statistical difference (P < 0.001 by ANOVA), which decreased gradually, among three groups, while no difference was found in ASF (P = 0.086 by ANOVA).
Figure 1 LPI and ASF of MDS patients during DFO treatment. LPI has a statistical difference (P < 0.001 by ANOVA), which decreased gradually, among three groups, while no difference was found in ASF (P = 0.086 by ANOVA)
Iron biochemical parameters and clinical parameters in MDS patients
Table describes iron biochemical parameters in MDS patients. After DFO treatment, serum hepcidin expression was upregulated from 301.26 ± 59.78 to 340.33 ± 49.78 µg/l (P = 0.032), while hepcidin/ASF increased gradually from 0.16 ± 0.08 to 0.22 ± 0.03 (P = 0.045). Along with the decrease of LPI, ROS (P = 0.005), APAF-1 expression (P = 0.047), and erythroid apoptosis rate (P = 0.009) decreased significantly, respectively. No significant difference was found in EPO (P = 0.247) and GDF15 expression (P = 0.172).
RBC transfusions, regarded as a clinical support therapy throughout the study, seem to have no influence on LPI study (P = 0.838) (Table ). We performed MRI T2* assay to test liver and heart iron loading indirectly. LIC dropped from 9.83 ± 4.84 to 6.28 ± 4.01 mg/g dry weight (P < 0.001). No significant difference was found in cardiac T2* (P = 0.594). Although some MDS patients were found an abnormal liver function in our study, there was no difference in ALT (P = 0.379), neither did hemoglobin (Hb) (P = 0.169) nor LVEF (P = 0.856).
Table 2 Iron biochemical parameters in MDS patients
The correlation between LPI and LIC, ASF and LIC, LIC and cardiac T2* in MDS patients
We performed linear regression analysis to evaluate the correlation between LPI and LIC, ASF, and LIC in MDS patients. On week 0 and week 26, we used MRI T2* to test LIC in MDs patients, while their LPI and ASF were tested at the same time. As Fig. shows, LPI has a closer connection to LIC than ASF (r = 0.739, P < 0.001 vs. r = 0.321, P = 0.034). There was no correlation between LIC and cardiac T2* (P = 0.344) (Table ).
Figure 2 The correlation between LPI and LIC, ASF and LIC of MDS patients during DFO treatment. On week 0 and week 26, we used MRI T2* to test LIC in MDs patients, while their LPI and ASF were tested at the same time. We put data together (week 0 + week 26) to perform a linear regression to analyze the correlation between LPI and LIC, ASF and LIC. As Fig. shows, LPI has a closer connection to LIC than ASF (r = 0.739, P < 0.001 vs. r = 0.321, P = 0.034)
Table 3 Clinical parameters in MDS patients
The change of iron loading after DFO treatment
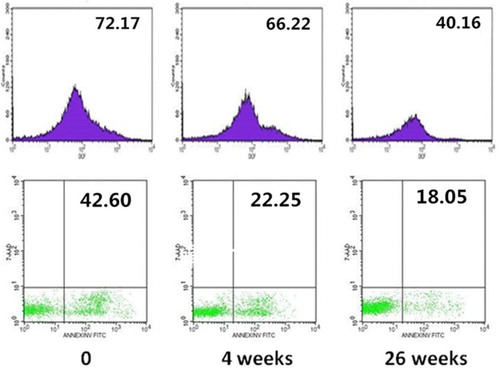
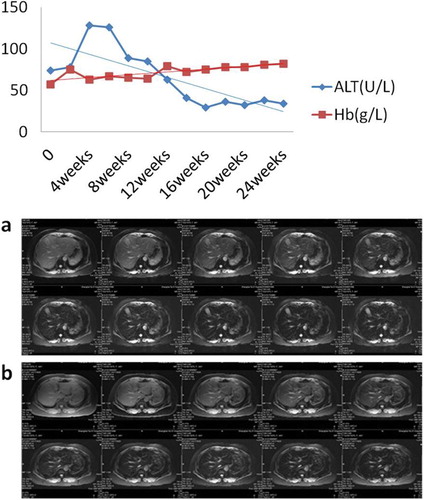
With the decrease of LPI, DCF and erythroid apoptosis rate both reduced. Figure shows the changes of one patient's DCF and erythroid apoptosis rate, whose DCF decreased from 72.17 to 40.16 and erythroid apoptosis rate from 42.60 to 18.05%. Before DFO treatment, a patient had an abnormal liver function. Along with iron chelation therapy, his LPI decreased rapidly. Meanwhile, his ALT dropped and his hemoglobin increased gradually. Furthermore, his LIC decreased from 9.97 on week 0 to 5.81 mg/g dry weight on week 26 after receiving DFO treatment.
Figure 3 DCF and erythroid apoptosis rate of MDS patients during DFO treatment. With the decrease of LPI, DCF and erythroid apoptosis rate both reduced. Figure shows the changes of one patient's DCF and erythroid apoptosis rate, whose DCF decreases from 72.17 to 40.16 and erythroid apoptosis rate from 42.60 to 18.05%
Discussion
Organ complications arising in transfusion-dependent patients with MDS may derive in part from direct toxicities of parenchymal iron, but also from chronic exposure to NTBI accumulating after saturation of iron storage capacity. NTBI encompasses all forms of serum iron that are not associated with transferrin. LPI represents the most toxic fraction of NTBI that is both redox active and chelatable. Iron chelators such as DFO can decrease LPI that is sustained only for the duration of plasma drug exposure.Citation13 In our study, we performed assays to test LPI, iron biochemical parameters and MRI T2* among 22 MDS patients to gain an insight into LPI in iron metabolism microenvironment in MDS.
While increased intestinal iron absorption contributes to iron overload in MDS, it is not the main cause, as indicated by SF levels at diagnosis and prior to the start of transfusion therapy, which are usually around 400 mg/l and rarely exceed 1000 mg/l.Citation14 Instead, the most important cause of iron overload in MDS is chronic RBC transfusion therapy. As SF levels can be increased not just by iron overload but also by inflammation, we used CRP to adjust SF to minimize the influence of inflammation on SF.Citation11 After DFO treatment, LPI decreased gradually and had a statistical difference among three groups, while no difference was found in ASF. Compared with LPI, SF is one of the forms of iron store. There is no doubt that LPI, as a representative of toxic labile iron, is more sensitive to iron chelation therapy and decreases immediately. It could be used to assess the efficacy of iron chelation.
Serum hepcidin increased from 301.26 ± 59.78 to 340.33 ± 49.78 µg/l, while hepcidin/ASF was upregulated gradually, suggesting a dominant curative effect of DFO on improving iron metabolism and relieving iron loading in MDS patients. ROS, APAF-1 expression and erythroid apoptosis rate all reduced after receiving DFO treatment. No statistical difference was found in EPO and GDF15 expression. For an instance, with the decrease of LPI, an MDS patient's DCF decreased from 72.17 to 40.16 and erythroid apoptosis rate from 42.60 to 18.05%. Meanwhile, he had an abnormal liver function. His ALT dropped and his Hb increased gradually. Furthermore, the LIC decreased from 9.97 on week 0 to 5.81 mg/g dry weight on week 26 after receiving DFO treatment. These observations indicate a substantial clinical benefit can potentially be derived from the detoxification of NTBI. Accordingly, measurements of LPI at diagnosis and during follow-up may be helpful in assessing the duration and intensity of exposure to redox-active plasma iron, which in turn may correlate with the iron metabolism microenvironment.
We performed MRI T2* assay to test liver and heart iron loading indirectly (Table ). LIC dropped from 9.83 ± 4.84mg/g dry weight to 6.28 ± 4.01mg/g dry weight (P < 0.001), while no difference was found during ALT, Hb and LVEF. On the contrary to the decrease of LPI and LIC, Hb rose slowly indicating a hematological improvement after DFO treatment. Then, we performed linear regression analysis to evaluate the correlation between LPI and LIC, ASF and LIC in MDS patients. On week 0 and week 26, we used MRI T2* to test LIC in MDS patients, while their LPI and ASF were tested at the same time. LPI has a much tighter correlation with body iron accumulation rather than SF does (r = 0.739, P < 0.001 vs. r = 0.321, P = 0.034). Liver biopsy is still the gold standard for diagnosis of hepatic iron overload so far. Based upon solid study, nowadays, MRI T2* has become an invasive and practical method to assess myocardial and liver rion.Citation15,Citation16 It can be concluded that LPI may reflect not only iron metabolism microenvironment, but also organ iron loading. But, whether we can evaluate iron overload in MDS by only a certain parameter, like SF or LPI, or a group of parameters needs to be further demonstrated. For the moment, LPI seems to be an early mark or an instant parameter for predicting hematopoietic improvement. Wood and colleagues demonstrated that myocardial damage sufficient to impair LVEF occurs at tissue iron concentrations more than 2 mg/g dry weight of tissue. By comparison, hepatic iron concentrations more than 22 mg/g dry weight are associated with the development of fibrosis and cirrhosis.Citation17 Therefore, cardiac dysfunction may occur at lower tissue iron concentrations than liver dysfunction.Citation18 In our study, however, we found that all of the patients had a LIC > 2 mg/g, while cardiac T2* < 20 ms only occurred in three of them. It has been proved that high LIC values predict an increased risk of myocardial iron deposition in unchelated patients,Citation19,Citation20 but once chelation therapy has been initiated, this simple relationship no longer exists because iron is cleared faster from the liver than from the heart.Citation21,Citation22 Nevertheless, no statistical correlation between LIC and cardiac T2* was found. Considering liver is available and key to human metabolism, we just hypothesize that it is likely to accumulate iron in liver earlier than in heart.
We find that some patients who only receive transfusion and iron chelation therapy tend to have a hematologic improvement whose hemoglobin increased gradually (Fig. ). The exact mechanism of hematologic response to iron chelators is unknown. We think after DFO treatment, the decrease of LPI ameliorating iron loading somehow is one of the mechanisms. On the other hand, interestingly, although LPI had a dominant decrease after DFO treatment, it was found in some patients that erythroid apoptosis rate did not decline either, or even increased. Whether the chelation therapy is invalid to them? Actually, iron overload in MDS starts even before patients become transfusion dependent, in part because disease-associated ineffective erythropoiesis suppresses hepcidin production in the liver.Citation23 GDF15, a transforming growth factor-β superfamily member is secreted by maturing erythroblasts in the bone marrow.Citation24 In MDS, GDF15 levels are much less elevated than in thalassemia, and hepcidin levels are more variable.Citation25 GDF15 expression in patients whose erythroid apoptosis rate did not decrease along with LPI was superior to the others. Meanwhile, EPO concentration was much higher, too. It has been demonstrated that hypoxia may induce EPO generation and causes GDF15 expression increase,Citation26 suggesting that besides iron overload, excessive ineffective erythropoiesis can also lead to erythroid apoptosis. In this sense, LPI is limited to reflect ineffective erythropoiesis to some degree.
Figure 4 The improvement of ALT, hemoglobin, and LIC. Before DFO treatment, a patient had an abnormal liver function. Along with iron chelation therapy, his LPI decreased rapidly. Meanwhile, his ALT dropped and his hemoglobin increased gradually. Furthermore, his LIC decreased after receiving DFO treatment. Lane a: LIC was 9.97 mg/g dry weight on week 0. Lane b: LIC was 5.81 mg/g dry weight on week 26
Above all, LPI may not only be an accessible diagnostic marker of iron overload and cell toxicity but also a clinical parameter that could be used to assess the efficacy of iron chelation. We hope that treatment decision and monitoring will be supported by LPI measurements. Measuring the toxic forms of iron in plasma and cells at diagnosis and follow-up, preferentially in parallel with iron biochemical parameters, oxidative stress parameters, and correlating the results with clinical complications of iron overload, with and without iron chelation therapy, will enable a more comprehensive and meaningful assessment of iron overload.
Disclaimer statements
Contributors None.
Funding None.
Conflicts of interest None.
Ethics approval The study was approved by the Ethics Committee of the Sixth People's Hospital affiliated to Shanghai Jiao Tong University.
Acknowledgments
The FeROS assay used to test LPI was gifted by Aferrix, Tel-Aviv, Israel. We are grateful for their generous help.
References
- Tefferi A, Vardiman JW. Myelodysplastic syndromes. N Engl J Med. 2009;361(19):1872–85. doi: 10.1056/NEJMra0902908
- Malcovati L, Della Porta MG, Laarakkers CM, Galli A, Albertini R, Maffioli M, et al. Erythroid activity, transfusion iron overload, and hepcidin levels in patients with myelodysplastic syndrome. Blood 2008;112(11): 2676a (ASH annual meeting abstracts).
- Gattermann N, Rachmilewitz EA. Iron overload in MDS—pathophysiology, diagnosis, and complications. Ann Hematol. 2011;90(1):1–10. doi: 10.1007/s00277-010-1091-1
- Ambaglio I, Malcovati L, Papaemmanuil E, Laarakkers CM, Della Porta MG, Galli A, et al. Inappropriately low hepcidin levels in patients with myelodysplastic syndrome carrying a somatic mutation of SF3B1. Haematologica 2013;98(3):420–3. doi: 10.3324/haematol.2012.077446
- Hershko C, Graham G, Bates GW, Rachmilewitz E. Non-specific serum iron in thalassaemia: an abnormal serum iron fraction of potential toxicity. Br J Haematol. 1978;40(2):255–63. doi: 10.1111/j.1365-2141.1978.tb03662.x
- Farquhar MJ, Bowen DT. Oxidative stress and the myelodysplastic syndromes. Int J Hematol. 2003;77(4):342–50. doi: 10.1007/BF02982641
- Kohgo Y, Ikuta K, Ohtake T, Torimoto Y, Kato J. Body iron metabolism and pathophysiology of iron overload. Int J Hematol. 2008;88(1):7–15. doi: 10.1007/s12185-008-0120-5
- Cabantchik ZI, Breuer W, Zanninelli G, Cianciulli P. LPI-labile plasma iron in iron overload. Best Pract Res Clin Haematol. 2005;18(2):277–87. doi: 10.1016/j.beha.2004.10.003
- Jensen PD, Jensen IM, Ellegaard J. Desferrioxamine treatment reduces blood transfusion requirements in patients with myelodysplastic syndrome. Br J Haematol. 1992;80(1):121–4. doi: 10.1111/j.1365-2141.1992.tb06411.x
- St. Pierre TG, Clark PR, Chua-anusorn W, Fleming AJ, Jeffrey GP, Olynyk JK, et al. Non-invasive measurement and imaging of liver iron concentrations using proton magnetic resonance. Blood 2005;105(2):855–61. doi: 10.1182/blood-2004-01-0177
- Armand P, Kim H, Rhodes J, Sainvil M-M, Cutler C, Ho VT, et al. Iron overload in patients with acute leukemia or MDS undergoing myeloablative stem cell transplantation. Biol Blood Marrow Transplant. 2011;17(6):852–60. doi: 10.1016/j.bbmt.2010.09.006
- Ghoti H, Rachmilewitz EA, Simon-Lopez R, Gaber R, Katzir Z, Konen E, et al. Evidence for tissue iron overload in long-term hemodialysis patients and the impact of withdrawing parenteral iron. Eur J Haematol. 2012;89(1):87–93. doi: 10.1111/j.1600-0609.2012.01783.x
- Porter JB, Abeysinghe RD, Marshall L, Hider RC, Singh S. Kinetics of removal and reappearance of nontransferrin-bound plasma iron with deferoxamine therapy. Blood 1996;88(2):705–13.
- Gattermann N. Clinical consequences of iron overload in myelodysplastic syndromes and treatment with chelators. Hematol Oncol Clin North Am. 2005;19(Suppl. 1):13–17.
- Fragasso A, Ciancio A, Mannarella C, Gaudiano C, Scarciolla O, Ottonello C, et al. Myocardial iron overload assessed by magnetic resonance imaging (MRI)T2* in multi-transfused patients with thalassemia and acquired anemias. Eur J Intern Med. 2011;22(1):62–65. doi: 10.1016/j.ejim.2010.10.005
- Cheng HL, Holowka S, Moineddin R, Odame I. Liver iron overload assessment by T2* magnetic resonance imaging in pediatric patients: an accuracy and reproducibility study. Am J Hematol. 2012;87(4):435–7. doi: 10.1002/ajh.23114
- Bassett ML, Halliday JW, Powell LW. Value of hepatic iron measurements in early hemochromatosis and determination of the critical iron level associated with fibrosis. Hepatology 1986;6(1):24–29. doi: 10.1002/hep.1840060106
- Wood JC, Otto-Duessel M, Aguilar M, Nick H, Nelson MD, Coates TD, et al. Cardiac iron determines cardiac T2*, T2, and T1 in the gerbil model of iron cardiomyopathy. Circulation 2005;112(4):535–43. doi: 10.1161/CIRCULATIONAHA.104.504415
- Buja LM, Roberts WC. Iron in the heart. Etiology and clinical significance. Am J Med. 1971;51(2):209–21. doi: 10.1016/0002-9343(71)90240-3
- Schafer AI, Cheron RG, Dluhy R, Cooper B, Gleason RE, Soeldner JS. Clinical consequences of acquired transfusional iron overload in adults. N Engl J Med. 1981;304(6):319–24. doi: 10.1056/NEJM198102053040603
- Anderson LJ, Holden S, Davis B, Prescott E, Charrier CC, Bunce NH, et al. Cardiovascular T2-star (T2*) magnetic resonance for the early diagnosis of myocardial iron overload. Eur Heart J. 2001;22(23):2171–9. doi: 10.1053/euhj.2001.2822
- Anderson LJ, Westwood MA, Holden S, Davis B, Prescott E, Wonke B. Myocardial iron clearance during reversal of siderotic cardiomyopathy with intravenous desferrioxamine: a prospective study using T2* cardiovascular magnetic resonance. Br J Haematol. 2004;127(3):348–55. doi: 10.1111/j.1365-2141.2004.05202.x
- Cortelezzi A, Cattaneo C, Cristiani S, Duca L, Sarina B, Deliliers GL. Non-transferrin-bound iron in myelodysplastic syndromes: a marker of ineffective erythropoiesis? Hematol J. 2000;1(3):153–8. doi: 10.1038/sj.thj.6200028
- Tanno T, Bhanu NV, Oneal PA, Goh S-H, Staker P, Lee YT. High levels of GDF15 in thalassemia suppress expression of the iron regulatory protein hepcidin. Nat Med. 2007;13(9):1096–101. doi: 10.1038/nm1629
- Santini V, Girelli D, Sanna A, Martinelli N, Duca L, Campostrini N, et al. Hepcidin levels and their determinants in different types of myelodysplastic syndromes. PLoS One 2011;6(8):e23109. doi: 10.1371/journal.pone.0023109
- Tanno T, Noel P, Miller JL. Growth differentiation factor 15 in erythroid health and disease. Curr Opin Hematol. 2010;17(3):184–90.