
ABSTRACT
Purpose: To extract feature ego-modules and pathways in childhood acute lymphoblastic leukemia (ALL) resistant to prednisolone treatment, and further to explore the mechanisms behind prednisolone resistance.
Materials and methods: EgoNet algorithm was used to identify candidate ego-network modules, mainly via constructing differential co-expression network (DCN); selecting ego genes; collecting ego-network modules; refining candidate modules. Afterwards, statistical significance was calculated for these candidate modules. Biological functions of differential ego-network modules were identified using Reactome database. To verify this proposed method can lead to truly positive findings in clinical settings, support vector machine (SVM) was utilized to compute the AUC values for each significant pathway using 3-fold cross-validation method. To predict the reliability of our findings, another established method (attract) was used to identify the differential attractor modules using the same microarray profile.
Results: After eliminating the modules with classification accuracy < 0.9 and node number < 15, only ego-network module 30 was eligible. After significance calculation, module 30 was significant. Module 30 was enriched in APC/C-mediated degradation of cell cycle proteins. The AUC for the significant pathway of APC/C-mediated degradation of cell cycle proteins was 0.915. Although the attract method obtained more modules, the module identified by our proposed method owned more gene nodes, and had more classification ability (AUC = 0.915).
Conclusion: One differential ego-network module identified in childhood ALL resistance to prednisolone based on DCN and EgoNet, might be helpful to reveal the mechanisms underlying prednisolone resistance in childhood ALL.
1. Background
Acute lymphoblastic leukemia (ALL), as an acute form of leukemia, or cancer of the white blood cells, is characterized by the accumulation and overproduction of cancerous, immature white blood cells [Citation1]. Of note, ALL is most common childhood cancer, with a peak incidence at 2–5 years old [Citation1]. Treatment of childhood ALL includes the application of several classes of chemotherapeutic drugs, such as glucocorticoids and anthracyclines. Prednisolone, as a glucocorticoid, can diffuse passively into the cell. In the treatment of pediatric ALL, prednisolone is used as the spearhead agent, because of its ability to inhibit cell cycle progression and induce apoptosis in ALL cells [Citation2,Citation3]. Over the past four decades, enormous improvements have been achieved in ALL treatment with successful disease-free survival rates of about 80%. Although the significant successful survival rate, the remaining 20% of ALL patients still show treatment failure during or after completion of contemporary treatment protocols for newly diagnosed pediatric ALL [Citation4]. In addition, several surviving patients frequently present toxicity [Citation5]. Notably, relapsed ALL patients often obtain prednisolone resistance [Citation6]. Significantly, resistance towards prednisolone is closely related with worse prognosis in pediatric ALL. Thus, therapeutic intervention to conquer prednisolone resistance is urgent. Nevertheless, up to now, the molecular mechanisms behind prednisolone resistance in childhood ALL is still poorly defined.
Recently, several studies have documented that gene expression profiles can identify treatment-specific changes in ALL cells [Citation7,Citation8]. Using gene expression profiles, Holleman et al. [Citation9] have identified several biomarkers predictive of outcome in ALL patients, and these biomarkers are associated with the resistance or sensitivity to chemotherapeutic agents, for example, prednisolone and daunorubicin. The gene profile of GSE19143 offered by Stam et al. [Citation10] have identified differentially expressed genes (DEGs) from ALL samples either resistant or sensitive to prednisolone. Using microarray data of GSE19143, Sarang et al. [Citation11] have investigated the altered expression of autophagy-related genes which might contribute to glucocorticoid-resistant phenotype in glucocorticoid-sensitive and glucocorticoid-resistant ALL cells. However, these studies only focus on the individual genes. In the current analysis, complementally, EgoNet strategy [Citation12] was utilized to trace the dysfunctional ego-network modules associated with the resistance of prednisolone.
Thus, in our study, with the goal of investigating the gene expression pattern that might result in prednisolone resistance in more detail, EgoNet was used to extract feature ego-modules and pathways in childhood ALL resistant to prednisolone treatment. Specifically, ego-network modules were derived the origin from ego genes in the network based on snowball sampling, and pathway enrichment analysis of differential modules was also carried out. Candidate modules and pathways identified by this novel method might provide the groundwork for a therapy for childhood ALL.
2. Materials and methods
2.1. Data pre-processing
Gene expression profile, recruited from the GPL96 platform of Affymetrix Human Genome U133A Array, for 52 children diagnosed with ALL either sensitive (27 patients with LC50 values <0.1 lg/ml prednisolone) or resistant (25 patients with LC50 values >150 lg/ml prednisolone) to in vitro prednisolone treatment were downloaded from Gene Expression Omnibus repository (accession no. GSE19143).
For quality control, we first preprocess the gene expression data of GSE19143 prior to analysis. In detail, the annotation data in TXT format was employed to map the association between probes and genes. Next, RMA [Citation13] was used to implement background adjustment, and quantiles were employed to carry our normalization [Citation14]. Then, PM/MM correction was implemented through Microarray Suite (MAS) [Citation15], following by summarization of the expression measures via median polish. Eventually, the probe sets were mapped to gene symbols. After that, an expression profile including 12 442 genes was obtained.
2.2. Protein–protein interactions data
Protein–protein interactions (PPIs) are very important for understanding the biological processes. Thus, compiling PPI networks provides a valuable framework for a better understanding of the protein function. In the current study, the original PPI network involved in 787 896 interactions (16 730 genes) was downloaded from STRING database [Citation16]. Then, the common interactions between the original PPI network and microarray data were extracted. Finally, a new PPI network was obtained, which included 41 244 interactions and 6722 genes.
2.3. Identification of ego-network modules
In order to identify the candidate modules, EgoNet method was applied. This approach included the following four key steps: construction of differential co-expression network (DCN); selection of ego genes; collecting ego-network modules; and refinement of candidate modules.
2.3.1. Construction of DCN
First, the absolute value of Pearson correlation coefficient (PCC) was computed between the interactions of gene i and gene j. The interactions whose absolute value of PCC were higher than the pre-defined threshold δ (δ = 0.8) were picked out to build the co-expression network.
Second, we used one-side t-test to calculate p values of each gene expression between the two groups. Based on the p values, we assigned the weight values to the edges in the binary co-expression network.
2.3.2. Selection of ego genes
In this section, we used a function g(s) to calculate the importance of node s in the DCN. The function g(s) was shown as follows:
In which, g(s) was the importance of node s in the DCN, Nk(s) was on behalf of the neighbors of gene s; was the degree normalized weighted adjacency matrix; and D stood for diagonal matrix. For each gene, g(s) = z-score was obtained, and the genes were sorted according to z-score. The top 5% ranked genes with degree >1 were identified as the ego genes.
2.3.3. Collecting ego-network modules
This step was carried out with the help of ego genes. Taking each ego gene as the initial node, the ego-network module stage exhaustively sought all genes x whose inclusion could cause the maximum increase of the classification accuracy till there was no increase. Regarding a given ego gene x ∈ X, we treated it as an ego-network module C = {x}. For each vertex y in its neighborhood in the network, N(x) was defined as UiNi(x), where Ni(x) was the neighbor set as the candidate for ego-network module C. For each y ∈ N(x), a new ego-network module C' = C{y}. The classification accuracy increase between C' and C was calculated based on the formula △S (C', C) = S(C)-S(C').
When △S (C', C) was greater than 0, which suggested the inclusion of gene y enhanced the categorizing accuracy of the ego-network module C. If so, the gene y was added to ego-network C. If there were more than one node which were contained at each stage, we randomly selected one. We would stopped this spreading stage if the classification accuracy dropped. As known, the above process of growing ego-network module was snowball sampling [Citation17].
2.3.4. Refinement of candidate modules
In this step, we removed the ego-networks with classification accuracy smaller than 0.9. Moreover, the ego-networks with gene size <15 were also eliminated.
2.4. Estimating statistical significance of modules
Based on the null distribution of classification accuracy generated by random permutation test, we calculated the statistical significance of ego-network modules. With the goal of obtaining the null distribution, randomized permutation test on the same ego-network modules was implemented for 1000 times. Based on the null distribution, the p value of an ego-network module was calculated as the probability of the candidate ego-network module having the smaller classification accuracy value. Next, Benjamini and Hochberg method [Citation18] was utilized to correct p values. In our study, false discovery rate (FDR) of 0.01 was set as the significance criteria.
2.5. Functional profiling
In order to gain insight into the biological processes of the given ego-network modules, the biological functions of differential ego-network modules were identified relying on Reactome pathway databases. In the current analysis, we recruited all reference pathways in human from Reactome database. Then, the common genes of each reference pathway and the new PPI network were extracted. Next, several informative pathways were selected for subsequent analysis when the pathways with less than 5 genes or more than 100 genes were removed. Afterwards, genes of differential ego-network modules were mapped to each informative pathway to identify the pathways enriched by each differential ego-network module. Statistically, significant enrichment of module genes within terms was determined by Fisher’s exact test adjusted by Benjamini–Hochberg method for multiple testing. In our paper, pathways with an FDR <0.01 were defined as the pathways enriched by a given module. Subsequently, the pathways of each differential ego-network module were sorted based on FDR values, and the pathway having the smallest FDR was considered as the significant pathway for a given ego-network module.
2.6. Validation test
Through the literature, area under the curve (AUC) is an available index which is frequently employed to assess the predictive ability of machine learners [Citation19]. In order to verify that this proposed method can lead to truly positive findings in clinical settings, support vector machine (SVM) was utilized to compute the AUC values for each significant pathway using threefold cross-validation method. The AUC of 1.0 devotes a perfect classification ability, and the AUC value >0.7 is regarded good [Citation20].
2.7 Comparison to other established method (attract method)
To predict the reliability of our findings, another established method (attract) was used to identify the differential attractor modules using the same microarray profile. Specific steps were described in the study provided by Wang et al. [Citation21]. Then, pathway analysis was conducted for the genes in the attractor modules based on FDR < 0.01.
3. Results
3.1. A framework for detection of ego-network modules
Taking the PPI network and microarray profile as input, EgoNet repeatedly sought all genes with two or more neighbors in the network. An ego-network module is a part of a network which refers to a particular gene, and we call this ego gene. In addition to the ego gene, the network also includes a neighborhood containing all nodes to which the ego is connected to at a certain path length. Starting with every ego gene as initial node, the score of the level-one ego-network module was calculated based on classification accuracy. Then, it spread outward from the ego gene progressively to include more genes in the predictive model. This process quitted when the classification accuracy reduced. We defined this procedure of growing ego-network as snowball sampling. Afterwards, the significance was assessed by randomized permutation test. This algorithm mainly included four steps: DCN construction, ego genes selection, ego-network modules identification via snowball sampling, as well as refinement of ego-network modules.
3.2. Construction of DCN
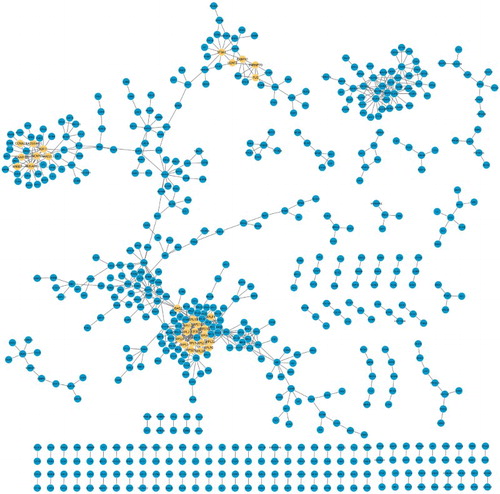
In an attempt to construct the DCN, edges were picked out according to the absolute value of the PCC of the expression profiles of two genes. Totally, 605 genes (845 edges) were selected to construct the DCN when δ was greater than 0.8. The composition of the DCN was shown in . However, this DCN was so big that the composition of the DCN was not seen clearly. Thus, we have provided the specific content in form of Excel (Supplementary Table 1), where genes and interactions were included.
Figure 1. The composition of DCN which included 245 nodes and 845 interactions. Yellow nodes stood for the ego genes.
3.3. Identification of ego-network modules
According to the z-score distribution of each node in DCN, a total of 30 ego genes were identified, as shown in . Among these ego genes, the top five were respective RPS16 (z-score = 28.853), NUSAP1 (z-score = 26.205), KIF11 (z-score = 24.456), RPL27 (z-score = 24.248), and NCAPG (z-score = 23.984).
Table 1. The 30 ego genes extracted from the DCN and their z-scores.
Next, starting with every ego gene, we progressively grew the ego-network modules by levels on the basis of the classification accuracy increase △S (C', C). Based on △S (C', C) > 0, a total of 30 ego-network modules were screened out and the mean gene size in an ego-network module was 7. After eliminating the modules with classification accuracy <0.9 and the number of nodes <15, we observed that only module 30 was remained.
3.4. Evaluating the significance of candidate ego-network modules
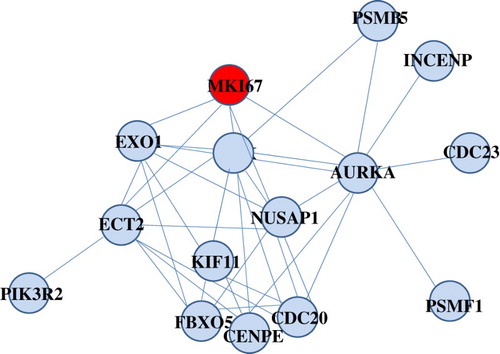
After random permutation test with 1000 times, we found that the ego-network module 30 was significant with FDR = 0. In order to better display the properties of this module, we presented the composition of the ego-network module 30, shown in .
Figure 2. Composition of differential ego-network module 30 identified in the childhood ALL resistant to prednisolone treatment. Yellow node was ego gene.
3.5. Functional profiling and validation test
With the goal of better understanding of the module functions, we performed the pathway enrichment analysis based on the Reactome database to extract cellular functions specifically enriched by these differential ego-network modules. A set of pathways were selected for the given module 30 using a threshold FDR of 0.01. For this given module, we only selected the pathway with the smallest FDR as the statistically enriched pathway of a given module. Thus, we found that the genes of module 30 were enriched in the pathway of APC/C-mediated degradation of cell cycle proteins (FDR = 1.84E-09).
In order to assess the classification performance, we then used SVM to compute the AUC values for each significant pathway using threefold cross-validation method. Based on the results, we found the AUC score for the significant pathway of APC/C-mediated degradation of cell cycle proteins was 0.915, which further demonstrated that this method actually could lead to truly positive findings in clinical settings.
3.6. Comparison to other established method (attract method)
In order to prove the reliability of our results, we subsequently used attract method to identify the differential attractor modules. Based on FDR < 0.05, only two modules were identified to be differential (11 nodes in Module 1, 8 nodes in Module 2). The composition of these two attractor modules and pathways enriched by the module genes are shown in . Although the attract method obtained more modules, the module identified by our proposed method owned more gene nodes, and had more classification ability (AUC = 0.915).
Table 2. Composition of the two attractor modules and pathways enriched by the module genes.
4. Discussion
Although the advances have made in ALL treatment, about 20% of patients still experience a relapse and death [Citation22]. Glucocorticoids resistance has been recognized to be a feature of poor prognosis in the treatment of childhood ALL. However, taking consideration of the importance of prednisolone in ALL treatment, it is profound that identifying discriminating biomarkers possibly associated with ALL treatment outcome, particularly those that could better explain the molecular mechanisms behind drug resistance [Citation23,Citation24]. Currently, as a relatively unbiased approach, genome-wide analysis of gene expression in human ALL cells is used to extract gene determinants of drug resistance [Citation9,Citation25]. However, many of the previous studies have focused on the identification of a set of signatures of DEGs [Citation9,Citation26,Citation27]. Moreover, many of the gene signatures obtained from different researches on the same disease are frequently inconsistent [Citation28]. Thus, to overcome this difficulty, network-based approaches are potentially more effective to evaluate the disease-related biomarkers because it addresses the organization of networks of pairwise biological interactions, instead of the individual gene [Citation29,Citation30]. Unfortunately, if a network is too big, a certain amount of important genes and interactions are neglected [Citation31]. Identification of modules or sub-networks from the intricate network can avoid this problem [Citation30,Citation32]. Many approaches have been created to seek modules by jointly analyzing network data with gene expression profiles. For example, Vert and Kanehisa [Citation33] utilized kernel methods to screen out the expression patterns which characterize gene sets matching pathways in a given network. Nevertheless, some hidden genes showing no difference by themselves but clustered in a module are often overlooked. Excitedly, a novel method called EgoNet [Citation12] can identify significant modules and the hidden genes in this module whose genes are highly predictive of the disease condition.
In our study, we also used this EgoNet strategy to trace the dysfunctional ego-network modules which might be associated with the resistance of prednisolone. There were 605 nodes in DCN, and among these nodes, 30 were ego genes. Selection of differential ego-network modules was expanded on DCN and the corresponding ego genes via EgoNet algorithm. After significance calculation, we found that only module 30 was significant with FDR = 0. Pathway analysis inhibited that dysregulation of the APC/C-mediated degradation of cell cycle proteins might stand for the key in resistance or sensitivity to prednisolone. Based on the AUC results, we found the AUC score for the significant pathway of APC/C-mediated degradation of cell cycle proteins was 0.915, which further demonstrated that this method actually could lead to truly positive findings in clinical settings.
As reported, the glucocorticoids prednisolone exerts a key function in therapy protocols, since it has the ability to block cell cycle progression in ALL cells [Citation34]. Drug-resistance genes involved in cell cycle progression have been related with the prognosis of ALL [Citation35]. Theoretically, prednisolone can diffuse passively into the cell via binding the glucocorticoid receptor (GR). Generally, GR is defined as a cytosolic receptor, while Gametchua et al. [Citation36] described a membrane-bound variant (mGR). The overexpression of mGR has been observed in the period of S-G2/M stage, when the cells are sensitive to the glucocorticoids-induced apoptosis [Citation37]. MIB-1, as the marker of chemotherapy resistance, is also known as the marker of proliferation Ki-67 (MKI67). Of note, MKI 67 involved in cell cycle regulation was up-regulated in ALL [Citation38]. In the current study, MKI67 was the ego gene in the differential ego-network module 30, and this module was enriched in the pathway of APC/C-mediated degradation of cell cycle proteins. In light of these, we infer that targeting cell-cycle-related pathway might represent a promising possibility in the treatment of prednisolone-resistant childhood ALL.
5. Conclusion
To summarize, we have successfully extracted one differential ego-network module in childhood ALL resistance to prednisolone based on DCN and EgoNet algorithm, this module might be helpful to reveal the molecular mechanisms underlying prednisolone resistance and give insight for future research of childhood ALL. Targeting cell-cycle-related pathway might represent a promising possibility in the treatment of prednisolone-resistant childhood ALL.
Supplemental_-_Table_1.xlsx
Download MS Excel (22.5 KB)Disclosure statement
No potential conflict of interest was reported by the authors.
Related Research Data
References
- Seiter K, Sarkodee-Adoo C, Talavera F, et al. Acute lymphoblastic leukemia. Sarkodee-Adoo C, Talavera F, Sacher RA and Besa EC: Medscape Reference. WebMD. Accessed 17, 2014.
- Kaspers G, Pieters R, Van Zantwijk C, et al. Prednisolone resistance in childhood acute lymphoblastic leukemia: vitro-vivo correlations and cross-resistance to other drugs. Blood. 1998;92:259–266.
- Ploner C, Schmidt S, Presul E, et al. Glucocorticoid-induced apoptosis and glucocorticoid resistance in acute lymphoblastic leukemia. J Steroid Biochem Mol Biol. 2005;93:153–160. doi: 10.1016/j.jsbmb.2004.12.017
- Pui C-H, Carroll WL, Meshinchi S, et al. Biology, risk stratification, and therapy of pediatric acute leukemias: an update. J Clin Oncol. 2011;29:551–565. doi: 10.1200/JCO.2010.30.7405
- Evans WE, Relling MV. Moving towards individualized medicine with pharmacogenomics. Nature. 2004;429:464–468. doi: 10.1038/nature02626
- Klumper E, Pieters R, Veerman A, et al. In vitro cellular drug resistance in children with relapsed/refractory acute lymphoblastic leukemia. Blood. 1995;86:3861–3868.
- Yeoh E-J, Ross ME, Shurtleff SA, et al. Classification, subtype discovery, and prediction of outcome in pediatric acute lymphoblastic leukemia by gene expression profiling. Cancer Cell. 2002;1:133–143. doi: 10.1016/S1535-6108(02)00032-6
- Flohr T, Schrauder A, Cazzaniga G, et al. Minimal residual disease-directed risk stratification using real-time quantitative PCR analysis of immunoglobulin and T-cell receptor gene rearrangements in the international multicenter trial AIEOP-BFM ALL 2000 for childhood acute lymphoblastic leukemia. Leukemia. 2008;22:771–782. doi: 10.1038/leu.2008.5
- Holleman A, Cheok MH, den Boer ML, et al. Gene-expression patterns in drug-resistant acute lymphoblastic leukemia cells and response to treatment. N Engl J Med. 2004;351:533–542. doi: 10.1056/NEJMoa033513
- Stam RW, Den Boer ML, Schneider P, et al. Association of high-level MCL-1 expression with in vitro and in vivo prednisone resistance in MLL-rearranged infant acute lymphoblastic leukemia. Blood. 2010;115:1018–1025. doi: 10.1182/blood-2009-02-205963
- Sarang Z, Gyurina K, Scholtz B, et al. Altered expression of autophagy-related genes might contribute to glucocorticoid resistance in precursor B-cell-type acute lymphoblastic leukemia. Eur J Haematol. 2016;97:453–460. doi: 10.1111/ejh.12753
- Yang R, Bai Y, Qin Z, et al. Egonet: identification of human disease ego-network modules. BMC Genomics. 2014;15:1. doi: 10.1186/1471-2164-15-S11-I1
- Irizarry RA, Hobbs B, Collin F, et al. Exploration, normalization, and summaries of high density oligonucleotide array probe level data. Biostatistics. 2003;4:249–264. doi: 10.1093/biostatistics/4.2.249
- Bolstad BM, Irizarry RA, Astrand M, et al. A comparison of normalization methods for high density oligonucleotide array data based on variance and bias. Bioinformatics. 2003;19:185–193. doi: 10.1093/bioinformatics/19.2.185
- Pepper SD, Saunders EK, Edwards LE, et al. The utility of MAS5 expression summary and detection call algorithms. BMC Bioinformatics. 2007;8:273. doi: 10.1186/1471-2105-8-273
- Franceschini A, Szklarczyk D, Frankild S, et al. STRING v9.1: protein-protein interaction networks, with increased coverage and integration. Nucleic Acids Res. 2013;41:D808–D815. doi: 10.1093/nar/gks1094
- Goodman LA. Snowball sampling. Ann Math Stat. 1961;32:148–170. doi: 10.1214/aoms/1177705148
- Benjamini Y, Hochberg Y. Controlling the false discovery rate: a practical and powerful approach to multiple testing. J R Stat Soc Ser B (Methodol). 1995;57:289–300.
- Huang J, Ling CX. Using AUC and accuracy in evaluating learning algorithms. IEEE Trans Knowl Data Eng. 2005;17:299–310. doi: 10.1109/TKDE.2005.50
- Gillis J, Pavlidis P. The role of indirect connections in gene networks in predicting function. Bioinformatics. 2011;27:1860–1866. doi: 10.1093/bioinformatics/btr288
- Wang J, Cheng J, Zhang C, et al. Cardioprotection effects of Sevoflurane by regulating the pathway of neuroactive ligand-receptor interaction in patients undergoing coronary artery bypass graft surgery. Comput Math Methods Med. 2017;2017:1–7. Article ID: 3618213.
- Pui C-H, Relling MV, Downing JR. Acute lymphoblastic leukemia. N Engl J Med. 2004;350:1535–1548. doi: 10.1056/NEJMra023001
- Bhojwani D, Kang H, Menezes RX, et al. Gene expression signatures predictive of early response and outcome in high-risk childhood acute lymphoblastic leukemia: a children’s Oncology Group Study. J Clin Oncol. 2008;26:4376–4384. doi: 10.1200/JCO.2007.14.4519
- Conter V, Bartram CR, Valsecchi MG, et al. Molecular response to treatment redefines all prognostic factors in children and adolescents with B-cell precursor acute lymphoblastic leukemia: results in 3184 patients of the AIEOP-BFM ALL 2000 study. Blood. 2010;115:3206–3214. doi: 10.1182/blood-2009-10-248146
- Cheok MH, Yang W, Pui C-H, et al. Treatment-specific changes in gene expression discriminate in vivo drug response in human leukemia cells. Nat Genet. 2003;34:85–90. doi: 10.1038/ng1151
- Hogan LE, Meyer JA, Yang J, et al. Integrated genomic analysis of relapsed childhood acute lymphoblastic leukemia reveals therapeutic strategies. Blood. 2011;118:5218–5226. doi: 10.1182/blood-2011-04-345595
- Silveira VS, Scrideli CA, Moreno DA, et al. Gene expression pattern contributing to prognostic factors in childhood acute lymphoblastic leukemia. Leuk Lymphoma. 2013;54:310–314. doi: 10.3109/10428194.2012.710330
- Ganguly A, Shields CL. Differential gene expression profile of retinoblastoma compared to normal retina; 2010.
- He D, Liu Z-P, Honda M, et al. Coexpression network analysis in chronic hepatitis B and C hepatic lesions reveals distinct patterns of disease progression to hepatocellular carcinoma. J Mol Cell Biol. 2012;4:140–152. doi: 10.1093/jmcb/mjs011
- Liu Z-P, Wang Y, Zhang X-S, et al. Network-based analysis of complex diseases. IET Syst Biol. 2012;6:22–33. doi: 10.1049/iet-syb.2010.0052
- Nibbe RK, Chowdhury SA, Koyutürk M, et al. Protein–protein interaction networks and subnetworks in the biology of disease. Wiley Interdiscip Rev Syst Biol Med. 2011;3:357–367. doi: 10.1002/wsbm.121
- Wu Y, Jing R, Jiang L, et al. Combination use of protein–protein interaction network topological features improves the predictive scores of deleterious non-synonymous single-nucleotide polymorphisms. Amino Acids. 2014;46:2025–2035. doi: 10.1007/s00726-014-1760-9
- Vert JP, Kanehisa M. Extracting active pathways from gene expression data. Bioinformatics. 2003;19(Suppl. 2):ii238–ii244.
- Tissing W, Meijerink J, den Boer M, et al. Molecular determinants of glucocorticoid sensitivity and resistance in acute lymphoblastic leukemia. Leukemia. 2003;17:17–25. doi: 10.1038/sj.leu.2402733
- Van den Heuvel-Eibrink M, Sonneveld P, Pieters R. The prognostic significance of membrane transport-associated multidrug resistance (MDR) proteins in leukemia. Int J Clin Pharmacol Ther. 2000;38:94–111. doi: 10.5414/CPP38094
- Gametchua B, Chen F, Sackey F, et al. Plasma membrane-resident glucocorticoid receptors in rodent lymphoma and human leukemia models. Steroids. 1999;64:107–119. doi: 10.1016/S0039-128X(98)00097-X
- Sackey F, Watson CS, Gametchu B. Cell cycle regulation of membrane glucocorticoid receptor in CCRF-CEM human ALL cells: correlation to apoptosis. Am J Physiol Endocrinol Metab. 1997;273:E571–E583.
- Messina M, Chiaretti S, Iacobucci I, et al. AID expression in BCR/ABL positive ALL is associated with a peculiar gene expression profile and deregulation of DNA repair and replication genes. Haematologica-The Hematology Journal Ferrata Storti Foundation via Giuseppe Belli 4, 27100 Pavia, Italy; 2009. p. 249.