
ABSTRACT
Objectives: Leukemia is a group of bone marrow cancers and drug resistance is one of the challenges in treatment. Caffeic acid phenethyl ester’s (CAPE’s) anti-proliferative and apoptotic properties have been reported in leukemia cell lines. However, CAPE’s effect on drug resistance and cellular metabolism is still unknown. Thus, in this study, we aimed to explore CAPE’s effect on drug resistance and oxidative phosphorylation (oxphos).
Methods: Leukemia cell lines NB-4, HL-60, and K562 were treated with CAPE. ATP-based cell viability assay was used. For gene expression studies, RNAs were isolated and reverse transcribed. To investigate CAPE’s effect on mitochondrial dysfunction in AML cell lines, we examined oxygen consumption rates (OCRs) in our cell lines.
Results: We found 5 μM CAPE sensitized all cell lines to cytarabine. This similar effect was also observed in the Decitabine-resistant K562 cell line. However, no difference was seen in MDR1 expression upon CAPE treatment in all cell lines. OCR significantly decreased upon CAPE treatment in all cell lines, while the expression of key regulatory glycolytic enzymes increased in K562 and NB-4 cell lines. Expression of STAT3 also changed upon CAPE treatment.
Discussion: Our results suggested that CAPE alters cellular metabolism by decreasing oxphos and increasing glycolysis in K562 and NB-4 cells. Furthermore, CAPE treatment altered STAT3 expression regarding alterations in oxphos and aerobic glycolysis.
Conclusion: Our results suggest a new property of CAPE, which is oxphos repression, and a presumptive link between altered metabolism and drug resistance.
Introduction
Leukemia is a group of bone marrow cancers characterized by increased proliferation and abnormal differentiation of myeloid or lymphoid progenitor cells [Citation1]. In addition to chromosomal aberrations, data gleaned from next-generation sequencing provided a wide spectrum and frequency of mutations and distinct patterns of epigenetic modifications in leukemia subtypes [Citation2,Citation3]. Current therapy regimens include the use of DNA synthesis inhibitor cytarabine (Ara-C), hypomethylating agents Decitabine and Azacytidine, and application of allogeneic hematopoietic cell transplantation [Citation4]. Acute myeloid leukemia (AML) is a subtype of leukemia and it is curable in 40% of adult patients at 60 years old or younger with the recent advances in the treatment; however, remission ratio is lowered to 5–15% in elderly patients [Citation5]. Therefore, there is still a need to research for new therapeutics to increase the long-term survival for both younger and elderly patients. Drug resistance in leukemia treatment is a common phenomenon as in other cancer types. Many oncogenic-driven mutations have been linked to multiple drug resistance in leukemia subtypes [Citation6,Citation7]. A well-characterized drug resistance mechanism is the increased expression of ABC ATP-binding cassette (ABC) drug transporters in cancer cells [Citation8].
Although metabolic abnormalities were recognized many years ago by the discovery of increased glycolysis in cancer cells even in the presence of O2 (aerobic glycolysis), cancer cell metabolism has recently emerged as a ‘hallmark of cancer’ [Citation9,Citation10]. There has been an increased interest to identify rewired metabolic pathways in cancer cells. Altered metabolic pathways in cancer cells are now considered to develop targeted therapies for improvement in cancer therapeutics. Another exciting question that arises from the recent literature is whether rewired metabolic pathways were related to drug resistance in cancer therapy and could these pathways be targeted effectively [Citation11].
Caffeic acid phenethyl ester (CAPE) is an active derivative of a honeybee product propolis. CAPE’s anti-proliferative, anti-metastatic, and apoptotic properties have been widely investigated in cancer cells [Citation12–14]. Previous studies showed that CAPE preferentially targets cancer cells [Citation15]. CAPE with its known biological features stands as a promising anti-cancer drug. Although CAPE’s mechanism of action is not crystal clear, several studies suggested it disrupts mitochondrial function by altering membrane potential and reactive oxygen species (ROS) level [Citation16,Citation17]. However, CAPE’s effect on oxidative phosphorylation (oxphos) is still unknown.
In this study, we aimed to investigate whether CAPE has any effect on drug resistance in leukemia cells. After finding that CAPE decreases drug resistance in leukemic cell lines, we explored whether this decrease could be related to altered metabolism in cells. For this purpose, we controlled the effect of CAPE on oxphos and glycolysis.
Materials and methods
Cell culture and drug treatments
HL-60, NB-4, and K562 leukemia cells lines were grown in RPMI 1640 medium with 1% l-glutamine, 1% penicillin/streptomycin, 10% fetal bovine serum (FBS) at 37°C, in 5% CO2 humidified atmospheric air.
All drugs used for the study were suspended in DMSO. 5-aza-2-deoxycytidine (Decitabine, Sigma), 5-azacytidine (Videza, Sigma), cytarabine (Ara-C) (Alexan, Sandoz) were added to cultures at desired concentrations every 24 hours during the experiment as they have short half-lives. Cells were treated with CAPE (Sigma) at the desired concentrations and cultured for 3 days for IC50 experiments except combined drug treatment experiments, which were cultured for 96 hours. Dose-dependent drug experiments were designed according to the literature search [Citation13,Citation16,Citation18,Citation19]. Drug doses that kill almost or less than 50% of cells were used for combined drug experiments as the experiments take 3 days.
Cell viability assay – ATP measurements
ATP measurement was performed using the Cell TiterGlo Luminescence Assay (Promega) according to the protocol provided by the manufacturer. Cells were cultured in white-walled 96-well plates at 25 × 103 cells/ml concentration with or without CAPE in four replicates. 40 μl of Cell TiterGlo reagent were added into each well at the end of the experiment and plates were shaken at 300 rpm for 5 minutes on a shaker. Luminescence was read on a luminometer (Molecular Devices, Spectra Max). The fold change in the luminescence that was read for each condition was normalized to untreated wells (no treatment = 1).
Flow cytometric analysis of MDR1 (CD243) expression and function
3 × 10⁵ cells in RPMI 1640 medium with or without 5 μM CAPE were plated into a 6-well plate and cultured for 72 hours. At the end of the experiment the cells were washed and counted. 1 × 10⁶ cells were stained with 20 μl CD243-PE antibody (BD BioSciences) for 20 minutes at RT. For negative control, the IgG-PE isotype (BD BioSciences) was used. MDR1 expression was evaluated on a BD Accuri flow cytometry system. MDR1 function was assessed with Rhodamine 123 efflux assay as previously described [Citation20]. Briefly, 200 ng/ml Rhodamine dye added to the culture medium in the presence or absence of 5 μM CAPE. After 1 hour of incubation, cells were washed and seeded in dye-free medium with or without CAPE and cultured for 90 minutes at 37°C. Life-gate was based in the light scatter parameter after staining with propidium iodide.
qRT-PCR
3 × 10⁵ cells were plated into each well of a 6-well plate in duplicate. Cells were treated with 5 μM CAPE for 72 hours. RNA was isolated from cultures using an RNeasy Mini kit (Qiagen) according to the manufacturer’s protocol. RNA concentrations were measured on NanoDrop (ThermoScientific). 1 μg of total RNA was used for each cDNA reaction with Quantitect Reverse Transcription kit (Qiagen). qRT-PCR analysis of gene expression was performed on a Light Cycler 480 system (Roche) using a Quantitect SYBR Green PCR kit (Qiagen).
All primers used in the study are listed in and designed using Primer3 software.
Table 1. Primers used in qRT-PCR.
Results were normalized to RPL0 gene expression level and calculated using the ΔΔCt method.
Oxygen consumption assay
Oxygen consumption of cell lines was measured using the fluorescence-based Extracellular Oxygen Consumption kit (Abcam) according to the manufacturer’s protocol except for the NB-4 cell line. NB-4 cells were plated at a concentration of 3 × 10⁶ cells/ml instead of 4 × 10⁶ cells/ml. Cells were plated in duplicate and experiments performed three times for each cell line. Cells were treated with 5 μM CAPE. For positive and negative controls of oxygen consumption level, 1 μM electron transport chain (ETC) uncoupler agent FCCP (carbonyl cyanide 4-(trifluoromethoxy)phenylhydrazone, (Abcam) and 1 μM oligomycin (ATP synthase inhibitor) (Abcam) (0.75 μM for NB-4) were used. FCCP and oligomycin concentrations were determined with a preliminary cell proliferation experiment. Fluorescence levels were measured on a molecular devices plate reader system for 2 h with an interval of 90 seconds at 37°C.
Statistical analysis
Statistical analysis was performed on the GraphPad Prism V6 software. Drug-treated and untreated groups were compared using Student’s t-test. All experiments were performed three times with multiple replicates based on the experiment. All data were presented as mean ± SD.
Results
K562, HL-60, and NB-4 cell lines are resistant to ARA-C and CAPE effectively decreased cell proliferation in all cell lines
All leukemia cell lines were treated with various concentrations of Videza, Ara-C, and Decitabin and CAPE for 3 days. Cell viabilities were measured using an ATP-based Cell TiterGlo assay. Cell viability did not significantly change upon Ara-C treatment at increased drug doses for K562 and NB-4 cell lines. However, the percentage of cell viability started to slightly decrease after 50 nM Ara-C treatment for the HL-60 cell line ((a)). We found the K562 cell line resistant to Videza and Decitabin compared to other cell lines ((b,c)). CAPE inhibited cell proliferation and decreased the cell viability in all cell lines at a concentration of around 5 μM ((d)).
Figure 1. ATP measurements of all cell lines upon drug treatments. Cell viability was assessed with an ATP-based assay. Cells were treated with (a) Ara-C, (b) 5-azacytidine (Videza), (c) 5-aza-2-deoxycytidine (Decitabine) and (d) CAPE at various concentrations for 3 days. Data are presented as mean ± SD.
CAPE treatment together with ARA-C kills leukemia cell lines
All cell lines were treated with 5 μM CAPE and 25 nM Ara-C for 96 hours. Cell viability assay showed that CAPE combined with ARA-C effectively kills cells compared to Ara-C or CAPE treatment alone ((a)). We next tried CAPE in the Videza- and Decitabine-resistant cell line K562. CAPE combined with Decitabine decreased cell viability compared to Decitabine or CAPE treatment alone. However, using CAPE with Videza did not show the same effect. Although cell viability decreased more than CAPE or Videza alone, these data were not statistically significant ((b)).
Figure 2. Cell viability (%) of drug-resistant cell lines treated together with CAPE and the conventional therapeutics. (a) Ara-C-resistant HL-60, K562, and NB-4 cell lines treated with Ara-C, CAPE, and Ara-C and CAPE in combination, (b) Videza- and Decitabine-resistant K562 cell line treated with CAPE in combination for 4 days. Data are presented as mean ± SD. ***p < 0.001, **p < 0.01, *p < 0.05.
CAPE has no effect on CD243 expression and Rhodamine efflux
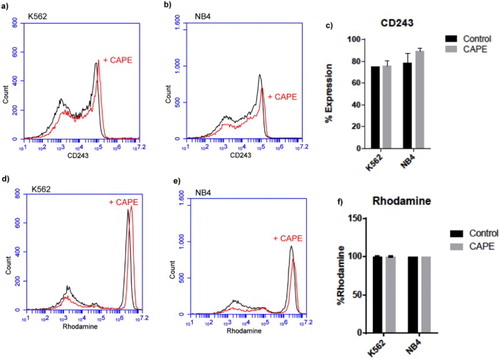
Building upon these results, we next sought the effect of CAPE on expression of drug transporter CD243 (MDR1). Flow cytometry analysis of CD243 in K562 and NB4 cell lines showed that although it was expressed around 80% in both cell lines, the expression did not change upon CAPE treatment ((a–c)). Interestingly, we found K562 and NB-4 cell lines did not export rhodamine and they kept it within the cells ((d–f)). Upon CAPE treatment, Rhodamine 123 efflux assay showed no change in rhodamine export.
Figure 3. Flow cytometric analysis of CD243 and Rhodamine efflux assay in NB-4 and K562 cell lines. (a), (b), (d) and (e) are representative histograms. (c) % presentation of the CD243 expression and (d) rhodamine in K562 and NB-4 cell lines. Data are presented as mean ± SD.
CAPE decreases oxygen consumption in leukemia cell lines
To further investigate the effect of CAPE on drug resistance, we looked into cellular metabolism and first investigated the oxygen consumption levels in leukemia cell lines. We found CAPE decreases oxygen consumption in all cell lines suggesting that it might disrupt oxidative phosphorylation ().
Figure 4. Oxygen consumption assay. Oxygen consumption rates (OCR) of all cell lines upon CAPE treatment. Data are presented as mean ± SD. *p < 0.05.
CAPE increases mRNA expression of glycolytic enzymes in K562 and NB-4 cell lines
Glycolysis is regulated by Pyruvate kinase muscle isozyme (PKM2), hexokinase 1 and 2 (HK1 and HK2), phosphofructokinase-liver type (PFKL), and phosphofructokinase-platelet type (PFKP) enzymes which catalyse the irreversible steps. After finding the disruptive effect of CAPE on oxphos, to investigate its effect on glycolysis, the expression of these key regulatory enzymes in leukemia cell lines was controlled by qRT-PCR. PKM2, PFKL, and PFKP mRNA expression levels significantly increased upon CAPE treatment in the K562 cell line. HK2, HK1, PFKL, and PFKP expressions were found significantly higher in the NB-4 cell line. We did not find any significant increase of these enzymes in HL-60 cells; however, there was a significant decrease in the HK2 enzyme (). These data suggest that CAPE might increase glycolysis in NB-4 and K562 cell lines to compensate for depressed oxphos.
Figure 5. qRT-PCR analysis of glycolytic enzymes. Changes in the mRNA expression of key glycolytic enzymes upon CAPE treatment were relatively calculated against untreated samples. ***p < 0.001, **p < 0.01, *p < 0.05.
The STAT3 mRNA expression level correlates with changes in glycolysis in K562 and NB-4 cell lines
Increased STAT3 expression has been linked to increased glycolysis and decreased oxphos in cells. Thus, we checked the STAT3 mRNA expression in K562, NB-4, and HL-60 cell lines. STAT3 expression was found significantly higher upon CAPE treatment in K562 and NB-4 cell lines. In the HL-60 cell line, STAT3 expression was found decreased upon CAPE treatment; however this was not statistically significant (). Our results suggest that CAPE triggers STAT3 expression to increase glycolysis in NB-4 and K562 cell lines.
Figure 6. qRT-PCR analyses of STAT3 expression. STAT3 mRNA levels were determined upon CAPE treatment. **p < 0.01, *p < 0.05.
Discussion
AML is a type of bone marrow cancer. Response to current AML therapeutics varies between younger and elderly patients, in addition to their genetic background [Citation21]. The full remission rate is still low and there is a need to develop a better drug to cure AML, especially for those resistant to conventional therapeutics [Citation2,Citation4]. CAPE is an active component of propolis. CAPE’s biological properties have been studied in various cancer cell lines to prove CAPE as an anti-cancer drug [Citation13,Citation22]. The anti-proliferative effect of the CAPE has been shown in the HL-60 leukemia cell line [Citation19]. CAPE arrested cell growth with concentrations of 1, 1.5, and 5 μM. CAPE also has been shown to induce apoptosis by altering the redox state in the HL-60 cell line, suggesting CAPE’s anti-oxidant property [Citation14]. In our study we found that 5 μM CAPE concentrations killed almost 50% of the cells at the end of 72 hours. On the contrary, compared to these lower drug doses, CAPE has been shown to kill colon cancer [Citation23], breast cancer [Citation12,Citation13], and medulloblastoma cells [Citation24] at higher concentrations.
Researchers have identified how CAPE induces apoptosis. Time- and dose-dependent CAPE treatment resulted in the release of cytochrome C, decrease of Bcl-2 expression, increase of Bax expression accompanied with activation of Caspase 3 and PARP in the U937AML cell line [Citation25]. This result showed that CAPE induces mitochondrial apoptosis, rather than extracellular death receptor signaling. Additionally, CAPE has been shown to sensitize lung cancer cells to radiotherapy [Citation24]. However, how CAPE changes cellular signaling to induce apoptotic pathways and whether it is important in drug resistance in cancer remain to be elucidated [Citation26].
In this study, we first controlled the effect of CAPE together with drugs Ara-C, Videza, and Decitabine, which are currently included in AML therapy regimens. Similar to our finding, the HL-60 cell line was found to be resistant to Ara-C treatment compared to Jurkat and U937 cell lines [Citation27]. K562 and NB-4 cell lines were also identified as resistant to Ara-C in very recent studies [Citation28]. We found that the use of CAPE together with Ara-C synergistically killed all the cell lines more than the use of Ara-C or CAPE alone. Similarly, CAPE together with Decitabine decreased cell viability more than Decitabine or CAPE alone in the K562 cell line. However, although CAPE together with Videza reduced cell viability more, these data were not statistically significant. Taking together, these data suggested that CAPE might affect multi-drug resistance by making cells more sensitive to chemotherapeutics. As all the cell lines used in the study have high expression of MDR1, we next checked CAPE’s effect on MDR1 expression. Flow cytometric analysis of MDR1 (CD243) expression did not change upon CAPE treatment. Other MDR protein expressions should also be checked in leukemia cell lines upon CAPE treatment.
Since Ara-C and Decitabine drugs are known to act on metabolic pathways, we searched CAPE’s effect on cell metabolism and whether an altered metabolism could be responsible for increased drug sensitivity [Citation29]. Recent literature has suggested that CAPE disrupts mitochondrial function [Citation16,Citation25]. To further exploit CAPE’s effect on mitochondria we checked oxygen consumption of all cell lines upon CAPE treatment. To control, cells were also treated with FCCP, an uncoupler agent, and oligomycin, an ATP synthase inhibitor. The use of FCCP decreases ATP production without decreasing the oxygen consumption; on the contrary oligomycin reduces oxygen consumption [Citation30]. In all cell lines, oxygen consumption levels dropped significantly upon CAPE treatment. Our results showed CAPE’s effect on oxphos for the first time to our knowledge. Increased aerobic glycolysis is a very well-known phenomenon in cancer [Citation31]. Thus, we next sought whether cells change their glycolysis status upon disruption of oxphos by CAPE. Expression of hexokinase, phosphofructokinase, and pyruvate kinase was analyzed with qRT-PCR. CAPE increased the expression of these key regulatory glycolytic enzymes in K562 and NB-4 cell lines. However, no significant change was observed in the HL-60 cell line, except from HK2, which was depressed. These data implicated that cells might try to increase the glycolytic pathway to compensate for decreased oxphos. Indeed, CAPE has been shown to increase glucose uptake via AMPK activation in muscle cells [Citation32]. STAT3 suggested as a metabolic switch in recent studies as its increased expression linked to augmented aerobic glycolysis and decreased oxphos [Citation33,Citation34]. In this study, in K562 and NB-4 cell lines STAT3 expression was significantly increased upon CAPE treatment. In the HL-60 cell line, STAT3 expression slightly decreased, which was not statistically significant. Taken together, our results showed that CAPE alters cellular metabolism by decreasing oxphos and increasing glycolysis in K562 and NB-4 leukemia cell lines. Additionally, STAT3 expression is changed to switch between these pathways.
In conclusion, this study showed for the first time that CAPE decreases oxphos in leukemia cell lines. Presumably to compensate for this, cells increase glycolysis. To switch between pathways, STAT3 mRNA expression increases in cells. However, whether STAT3 is a direct effect of CAPE in the cells remains to be investigated. Another important question is whether CAPE also has an inhibitory effect on specific complexes of electron transport chain. Although further studies are required to confirm and exploit CAPE’s action mechanism in oxphos, we believe our results will shed light on another unknown property of CAPE and the relation between altered metabolism and drug resistance.
Acknowledgement
B.Y. designed the project, did all the experiments, and wrote the paper with input from M.S. The authors would like to thank Karadeniz Technical Faculty School of Medicine for funding and Figen Celep Eyupoglu of the Medical Biology Department for kindly providing CAPE.
Disclosure statement
No potential conflict of interest was reported by the authors.
ORCID
Burcu Yucel http://orcid.org/0000-0002-6599-4558
References
- Estey E, Döhner H. Acute myeloid leukaemia. The Lancet. 2006;368:1894–1907. doi: 10.1016/S0140-6736(06)69780-8
- Döhner H, Weisdorf DJ, Bloomfield CD. Acute myeloid leukemia. New England J Med. 2015;373:1136–1152. doi: 10.1056/NEJMra1406184
- Figueroa ME, Abdel-Wahab O, Lu C, et al. Leukemic IDH1 and IDH2 mutations result in a hypermethylation phenotype, disrupt TET2 function, and impair hematopoietic differentiation. Cancer Cell. 2011;18:553–567. doi: 10.1016/j.ccr.2010.11.015
- Shipley JL, Butera JN. Acute myelogenous leukemia. Exp Hematol. 2009;37:649–658. doi: 10.1016/j.exphem.2009.04.002
- Chaudhury SS, Morison JK, Gibson BES, et al. Insights into cell ontogeny, age, and acute myeloid leukemia. Exp Hematol. 2015;43:745–755. doi: 10.1016/j.exphem.2015.05.008
- Pan X-N, Chen J-J, Wang L-X, et al. Inhibition of c-Myc overcomes cytotoxic drug resistance in acute myeloid leukemia cells by promoting differentiation. Plos One. 2014;9:e105381. doi: 10.1371/journal.pone.0105381
- Li L, Osdal T, Ho Y, et al. SIRT1 activation by a c-MYC oncogenic network promotes the maintenance and drug resistance of human FLT3-ITD acute myeloid leukemia stem cells. Cell Stem Cell. 2014;15:431–446. doi: 10.1016/j.stem.2014.08.001
- Illmer T, Schaich M, Platzbecker U, et al. P-glycoprotein-mediated drug efflux is a resistance mechanism of chronic myelogenous leukemia cells to treatment with imatinib mesylate. Leukemia. 2004;18:401–408. doi: 10.1038/sj.leu.2403257
- Hsu PP, Sabatini DM. Cancer cell metabolism: Warburg and beyond. Cell. 2008;134:703–707. doi: 10.1016/j.cell.2008.08.021
- Hanahan D, Weinberg Robert A. Hallmarks of cancer: the next generation. Cell. 2011;144:646–674. doi: 10.1016/j.cell.2011.02.013
- Knoechel B, Aster Jon C. Metabolic mechanisms of drug resistance in leukemia. Cell Metab. 2015;22:759–760. doi: 10.1016/j.cmet.2015.10.005
- Omene CO, Wu J, Frenkel K. Caffeic acid phenethyl ester (CAPE) derived from propolis, a honeybee product, inhibits growth of breast cancer stem cells. Invest New Drugs. 2012;30:1279–1288. doi: 10.1007/s10637-011-9667-8
- Wu J, Omene C, Karkoszka J, et al. Caffeic acid phenethyl ester (CAPE), derived from a honeybee product propolis, exhibits a diversity of Anti-tumor effects in preclinical models of human breast cancer. Cancer Lett. 2011;308:43–53. doi: 10.1016/j.canlet.2011.04.012
- Chen Y-J, Shiao M-S, Wang S-Y. The antioxidant caffeic acid phenethyl ester induces apoptosis associated with selective scavenging of hydrogen peroxide in human leukemic HL-60 cells. Anti-Cancer Drugs. 2001;12:143–149. doi: 10.1097/00001813-200102000-00008
- Cavaliere V, Papademetrio DL, Lorenzetti M, et al. Caffeic acid phenylethyl ester and MG-132 have apoptotic and antiproliferative effects on leukemic cells but not on normal mononuclear cells. Translational Oncol. 2009;2:46–58. doi: 10.1593/tlo.08202
- Cavaliere V, Papademetrio DL, Lombardo T, et al. Caffeic acid phenylethyl ester and MG132, two novel nonconventional chemotherapeutic agents, induce apoptosis of human leukemic cells by disrupting mitochondrial function. Targeted Oncol. 2014;9:25–42. doi: 10.1007/s11523-013-0256-y
- Chen Y-J, Shiao M-S, Hsu M-L, et al. Effect of caffeic acid phenethyl ester, an antioxidant from propolis, on inducing apoptosis in human leukemic HL-60 cells. J Agric Food Chem. 2001;49:5615–5619. doi: 10.1021/jf0107252
- Qin T, Youssef EM, Jelinek J, et al. Effect of Cytarabine and Decitabine in combination in human leukemic cell lines. Clin Cancer Res. 2007;13:4225. doi: 10.1158/1078-0432.CCR-06-2762
- Chen J-H, Shao Y, Huang M-T, et al. Inhibitory effect of caffeic acid phenethyl ester on human leukemia HL-60 cells. Cancer Lett. 1996;108:211–214. doi: 10.1016/S0304-3835(96)04425-4
- Petriz J, Garcia-Lopez J. Flow cytometric analysis of P-glycoprotein function using rhodamine 123. Leukemia. 1997;11:1124–1130 doi: 10.1038/sj.leu.2400659
- Appelbaum FR, Gundacker H, Head DR, et al. Age and acute myeloid leukemia. Blood. 2006;107:3481–3485. doi: 10.1182/blood-2005-09-3724
- Lee Y-J, Kuo H-C, Chu C-Y, et al. Involvement of tumor suppressor protein p53 and p38 MAPK in caffeic acid phenethyl ester-induced apoptosis of C6 glioma cells. Biochem Pharm. 2003;66:2281–2289. doi: 10.1016/j.bcp.2003.07.014
- Xiang D, Wang D, He Y, et al. Caffeic acid phenethyl ester induces growth arrest and apoptosis of colon cancer cells via the β-catenin/T-cell factor signaling. Anti-Cancer Drugs. 2006;17:753–762. doi: 10.1097/01.cad.0000224441.01082.bb
- Lee Y-Y, Kao C-L, Tsai P-H, et al. Caffeic acid phenethyl ester preferentially enhanced radiosensitizing and increased oxidative stress in medulloblastoma cell line. Child's Nerv Syst. 2008;24:987–994. doi: 10.1007/s00381-008-0636-2
- Jin U-H, Song K-H, Motomura M, et al. Caffeic acid phenethyl ester induces mitochondria-mediated apoptosis in human myeloid leukemia U937 cells. Mol Cell Biochem. 2008;310:43–48. doi: 10.1007/s11010-007-9663-7
- Watabe M, Hishikawa K, Takayanagi A, et al. Caffeic acid phenethyl ester induces apoptosis by inhibition of NFκB and activation of Fas in human breast cancer MCF-7 cells. J Biol Chem. 2004;279:6017–6026. doi: 10.1074/jbc.M306040200
- Kanno S-I, Higurashi A, Watanabe Y, et al. Susceptibility to cytosine arabinoside (Ara-C)-induced cytotoxicity in human leukemia cell lines. Toxicol Lett. 2004;152:149–158.
- Liang H, Zheng Q-L, Fang P, et al. Targeting the PI3K/AKT pathway via GLI1 inhibition enhanced the drug sensitivity of acute myeloid leukemia cells. Sci Rep. 2017;7:40361. doi: 10.1038/srep40361
- Hauge M, Bruserud Ø, Hatfield KJ. Targeting of cell metabolism in human acute myeloid leukemia – more than targeting of isocitrate dehydrogenase mutations and PI3K/AKT/mTOR signaling? Eur J Haematol. 2016;96:211–221. doi: 10.1111/ejh.12690
- Schieke SM, Phillips D, McCoy JP, et al. The mammalian target of rapamycin (mTOR) pathway regulates mitochondrial oxygen consumption and oxidative capacity. J Biol Chem. 2006;281:27643–27652. doi: 10.1074/jbc.M603536200
- Vander Heiden MG, Cantley LC, Thompson CB. Understanding the Warburg effect: the metabolic requirements of cell proliferation. Science. 2009;324:1029–1033. doi: 10.1126/science.1160809
- Lee ES, Uhm K-O, Lee YM, et al. CAPE (caffeic acid phenethyl ester) stimulates glucose uptake through AMPK (AMP-activated protein kinase) activation in skeletal muscle cells. Biochem Biophys Res Commun. 2007;361:854–858. doi: 10.1016/j.bbrc.2007.07.068
- Demaria M, Giorgi C, Lebiedzinska M, et al. A STAT3-mediated metabolic switch is involved in tumour transformation and STAT3 addiction. Aging. 2010;2:823–842. doi: 10.18632/aging.100232
- Poli V, Camporeale A. STAT3-mediated metabolic reprograming in cellular transformation and implications for drug resistance. Front Oncol. 2015;5:121. doi: 10.3389/fonc.2015.00121