
ABSTRACT
Objective: We observed that ph + ALL patients administrated with recombinant human G-CSF (rhG-CSF) after intense chemotherapy have presented a trend of disease relapse. Thus, we aim to thoroughly investigate the expression and role of GM-CSFR and G-CSFR on ph + ALL patients.
Method: SUP-B15, BALL-1 and primary leukemia cells were used in this study. Transcript levels were analyzed by quantitative PCR while cell viability was measured using a CCK-8 assay. Flow cytometry was used to assess the different stages of cell cycle.
Results: We found that the mRNA expression levels of GM-CSFR and G-CSFR were higher in patients with ph + ALL, as well as in SUP-B15 cells. rhG-CSF was also observed to promote the viability of SUP-B15 cells while inversely inhibiting BALL-1 cell viability. In addition, we also determined that rhG-CSF (100 ng/ml) decreased the sensitivity of SUP-B15 cells to imatinib and nilotinib, while the results were exactly the contrary for dasatinib.
Conclusion: We demonstrated high expression levels of GM-CSFR and G-CSFR, as well as their promotable role for viability in ph + ALL cells. We further found that rhG-CSF influenced the sensitivity of SUP-B15 cells to TKIs.
KEYWORDS:
Background
Granulocyte colony-stimulation factor (G-CSF) not only stimulates the proliferation of myeloid cells but also potently promotes the process wherein myeloid progenitor cells transform into neutrophilic granulocytes [Citation1], as well as maintains their survival [Citation2]. G-CSF also plays pleiotropic roles in inducing the proliferation of human vascular endothelial cells [Citation3].
Granulocyte-macrophage colony-stimulation factor (GM-CSF) is mainly produced by activated leukocytes [Citation4]. It participates in regulating normal myeloid hematopoiesis and induces the activation of monocytes/macrophages [Citation5,Citation6]. In particular, GM-CSF also influences the function of dendritic cells (DCs) and T-lymphocytic cells [Citation7–9].
In previous studies, researchers have demonstrated that certain subgroups of B-lymphocytic leukemia cells express functional G-CSFR or GM-CSFR [Citation10–13]. It deserves to be mentioned that Ph-positive acute lymphoblastic leukemia (ph + ALL) presents a distinctive expression pattern of G-CSGR and GM-CSFR and responds to the stimulation of G-CSF and GM-CSF [Citation14–18].
In this study, we collected a greater number of peripheral blood samples of patients with ph + ALL or ph-ALL, as well as of SUP-B15 cells, and aimed to comprehensively investigate the expression and roles of GM-CSFR and G-CSFR in ph + ALL patients.
Materials and methods
Regents
Imatinib and nilotinib were kindly provided by Novartis (Basel, Swizerland), while dasatinib was donated by CTTQ (Lianyungang, China). 10 mM stock solutions were dissolved in DMSO and stored in −20°C. rhGM-CSF and rhG-CSF were purchased from Pepro TectTM.
Cell lines
A ph + ALL cell line (SUP-B15) was purchased from the American Type Culture Collection (ATCC). BALL-1 is a strain of B-ALL cell line without any fusion gene that was kindly donated to us by Master Hu Zheng of Fujian Institute of Hematology, Fujian Medical University. K562 was previously preserved in our laboratory. The cells were maintained in RPMI-1640 (HyClone) with 10% fetal bovine serum (Gibco) and stored in a 5% CO2 humidified incubator (U.S. Thermo Company) at 37°C.
Patients and samples
19 ph + B-ALL patients and 18 ph-B-ALL patients were enrolled in the study. All primary ALL cells were obtained at the time of diagnosis accordingly with WHO classification (2008). The peripheral blood mononuclear cells (PBMCs) were separated through a Ficoll–Hypaque gradient centrifugation method, then re-suspended in RPMI-1640 (HyClone) with 10% fetal bovine serum (Gibco) for use in the CCK-8 assay. All patients filled out an informed consent form before the collection of blood samples.
Cell viability assay
Briefly, cells (5 × 10⁴ cells/ml for SUP-B15 and BALL-1 cells, and 1 × 10⁶ cells/ml for primary leukemia cells) were cultured for the indicated time at 37°C in a 96-well plate with the indicated cytokines in the presence or absence of anti-G-CSFR antibodies (1:2000 abcam: ab156878 clone EPR8957) or TKIs to a final volume of 100 μL RPMI 1640 containing 10% FBS. The anti-G-CSFR was preincubated for 30 min together with the cells before rhG-CSF was added. Afterwards, 10 μL of CCK-8 reagents (Signalway antibody; College Park, Maryland, USA) were added to the wells. After lucifuge incubation at 37°C for the indicated period (4 h for SUP-B15 and BALL-1 cells, and 6 h for primary leukemia cells), the absorbance in each well was quantified with a microplate reader BioTek Elx808 at 450 nm. Cell viability was calculated as a percentage according to the following formula: OD(cytokines) − OD(blank)/[OD (control) − OD(blank)] × 100%. The percentage of cell growth inhibition was computed as follows: Cell growth inhibition (%) = OD(control) − OD(TKIs)/[OD(control) − OD(blank)] × 100%. The assay was performed in triplicate.
Polymerase Chain Reaction
Total RNA was prepared using the TRIzol method (Invitrogen, MA, USA) and was converted to complementary DNA (cDNA) using a Reverse Transcription Kit (Thermo Scientific, Waltham, MA, USA). The RT-PCR was performed with a PCR Master Mix (Thermo Scientific, Waltham, MA, USA) according to the manufacturer’s instructions. The PCR reaction was conducted under the following conditions: 95°C for 3 min, followed by 35 cycles of 30 s denaturation at 95°C, 30 s annealing at 55°C and 30 s elongation at 72°C, then a final extension at 72°C for 5 min. PCR products (5 μL) were separated by electrophoresis on a 2% (w/v) agarose gel, in which a type I nucleic acid dye was added and made visible by BIO-RAD. Real-time quantitative polymerase chain reaction (PCR) was performed with a SYBR Green PCR Kit (Roche). All samples were run on an ABI PRISM 7500 PCR instrument (Applied Biosystems) with GAPDH as an internal control. The reaction solution (20 µL) contained 10 µL 2 × QuantiTect SYBR Green PCR Master Mix, 0.5 µL of each primer (10 µM), 1 µL of cDNA and 8 µL of RNase-free water. Amplification was performed in three stages: holding stage (50°C for 2 min and 95°C for 10 min), cycling stage (40 cycles of 95°C for 15 s, 60°C for 1 min) and melting stage (95°C for 15 s, 60°C for 1 min, 95°C for 30 s, 60°C for 15 s). The primers are presented in . Relative gene expression levels were calculated using a 2-ΔΔCt method.
Table 1. Primer sequences for PCR.
Cell cycle analyses
SUP-B15 and BALL-1 cells were incubated with rhGM-CSF or rhG-CSF for 72 h, washed twice with PBS, after which 106 cells gradually achieved immobilization in 70% ethanol at 4°C overnight. Cells were then re-suspended in 500 μL PI/RNase Staining Buffer (BD Company) under averting light condition at room temperature for 15 min. The number of chromosomes were determined by a cytoanalyzer (BD FACS VerseTM) and red fluorescence at 488 nm excitation was recorded for analysis with the modifit software. The experiment was repeated three times.
Statistical Analysis
The comparisons of cell viability, variance and proportions of different cell cycle stages among groups were tested by one-way ANOVA. The changes in IC50 were analyzed with independent sample t-tests. The non-normal measurement data were represented by their median, and a bilateral Mann-Whitney U test was used to compare between two groups while a Kruskal-Wallis test of non-parametric analysis was utilized for comparisons among groups of three. P-values less than 0.05 were considered statistically significant and were derived from two-sided statistical tests. SPSS version 22 for Windows was used for all analyses.
Results
mRNA expression of bcr/abl fusions in SUP-B15 and K562 cells
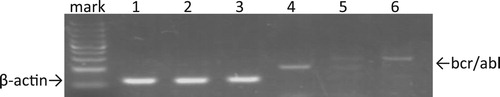
In order to investigate the expressions of GM-CSFR and G-CSFR in ph + ALL cells, we selected SUP-B15, which is a strain that expresses an e1a2 bcr/abl fusion mRNA [Citation19]. First, we qualitatively determined the expression of bcr/abl fusion mRNA in SUP-B15 cells using RT-PCR. Because the e1a2 bcr/abl fusion mRNAs expressed in SUP-B15 cells are shorter than the b3a2 bcr/abl fusion mRNAs characterized in K562 cells, PCR products in lane 6, which represent the positive control, were observed to traverse to a higher molecular weight position than those in lane 4, which were loaded with products amplified from SUP-B15 ().
Figure 1. Analysis of bcr-abl mRNA expression in SUP-B15 cells. Total RNA was isolated and RT-PCR was performed with β-actin primers as controls. K562 cells expressing the b3a2 bcr/abl fusion mRNA was used as positive control. Meanwhile, BALL-1 was identical to SUP-15 except for the bcr/abl fusion mRNA and thus served as the negative control. Lane 1: β-actin of sup-b15; lane 2: β-actin of BALL-1; lane 3: β-actin of K562; lane 4: bcr-abl of sup-b15; lane 5: negative control; lane 6: bcr-abl of K562.
The expression of GM-CSFR and G-CSFR mRNAs were higher in ph + ALL cells
We applied qPCR in detecting the relative levels of GM-CSFRα, GM-CSFRβ and G-CSFR mRNAs in PBMCs from 24 untreated B-ALL patients (12 ph + ALL and 12 ph-ALL samples) () and all cell lines. As shown in , GM-CSFRα, GM-CSFRβ and G-CSFR mRNA expressions vary from patient to patient. In general, ph + ALL patient samples showed relatively higher expression levels than those from ph-ALL patients. We also revealed that the mRNA expressions of G-CSFR and GM-CSFRα in SUP-B15 cells were higher than in BALL-1 cells. Interestingly, we did not observe any expression of GM-CSFRβ mRNA in SUP-B15 cells ().
Figure 2. Comparisons of GM-CSFRα (a), GM-CSFRβ (b) and G-CSFR (c) expression in primary cells from ph-ALL patients (n = 12) and ph + ALL patients (n = 12). G-CSFR, GM-CSFRα and GM-CSFRβ expression was detected with qRT-PCR and normalized to the GAPDH gene. The expressions of G-CSFR, GM-CSFRα and GM-CSFRβ relative to those in ph-ALL samples were calculated using the 2-DeltaDeltaCt method. P-values between samples were obtained by performing a Mann-Whitney U test. *p < 0.05, **p < 0.01.
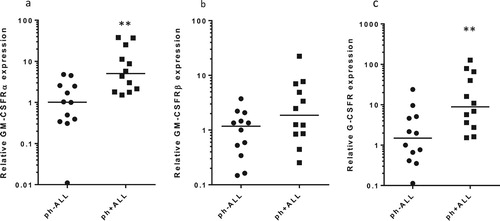
Figure 3. mRNA expressions of GM-CSFRα, GM-CSFRβ and G-CSFR in SUP-B15 and BALL-1 cells. mRNA expression was detected by qRT-PCR and normalized to the GAPDH gene. Relative quantification (RQ) was calculated using the 2−DeltaDeltaCt method. BALL-1 was set to 1. Error bars represent variations from three independent duplicates.
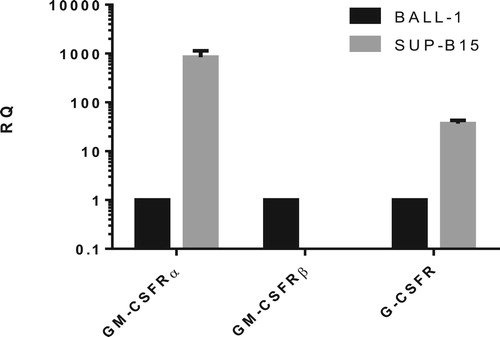
Table 2. B-ALL patients characteristics.
Primary ph + ALL cells responded more significantly to recombinant human GM-CSF and G-CSF
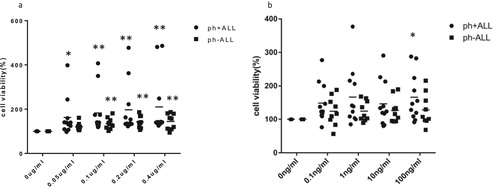
To explore the potential effects of GM-CSF and G-CSF on primary ph + ALL cells, 20 primary leukemia cell samples (), including 11 ph + ALL patients and 9 ph-ALL patients, were incubated with the indicated recombinant human GM-CSF and G-CSF (rhGM-CSF and rhG-CSF) for various time periods. We selected the results of cell viability deriving from a 24 h incubation for follow-up analysis. The median cell viability of 0.05 µg/mL, 0.1 µg/mL, 0.2 µg/mL and 0.4 µg/mL rhGM-CSF on primary ph + ALL cells were 162.81%, 183.10%, 197.11% and 210.10%, respectively, compared to 121.28%, 132.43%, 140.52% and 148.58% on primary ph-ALL cells, respectively. All differences in cell viability between control and rhGM-CSF groups were statistically significant (p < 0.05; a). Similarly, the median cell viability from 0.1 ng/mL, 1 ng/mL, 10 ng/mL and 100 ng/mL rhG-CSF were 149.09%, 167.09%, 146.99% and 166.48% on primary ph-ALL cells, respectively, and 124.7%, 125.14%, 127.03% and 128.78% on primary ph-ALL cells, respectively. On the other hand, only the difference between control and 100 ng/mL of rhG-CSF in primary ph + ALL cells was deemed statistically significant (p < 0.05; b).
Figure 4. The effects of rhGM-CSF (a) and rhG-CSF (b) on cell viability in primary ALL cells from ph + ALL (n = 11) and ph-ALL patients (n = 9). Primary ALL cells were treated a gradient of rhGM-CSF (0.05 μg/mL, 0.1 μg/mL, 0.2 μg/mL, 0.4 μg/mL) and rhG-CSF concentrations (0.1 ng/mL, 1 ng/mL, 10 ng/mL, 100 ng/mL) for 12, 24, 36 or 48 h, after which cell viability was gauged with a CCK-8 assay. The results deriving from 24 h were used for analysis. A Kruskal-wallis test of non-parametric analysis was used to compare data among the five groups. *P < 0.05 and **P < 0.01 represent cell proliferation in the experimental group that was treated with cytokines compared to the control group (absent rhGM-CSF or rhG-CSF).
RhG-CSF promotes viability of SUP-B15 cells while rhGM-CSF and rhG-CSF reduce the viability of BALL-1 cells
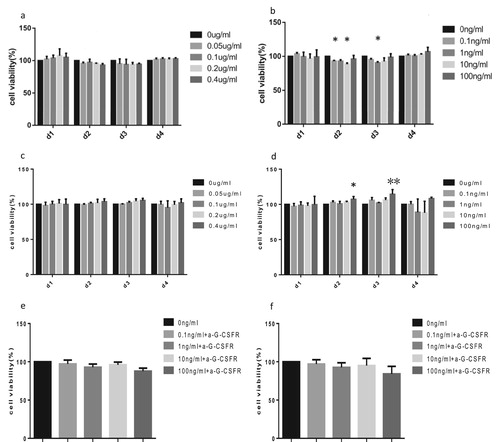
qPCR results suggest that SUP-B15 cells do not express the mRNAs for GM-CSFRβ and GM-CSFRα subunits. In addition, the expression of G-CSFR was significantly lower in BALL-1 than in SUP-B15 cells. Thus, we further determined the potential activation of GM-CSFR and G-CSFR signaling in SUP-B15 and BALL-1 cells. SUP-B15 and BALL-1 were treated with the indicated rhGM-CSF or rhG-CSF for 1, 2, 3 or 4 days, after which cell viability was measured by the CCK-8 assay. We found that rhGM-CSF presented an inhibitory effect on BALL-1 cells when incubated with rhGM-CSF for 2 or 3 days (a). As expected, SUP-B15 cells did not respond to rhGM-CSF with statistically significant changes due to its absent GM-CSFRβ subunit (c). Interestingly, G-CSF showed opposing functions on BALL-1 and SUP-B15 cells, in which it reduced the viability of BALL-1 cells after a 2–3 day incubation. However, this effect was not dose-dependent as the maximum inhibitory role on BALL-1 cells appeared at 10 ng/mL of rhG-CSF for a 2 day-incubation and 1 ng/mL of rhG-CSF for a 3-day incubation (b). In contrast, when incubating with rhG-CSF for 2 or 3 days, the viability of SUP-B15 cells were enhanced, with the effect of 100 ng/mL rhG-CSF being the most significant (d). In order to exclude the possibility of a rhG-CSF independent cause for this observation, BALL-1 and SUP-B15 cells were treated with rhG-CSF in the absence or presence of G-CSFR blocking antibodies. Antibody pretreatment to a large extent prevented rhG-CSF induced the change of cell viability (e,f). This supports that the rhG-CSF is causing the change of cell viability via the G-CSFR and not due to off target effects.
Figure 5. The effects of rhGM-CSF and rhG-CSF on the viability of SUP-B15 and BALL-1 cells. SUP-B15 and BALL-1 cells were treated with the indicated rhGM-CSF or rhG-CSF for 1, 2, 3 or 4 days, after which cell viability was measured by a CCK-8 assay. (a) The effect of rhGM-CSF on the viability of BALL-1 cells. (b) The effect of rhG-CSF on the viability of BALL-1 cells. (c) The effect of rhGM-CSF on the viability of SUP-B15 cells. (d) The effect of rhG-CSF on the viability of SUP-B15 cells. (e) The effect of rhG-CSF in the absence or presence of G-CSFR blocking antibodies on the viability of BALL-1 cells after 72 h treatment. (f) The effect of rhG-CSF in the absence or presence of G-CSFR blocking antibodies on the viability of SUP-B15 cells after 72 h treatment. Error bars represent variations from three independent duplicates. *P < 0.05 and **P < 0.01 represent cell proliferation in the experimental group that was treated with cytokines compared to the control group (absent rhGM-CSF or rhG-CSF).
RhGM-CSF and RhG-CSF induced BALL-1 cell cycle arrest at the G0/G1 phase while RhG-CSF induced S-phase arrest in SUP-B15 cells
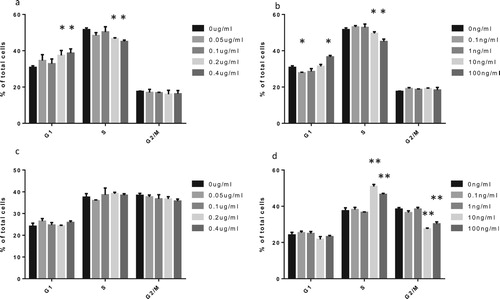
To demonstrate the effects of GM-CSF and G-CSF on the viability of SUP-B15 and BALL-1 cells, we further investigated the roles of rhGM-CSF and rhG-CSF on BALL-1 and SUP-B15 cell cycle progression using flow cytometry. There was a significant increase in the proportion of BALL-1 cells in the G1 phase and a distinct reduction in S phase after incubation with rhGM-CSF for 72 h (a). rhG-CSF exhibited a similar effect as rhGM-CSF in BALL-1 cells, but low doses (0.1 ng/mL and 1 ng/mL G-CSF) slightly reduced the proportion of BALL-1 cells in G1 while mildly increasing the proportion of cells in S phase (b). In addition, rhGM-CSF had no effect on the cell cycle progression of SUP-B15 cells (c), whereas rhG-CSF significantly increased S-phase arrest (d).
Figure 6. The effects of rhGM-CSF and rhG-CSF on the cell cycle progression of BALL-1 and SUP-B15 cells. Cell lines were treated with the indicated rhGM-CSF and rhG-CSF for 72 h, after which cell cycle progression was analyzed by flow cytometry. (a) FACS of BALL-1 cells treated with rhGM-CSF. (b) FACS of BALL-1 cells treated with rhG-CSF. (c) FACS of SUP-B15 cells treated with rhGM-CSF. (d) FACS of SUP-B15 cells treated with rhG-CSF. Error bars represent the standard error of the mean of cell proportion in three independent experiments. *P < 0.05 and **P < 0.01 represent cell proportion in the experimental group that was treated with cytokines compared to the control group (absent rhGM-CSF or rhG-CSF).
RhG-CSF increases the sensitivity of SUP-B15 cells to dasatinib while adversely decreasing its sensitivity to imatinib and nilotinib
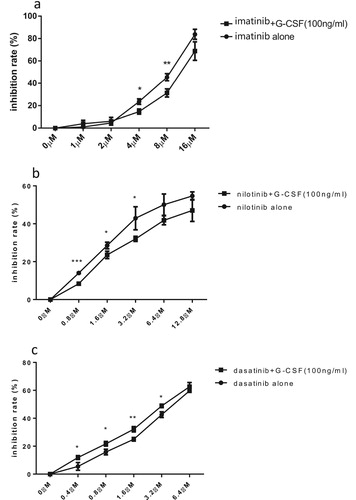
TKIs (tyrosine kinase inhibitors) are important fundamental therapeutic agents to ph + ALL, while G-CSF is usually used to shorten the agranulocytosis phase after intensive chemotherapy. Because rhG-CSF exhibited peculiar effects on cell viability and cell cycle in SUP-B15 cells, we thus examined the sensitivity effects of rhG-CSF towards TKIs in SUP-B15 cells. In combination with 100 ng/mL of rhG-CSF for 72 h, the IC50 of imatinib and nilotinib increased from 7.87 ± 0.40 μM to 11.43 ± 1.35 mM, and from 7.37 ± 1.56 μM to 17.01 ± 4.00 μM respectively. Interestingly, in contrast to imatinib and nilotinib, rhG-CSF increased the sensitivity of SUP-B15 cells to dasatinib. The IC50 of dasatinib alone was 4.33 ± 0.15 μM, which was significantly lower than imatinib and nilotinib combined. When incorporated with 100 ng/mL of rhG-CSF, the IC50 of dasatinib adversely decreased to 3.53 ± 0.27 μM ().
Figure 7. The Influence of rhG-CSF on the sensitivity of SUP-B15 cells to TKIs. The inhibition rate of imatinib(a), nilotinib(b) and dasatinib(c) alone or in combination with 100 ng/mL rhG-CSF to SUP-B15 cells was measured after 72 h treatment. Error bars represents the variations of means of three independent experiments, t test were used to compare the difference between the two group at different dose of drugs. *p < 0.05, **p < 0.01 ***p < 0.001.
Discussion
In previous studies, researchers suggested that G-CSF or GM-CSF have no effect on ALL cells [Citation20–22]. However, one paper reported that an ALL patient with 11q23, who was administered with rhG-CSF after receiving chemotherapy, presented with relapse symptoms. Individually, ph + ALL primary cells and cell lines were established purposely by investigators to express GM-CSFR or G-CSFR, which have been shown to respond well to rhGM-CSF and rhG-CSF [Citation14–18]. However, the expression levels of GM-CSFR and G-CSFR between ph + ALL and ph-ALL cells have not yet been compared, neither has it been for the response rate to GM-CSF and G-CSF. While qPCR suggested that all primary leukemia cells examined express mRNAs for GM-CSFR and G-CSFR, the levels were relatively higher in ph + ALL patients and SUP-B15 cells. It is well known that GM-CSFR consists of α- and β-subunits, in which the α-subunit is located on the cell surface and functions to bind GM-CSF while the β-subunit conveys the signal triggered by the bond between ligand and receptor. We found an interesting phenomenon wherein the mRNA for the GM-CSFRα subunit was found present in SUP-B15 cells while that for the GM-CSFRβ subunit was absent.
In this study, we first revealed that both rhGM-CSF and rhG-CSF were predominantly effective on primary leukemia cells from ph + ALL patients. This observation may be due to the higher expression of GM-CSFR and G-CSFR mRNAs in ph + ALL patients. However, Inukai and colleagues [Citation13] had indicated that the sensitivity of cells to G-CSF was not closely relevant to the level of G-CSFR expressed on cells. We do also observe this interesting phenomenon in patients treated with rhGM-CSF. These results suggest that the responsiveness of leukemia cells to GM-CSF or G-CSF is not only dependent on the quantity of their receptors, but also on the activity of downstream signaling systems that transmit the signals from GM-CSFR or G-CSFR [Citation1,Citation23,Citation24].
Cell viability is a macroscopic representation of cellular processes, which include cell cycle and apoptosis. We further prove that rhGM-CSF or rhG-CSF can influence the cell cycle in SUP-B15 and BALL-1 cells, as well as verified the cell viability results with CCK-8 assays.
Chemotherapeutic treatments of relapsed or refractory AML tend to use rhG-CSF or rhGM-CSF to enhance the cytotoxic roles of chemotherapeutic agents by inducing leukemia cells to progress into the G1 and S-phases of the cell cycle, where cells are more sensitive to chemotherapy [Citation25]. In order to investigate the effects of rhG-CSF on the sensitivity of SUP-B15 cells to TKIs, we treated SUP-B15 cells with rhG-CSF in combination with TKIs. The increasing IC50 of imatinib and nilotinib may be due to the proliferation effects of rhG-CSF, which antagonizes the cytotoxic roles of imatinib and nilotinib. Of interest, rhG-CSF enhances the sensitivity of SUP-B15 cells to dasatinib. One of the possible mechanisms is that G-CSF can activate Lyn (SRC kinases), which plays a critical role in cellular proliferation through activating PI3 K/AKT [Citation26], Meanwhile, the negative feedback is initiated by inducing SOCS3 [Citation27]. Dasatinib is an inhibitor of not only ABL kinases but also SRC kinases [Citation28]. Thus, dasatinib inhibits the proliferative effect induced by G-CSFR through SRC kinases. Meanwhile, other underlying mechanisms reduce the cell viability of SUP-B15 cells mediated by G-CSF, like BALL-1 cells. However, a phenomenon worth noting is the inherent resistance of SUP-B15 cells to imatinib and nilotinib [Citation19,Citation29], with just 100 ng/mL of rhG-CSF able to decrease the sensitivity of SUP-B15 cells to these drugs.
Disclosure statement
No potential conflict of interest was reported by the authors.
ORCID
Yuan-Zhong Chen http://orcid.org/0000-0001-6526-681X
References
- Avalos BR. Molecular analysis of the granulocyte colony-stimulating factor receptor. Blood. 1996;88(3):761–777.
- Begley CG, et al. Purified colony-stimulating factors enhance the survival of human neutrophils and eosinophils in vitro: a rapid and sensitive microassay for colony-stimulating factors. Blood. 1986;68(1):162–166.
- Bussolino F, Wang JM, Defilippi P, et al. Granulocyte- and granulocyte– macrophage-colony stimulating factors induce human endothelial cells to migrate and proliferate. Nature. 1989;337(6206):471–473. doi: 10.1038/337471a0
- Hamilton JA. Colony-stimulating factors in inflammation and autoimmunity. Nat Rev Immunol. 2008;8(7):533–544. doi: 10.1038/nri2356
- Ushach I, Zlotnik A. Biological role of granulocyte macrophage colony-stimulating factor (GM-CSF) and macrophage colony-stimulating factor (M-CSF) on cells of the myeloid lineage. J Leukoc Biol. 2016;100(3):481–489. doi: 10.1189/jlb.3RU0316-144R
- Hercus TR, Broughton SE, Ekert PG, et al. The GM-CSF receptor family: mechanism of activation and implications for disease. Growth Factors. 2012;30(2):63–75. doi: 10.3109/08977194.2011.649919
- Mellman I, Steinman RM. Dendritic cells: specialized and regulated antigen processing machines. Cell. 2001;106(3):255–258. doi: 10.1016/S0092-8674(01)00449-4
- Codarri L, Gyülvészi G, Tosevski V, et al. RORγt drives production of the cytokine GM-CSF in helper T cells, which is essential for the effector phase of autoimmune neuroinflammation. Nat Immunol. 2011;12(6):560–567. doi: 10.1038/ni.2027
- El-Behi M, Ciric B, Dai H, et al. The encephalitogenicity of TH17 cells is dependent on IL-1- and IL-23-induced production of the cytokine GM-CSF. Nat Immunol. 2011;12(6):568–575. doi: 10.1038/ni.2031
- El-Sonbaty SS, Tsuchiya H, Watanabe M, et al. Exogenous expression of human granulocyte colony-stimulating factor receptor in a B-lineage acute lymphoblastic leukemia cell line: a possible model for mixed lineage leukemia. Leuk Res. 1995;19(4):249–256. doi: 10.1016/0145-2126(94)00156-5
- Gattei V, et al. Human granulocyte-macrophage colony-stimulating factor supports the clonogenic growth of B-lineage acute lymphoblastic leukemias expressing myeloid antigens. Cytokines Cell Mol Ther. 1997;3(3):141–151.
- Handa A, Kashimura T, Takeuchi S, et al. Expression of functional granulocyte colony-stimulating factor receptors on human B-lymphocytic leukemia cells. Ann Hematol. 2000;79(3):127–131. doi: 10.1007/s002770050567
- Inukai T, Sugita K, Iijima K, et al. Leukemic cells with 11q23 translocations express granulocyte colony-stimulating factor (G-CSF) receptor and their proliferation is stimulated with G-CSF. Leukemia. 1998;12(3):382–389. doi: 10.1038/sj.leu.2400951
- Estrov Z, et al. Molecular and biologic characterization of a newly established Philadelphia-positive acute lymphoblastic leukemia cell line (Z-33) with an autocrine response to GM-CSF. Leukemia. 1996;10(9):1534–1543.
- Estrov Z, Talpaz M, Zipf TF, et al. Role of granulocyte-macrophage colony-stimulating factor in Philadelphia (Ph1)-positive acute lymphoblastic leukemia: studies on two newly established Ph1-positive acute lymphoblastic leukemia cell lines (Z-119 and Z-181). J Cell Physiol. 1996;166(3):618–630. doi: 10.1002/(SICI)1097-4652(199603)166:3<618::AID-JCP17>3.0.CO;2-2
- Inukai T, Sugita K, Mitsui K, et al. Participation of granulocyte colony-stimulating factor in the growth regulation of leukemia cells from Philadelphia chromosome-positive acute leukemia and blast crisis of chronic myeloid leukemia. Leukemia. 2000;14(8):1386–1395. doi: 10.1038/sj.leu.2401837
- Kobbe G, Bauser U, Rieth C, et al. Granulocyte colony-stimulating factor (G-CSF) mediated mobilization of leukemic cells in Philadelphia chromosome positive acute lymphoblastic leukemia expressing myeloid antigens (my+Ph+ALL). Am J Hematol. 1998;58(4):330–333. doi: 10.1002/(SICI)1096-8652(199808)58:4<330::AID-AJH14>3.0.CO;2-B
- Tsuchiya H, et al. Responses to granulocyte colony-stimulating factor (G-CSF) and granulocyte-macrophage CSF in Ph1-positive acute lymphoblastic leukemia with myeloid surface markers. Blood. 1991;77(2):411–413.
- Quentmeier H, Eberth S, Romani J. BCR-ABL1-independent PI3Kinase activation causing imatinib-resistance. J Hematol Oncol. 2011;4(1):6. doi: 10.1186/1756-8722-4-6
- Ode DL, et al. The effect of recombinant GM-CSF and G-CSF on the bone marrow cells of children with acute lymphoblastic leukemia. Leukemia. 1992;6(11):1210–1212.
- Touw I, et al. Recombinant hematopoietic growth factors fail to induce a proliferative response in precursor B acute lymphoblastic leukemia. Leukemia. 1989;3(5):356–362.
- MirroJrJ, et al. Effects of recombinant human hematopoietic growth factors on leukemic blasts from children with acute myeloblastic or lymphoblastic leukemia. Leukemia. 1993;7(7):1026–1033.
- Welte K, et al. Filgrastim (r-metHuG-CSF): the first 10 years. Blood. 1996;88(6):1907–1929.
- Anderlini P, et al. Biologic and clinical effects of granulocyte colony-stimulating factor in normal individuals. Blood. 1996;88(8):2819–2825.
- Bettelheim P, et al. Recombinant human granulocyte-macrophage colony-stimulating factor in combination with standard induction chemotherapy in de novo acute myeloid leukemia. Blood. 1991;77(4):700–711.
- Zhu QS, et al. G-CSF induced reactive oxygen species involves Lyn-PI3-kinase-Akt and contributes to myeloid cell growth. Blood. 2006;107(5):1847–1856. doi: 10.1182/blood-2005-04-1612
- Palande K, et al. Scratching the surface: signaling and routing dynamics of the CSF3 receptor. Front Biosci (Landmark Ed). 2013;18:91–105. doi: 10.2741/4089
- Scott AJ, Song E-K, Bagby S, et al. Evaluation of the efficacy of dasatinib, a Src/Abl inhibitor, in colorectal cancer cell lines and explant mouse model. PLoS One. 2017;12(11):e0187173. doi: 10.1371/journal.pone.0187173
- Ding J, Romani J, Zaborski M, et al. Inhibition of PI3 K/mTOR overcomes nilotinib resistance in BCR-ABL1 positive leukemia cells through translational down-regulation of MDM2. PLoS One. 2013;8(12):e83510. doi: 10.1371/journal.pone.0083510