
ABSTRACT
Objectives: In order to investigate the pathophysiology of erythrocyte membrane proteins, 10 patients (6 pre- and 4 post-splenectomy) with hereditary spherocytosis (HS) and other patients with haemolytic anaemia were examined.
Methods: The membrane proteins were analysed by biochemical and mass spectrometry.
Results: Reductions in the extracellular membrane of band 3 protein by eosin-5'-maleimide (EMA) binding test were greater in patients with pre-splenectomy HS than in patients with post-splenectomy HS, other types of haemolytic anaemia, and controls. Compared to patients with haemolytic anaemia and healthy controls, the band 3 protein of patients with HS pre- or post-splenectomy was more easily decomposed with N-glycosidase F and by mass spectrometry interactions with degraded low-molecular-weight spectrin and ankyrin. The resulting fragments were observed more frequently in pre-splenectomy than post-splenectomy HS. Haemoglobin-derived peptides were present in patients with haemoglobinopathy (Hb Evans, Hb Sabine) but not in those with haemolytic anaemia and healthy controls.
Conclusion: Haemolysis in patients with HS occurred because the fragile proteins in erythrocytes (band 3, spectrin, and ankyrin) collapsed due to compression during blood circulation in the spleen. Further, haemolysis in patients with haemoglobinopathy occurred owing to membrane damage due to combined spectrin, band 3 with denatured haemoglobin in the vessel during blood circulation.
Introduction
Hereditary spherocytosis (HS) occurs frequently among patients with congenital haemolytic anaemia and is associated with abnormalities of the erythrocyte cell membrane. In patients with HS, the erythrocyte membrane glycoproteins spectrin, ankyrin, band 3 protein, and band 4.2 are defective, as shown by biochemical analysis [Citation1]. The ratio of band 3 protein was found to decrease from 20% to 30% in patients with HS [Citation2]. Of note, patients with HS without a decrease in band 3 protein have quality dysfunction [Citation3]. Moreover, downregulation and mutation of spectrin and ankyrin proteins have been reported in patients with HS [Citation4].
Band 3 protein has an integral inner membrane protein, interacting with other proteins, such as inside the skeletal membrane protein of spectrin and ankyrin to regulate erythrocyte shape and modulate the efflux of anions, such as chloride/bicarbonate (CL−/HCO3−) [Citation5]. Band 3 protein is also known to penetrate or traverse the lipid bilayer more than 13 times; 50–60% of the protein is within the erythrocyte membrane and 30–40% of the protein is exposed on the intracellular membrane, with only a limited portion of the protein in extracellular membrane [Citation6]. Despite these findings, the roles of these proteins in the pathogenesis of HS are unclear.
This study aimed to elucidate the cause of anaemia in patients with HS by evaluating band 3, spectrin, and ankyrin proteins by biochemical and mass spectrometry analyses in patients with HS, and some of HS (only obtained informed consent) including genetic testing was performed. These results were compared with those derived from healthy volunteers and patients with other haemolytic anaemia-related diseases.
Methods
Patients and sample collection
We collected 2–3-mL blood samples from patients with HS after obtaining informed consent (). Of the patients, 10 were children with HS, 4 were patients with HS who had undergone splenectomy 5–10 years earlier, and 1 patient with HS was assessed before and 4 weeks after splenectomy. We also assessed 8 patients with the following conditions: haemoglobinopathies (Hb Sabine, n = 1; Hb Evans, n = 1; HbS disease, n = 1), β-thalassemia (n = 2), erythroenzymopathy (G6PD deficiency, n = 1), paroxysmal cold haemoglobinuria (PCH, n = 1), and Evans syndrome (Coombs test IgG positive, n = 1) for autoimmune haemolytic anaemia (AIHA). Four healthy controls (age 20 years, n = 1; 21 years, n = 2; 24 years, n = 1) were also included in the study. Blood samples were collected in ethylenediaminetetraacetic acid-containing tubes and the erythrocyte layer was separated using a Ficoll specific gravity centrifuge. The erythrocyte layer was washed with phosphate buffer solution (pH 7.2) and the erythrocytes in the layer were haemolysed with distilled water. The erythrocyte membrane was then prepared from the layer by centrifugation at 15,000 rpm at 4°C. Glycoproteins were separated from the erythrocyte membrane by sodium dodecyl sulphate (SDS)–polyacrylamide gel electrophoresis (PAGE) [Citation7].
Table 1. Patient characteristics.
Erythrocyte membrane protein analysis
Band sizes for glycoproteins in the erythrocyte membrane were measured after staining with Coomassie brilliant blue (CBB) and quantified for band 3 in gel surround area from 220 kDa to 60 kDa set to 100% in control by Image J (National Institutes of Health, Medical soft, USA) [Citation8]. Fragments of band 3, spectrin, and ankyrin were confirmed by western blotting using anti-band 3, anti-spectrin, and anti-ankyrin antibodies (Santa Cruz Biotechnology, Inc., USA). To determine the absolute volume of band 3 conjugated with N-linked glycan, N-linked glycans (saccharide chain) conjugated to band 3 protein were removed using protease inhibitor and N-glycosidase F (3 μL; Roche Diagnostics, USA). Band 3 protein was then quantified by CBB staining and western blotting.
Next, erythrocyte floating liquid (100 μL) or patient red blood cells were washed with PBS (pH 7.2) and labelled with eosin-5'-maleimide (EMA) at 4°C for 20 min. EMA-labelled band 3 protein on the extracellular erythrocyte membrane was then detected by chemical modification using a Confocal laser microscope (Olympus Co. Fluoview FVl0i-O, Japan) [Citation9]. Brightness was calculated for 30 red blood cells, and the values were averaged. The control was set at 100%, using Image J. The intracellular domain of band 3 protein was detected by the indirect immunostaining method. Briefly, 200 μL of patient red blood cells was fixed in 4% paraformaldehyde for 20 min and then permeabilized with 0.3% Triton X at room temperature. The cells were treated with anti-band 3 monoclonal antibodies overnight, and staining was visualized with FITC-labelled secondary antibodies. The red cells were observed by laser confocal microscopy (Olympus microscope) (). Tryptic peptides from the area of band 3 by SDS-PAGE were analysed with matrix-assisted laser desorption ionization time-of-flight mass spectrometry (MALDI-TOFMS) (Bruker Co. Auto FlexⅡ, Germany) [Citation10].
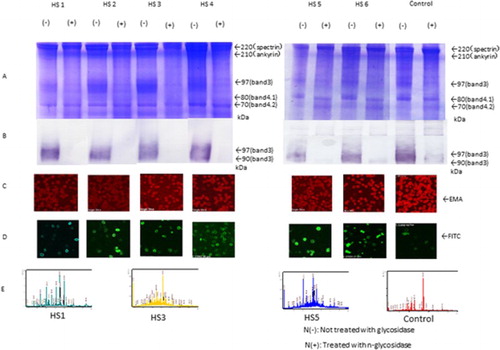
Figure 1. SDS-PAGE, western blotting, EMA, and immunostaining (FITC) of red blood cells of HS (pre-splenectomy) cases using EMA and anti-band 3 antibodies. Sequence coverage in the band 3 area was determined by mass spectrometry. (A and B) Amounts of band 3 protein in red blood cells, as determined by SDS-PAGE and western blotting in patients before splenectomy (HS1 and HS5) and other patients (HS2, HS3, HS4, and HS6). Expression with and without N-glycosidase treatment N(+) and not treatment N(−) is shown in (B). (C) EMA staining. (D) FITC staining of the intracellular domain of band 3. (E) Spectrum patterns from mass spectrometry.
Results
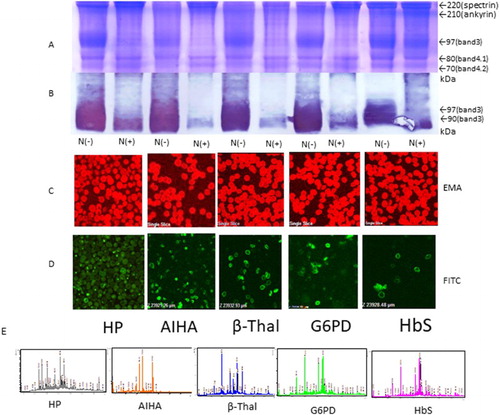
All of the patients with haemolytic anaemia had major glycoprotein of spectrin, ankyrin, band 3, protein band 4.1, and band 4.2 by SDS-PAGE and were compared with healthy controls. Patients with pre-splenectomy HS were classified into two groups according to band 3 volume and EMA brightness. Two patients showed moderate low band 3 volume in cases HS2 and HS5 (75% and 84% compared with controls) and slightly in cases HS1, HS3, HS4, and HS6 (86%, 88%, 86% and 85%, compared with controls). Two patients showed moderate dim pattern EMA brightness in cases HS1 and HS2 (80% and 75%) and slightly dim pattern in HS3, HS4, HS5, and HS6 compared with controls (, ). In contrast, in patients with HS post-splenectomy, other types of haemolytic anaemia, and in healthy controls, the amount of band 3 was not decreased, as shown by SDS-PAGE ( and ). Inclusion bodies were stained with EMA brilliantly in Hb Evans and Hb Sabine seem to be those complex conjugated denatured haemoglobin (inclusion body) with band 3. Intracellular band 3 domain by FITC-labelled anti-band 3 antibody showed a thick ring-like shape but the other showed a thin ring-like shape. The bands (band 3 and spectrin) for patients with HS nearly disappeared in band 3 only after deglycosylation by N-glycosidase F; however, patients with other types of haemolytic anaemia and healthy controls showed a narrow band of 90 kDa near the region of band 3 (97 kDa) by western blotting ().
Figure 2. EMA and immunostaining (FITC) of red blood cells of post-splenectomy cases at 5–10 years using EMA and anti-band 3 antibodies. Spectrum pattern form mass spectrometry and detection of fragments of band 3, spectrin, and ankyrin by western blotting using those antibodies (A–H). (A and B) Amounts of band 3 protein in red blood cells were determined by SDS-PAGE and western blotting, with N+ and without N− glycosidase treatment. (C) EMA staining. (D) Immunostaining of the intracellular domain of band 3 in post-splenectomy cases. (E) Spectrum pattern from mass spectrometry HS7 and control. Fragments of band 3 (F), spectrin (G), and ankyrin (H) detected by anti-band 3, anti-spectrin, and anti-ankyrin antibodies, respectively.
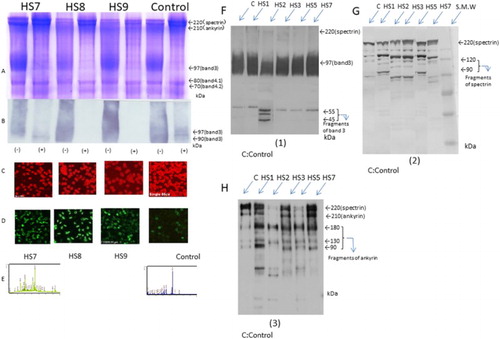
Figure 3. SDS-PAGE, western blotting, EMA, and immunostaining (FITC) of red blood cells of patients with other congenital haemolytic anaemia’s using EMA and anti-band 3 antibodies and spectrum pattern from mass spectrometry. (A and B) Amounts of band 3 protein in red blood cells were determined by SDS-PAGE and western blotting, with N(+) and without N-glycosidase N(−) treatment. (C) EMA staining. (D) FITC staining of the intracellular domain of band 3. (E) Spectrum patterns from mass spectrometry.
The changes in band patterns were thought to be associated with deglycosylation of N-glycans by N-glycosidase F. However, after deglycosylation by N-glycosidase F, the band 3 patterns of patients with HS pre- or post-splenectomy disappeared at 97 kDa. These findings suggest that band 3 glycoprotein from patients with HS could be easily decomposed by N-glycosidase F ( and ).
Next, we evaluated the intracellular domain of band 3 protein of the erythrocyte membrane in each patient using FITC labelling and anti-band 3 antibody staining. The intracellular domain of band 3 proteins in patients with HS, pre-, and post-splenectomy were thickly stained in a ring-shaped pattern. However, in patients with other types of haemolytic anaemia and healthy controls, staining in a thin, ring-like pattern was observed (). Furthermore, there were no differences in FITC-labelled images between patients with HS pre- and post-splenectomy. Notably, in patients with HS1, 4 weeks after splenectomy, the expression of spectrin and band 3 by SDS-PAGE and EMA brightness were slightly increased. These changes may be related to erythrocytes released from compression of passing into the spleen and damage of spectrin, ankyrin, and band 3 were decreased ().
The tryptic peptide fingerprinting method using MALDI-TOFMS showed interactions between low-molecular-weight (degraded) spectrin and ankyrin in the area of band 3 separated by SDS-PAGE in the pre-splenectomy patient with HS and two patients with β-Thal in only ankyrin also showed haemoglobin-derived peptides in a patient with post-splenectomy Hb Evans and Hb Sabine were detected after 2000 m/z area calculated by Mascot search analysis soft (Matrix Science Co) sequence percentage of those peptides (). Similarly, western blotting analysis showed that degraded spectrin fragments were found at 120 and 90 kDa in cases HS1(pre-splenectomy stage), HS3, HS5, and were shown in very small quantity in HS7, HS8, HS9, and HS10 with post-splenectomy cases. Degraded fragments of band 3 protein were also detected in several bands at 44–55 kDa in HS2. Degraded ankyrin fragment was found at 180, 130, and 90 kDa, in HS1, HS3, HS5, and HS7. However, this ankyrin antibody also reacted to the 220 kDa and degraded 90 kDa spectrin in addition to the original ankyrin molecule 200 kDa. It was thought to be an antibody indicate cross-reactivity showing. It is considered to be consistent with the response of the peptide wave pattern after 2000 m/z in HS1 (pre-splenectomy stage), HS3, HS5, and HS7. Two patients with β-Thal also showed the ankyrin peptide, although this was not detected in the patient with haemolytic anaemia or in the controls (, –).
Ankyrin gene anomaly in Case 1 (ANK-1, frameshift, deletion c.1033 delG:p, A345fs441 heterozygote state) and in Case5 (ANK-1, frameshift, deletion c.382-6 del AACTT p.K128F fsX7 heterozygote state), and Spectrin gene anomaly in Case3 (SPTB, frameshift deletion c.4149-50ins G, p. R1384AfsX7 heterozygote state) and in Case7 (SPTB, missense mutation c. 5455G > T, p. E1819X heterozygote state)(;).
Discussion
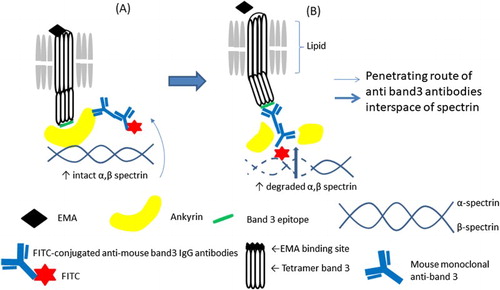
HS patients account for 60% of cases of total congenital haemolytic anaemia. HS is characterized by a protein abnormality like hinge called ankyrin, which connects erythrocyte spectrin inside the skeletal membrane and the integral inner membrane band 3 protein. Ankyrin abnormalities have been reported in Western countries. However, in Japan, HS cases with ankyrin abnormalities are rare owing to a small percentage and had severe anaemia [Citation2]. Although the abnormality may be identified using SDS-PAGE, detection is challenging because the ankyrin protein, despite its large molecular weight, exhibits a thin band image directly under spectrin; therefore, qualitative abnormality genetic testing may be required for diagnosis [Citation11]. Furthermore, the EMA binding test has been reported to decrease in cases where abnormalities of spectrin and ankyrin are identified by genetic testing [Citation4]. The staining intensity of erythrocytes decreases in the EMA binding test. This is because the amount of band 3 decreases with decreases in the amount of lysine residue to which EMA binds on the band 3 protein on the erythrocyte extracellular membrane. Although the EMA binding test decreases naturally, it is thought that even abnormalities of spectrin and ankyrin are due to the decrease in the binding force of these proteins which fix intracellular band 3 to the erythrocyte membrane [Citation12]. In addition, it has also been reported that ankyrin abnormalities affect the production of another erythrocyte membrane protein known as the Rh antigen [Citation13]. Essentially, there is less lysine residue on the extracellular band 3 protein, or the position of the band 3 itself has undergone a rotational change and buried, or because the binding force by spectrin and ankyrin which should attract this is weak, band 3 is detached from the erythrocyte membrane [Citation14]. Furthermore, the splenic circulation may reflect the presence of lysine residues of band 3 exposed on the red blood cell surface and induction of ankyrin and spectrin degradation observed in the band 3 area by our mass spectrometry analysis. Therefore, the erythrocyte lipids in patients with HS may be dysfunctional, and the band 3 protein of HS may be released from degraded ankyrin or spectrin into the splenic circulation, resulting in the loss of band 3 protein [Citation15]. Also, because band 3 protein exists between lipid bilayers, we assumed that the three-dimensional structure of the band 3 polypeptide chain may have undergone a conformational change ().
Figure 4. A model of the reduced EMA staining and enhanced binding of the monoclonal antibody to the intracellular epitope of band 3 protein if red blood cells in pre-splenectomy HS. (A) Pre-circulation in the spleen; (B) post-circulation in the spleen.
In this study, we confirmed the changes of extracellular band 3 protein by EMA binding test and intracellular domain of band 3 protein by staining of FITC labelling anti-band 3 antibody in patients with HS. Our results showed that there was abundant localization of band 3 protein intracellular erythrocyte membrane, possibly because spectrum and ankyrin degradation results in many gap spaces in combination of spectrin and antibodies reach the intracellular domain of band 3 in patients with HS. Furthermore, HS2 showed a decrease in the amount of band 3 protein and spectrin, ankyrin peptide did not appear in the band 3 area, and several bands of fragmented band 3 were confirmed. It seems that the amount of band 3 decreased because of fragility of the band 3 protein itself exists and also the phenomenon was observed.
We confirmed clinical and haematological differences between HS1 and HS5 with ankyrin gene anomaly (ANK-1) and HS3 and HS7 (gall bladder resection was performed for gallstones coincidence splenectomy at 14 years old) with β-spectrin anomaly (SPTB), the former had severe anaemia and the latter had mild anaemia with hyperbilirubinemia. It seems to useful information for adaptation of splenectomy [Citation16,Citation17]. However, the spectrin and ankyrin tended to be degraded to a greater extent in pre-splenectomy patients with HS than in post-splenectomy patients, suggesting an association with blood circulation through the spleen. However, after deglycosylation with N-glycosidase F, band 3 disappeared in patients with HS, regardless of whether the patient had undergone splenectomy, suggesting that this change may be not related to the effects of passing through the spleen. N-glycosidase was thought to strongly reflect band 3 protein of HS and it was suspected to easily cut off the peptide bond of amino acids themselves simultaneously conjunctive site of N-glycan in band 3 protein and peptides although pre-treatment of protease inhibitor or HS patients had high amount of intrinsic membrane protease against for band 3protein rather than other haemolytic anaemia and controls. Furthermore, differences in both band 3 and spectrin were observed among patients with HS pre- and post-splenectomy, suggesting that changes in erythrocytes passing through the spleen may reflect the stability of erythrocyte membrane glycoproteins. Denatured haemoglobin (inclusion body) was found in erythrocytes as a haemoglobin abnormality without of normality of erythrocyte membrane Hb Evans and Hb Sabine also identified haemoglobin not only in the band 3 area but also in the spectrin area because denatured haemoglobin bound to the spectrin and band 3 of the erythrocyte and the membrane properties were changed. As a result, membrane damege developed and erythrocyte were those it to be haemolysis after splenectomy, the mobility of the erythrocytes worsened during circulation in the body. The findings of this study provided important insights into the stability and role of the band 3 protein influenced with ankyrin and spectrin protein in patients with HS.
Acknowledgements
We are grateful to Professor Hitoshi Kanno (Tokyo Women’s Medical University) for gene analysis of hereditary spherocytosis membrane protein and to Professor Akio Harano (Kawasaki University of Medical Welfare) for gene analysis of hemoglobinopathy and thalassemia.
Disclosure statement
No potential conflict of interest was reported by the authors.
ORCID
Atsushi Shibuya http://orcid.org/0000-0001-8206-2288
References
- Tanner MJ. Molecular and cellular biology of the enythrocyte anion exchanger (AE1). Semin Hematol. 1993;30:34–57.
- Yawata Y, Kanzaki A, Yawata A, et al. Hereditary red cell membrane disorders in Japan: their genotypic and phenotypic features in 1014 cases studied. Hematology. 2001;6:399–422. doi: https://doi.org/10.1080/10245332.2001.11746596
- Smythe J, Spring F, Gardner B, et al. Monoclonal antibodies recognizing epitopes on the extracellular face and intracellular N-terminus of the human erythrocyte anion transporter (band 3) and their application to the analysis of South East Asian ovalocytes. Blood. 1995;85:2929–2936.
- Nakanishi H, Kanzaki A, Yawata A, et al. Ankyrin gene mutations in Japanese patients with hereditary spherocytosis. Int J Hematol. 2001;73:54–63. doi: https://doi.org/10.1007/BF02981903
- Bruce LJ, Beckmaum R, Ribeiro ML, et al. A band 3-based macrocomplex of integral and peripheral proteins in the RBC membrane. Blood. 2003;101:4180–4188. doi: https://doi.org/10.1182/blood-2002-09-2824
- Hamasaki N, Yamamoto M. Red blood cell function and blood storage. Vox Sang. 2000;79:191–197. doi: https://doi.org/10.1046/j.1423-0410.2000.7940191.x
- Laemmli UK. Cleavage of structural proteins during the assembly of the head of bacteriophage T4. Nature. 1970;227:680–685. doi: https://doi.org/10.1038/227680a0
- King MJ, Jepson MA, Guest A, et al. Detection of hereditary pyropoikilocytosis by the eosin-5-maleimide (EMA)-binding test is attributable to a marked reduction in EMA-reactive transmembrane proteins. Int J Lab Hematol. 2011;33:205–211. doi: https://doi.org/10.1111/j.1751-553X.2010.01270.x
- King M-J, Telfer P, MacKinnon H, et al. Using the eosin-5’-maleimide binding test in the differential diagnosis of hereditary spherocytosis and hereditary pyropoikilocytosis. Cytometry B Clin Cytom. 2008;74B:244–250. doi: https://doi.org/10.1002/cyto.b.20413
- Yang X, Wu H, Kobayashi T, et al. Enhanced ionization of phosphorylated peptides during MALDI TOF mass spectrometry. Anal Chem. 2004;76:1532–1536. doi: https://doi.org/10.1021/ac035203v
- Palek J, Jarolim P. Clinical expression and laboratory detection of red blood cell membrane protein mutations. Semin Hematol. 1993;30:249–283.
- Hassoun H, Vassiliadis JN, Murray J, et al. Molecular basis of spectrin deficiency in beta spectrin Durham. A deletion within beta spectrin adjacent to the ankyrin-binding site precludes spectrin attachment to the membrane in hereditary spherocytosis. J Clin Invest. 1995;96:2623–2629. doi: https://doi.org/10.1172/JCI118327
- Satchwell TJ, Bell AJ, Hawley BR, et al. Severe ankyrin-R deficiency results in impaired surface retention and lysosomal degradation of RhAG in human erythroblasts. Haematologica. 2016;101:1018–1027. doi: https://doi.org/10.3324/haematol.2016.146209
- Walensky LD, Nala M, Lux SE. Disorders of the red blood cell membrane. In: Handin RI, Lux SE, Stossel TP, editors. Blood: Principles and practice of hematology, 2nd ed. Philadelphia (PA): Lippincott Williams Wilkins; 2003. p. 1709–1858.
- Eber S, Lux SE. Hereditary spherocytosis – defects in proteins that connect the membrane skeleton to the lipid bilayer. Semin Hematol. 2004;41:118–141. doi: https://doi.org/10.1053/j.seminhematol.2004.01.002
- Bolton-Maggs PH, Stevens RF, Dodd NJ, et al. Guidelines for the diagnosis and management of hereditary spherocytosis. Br J Haematol. 2004;126:455–474. doi: https://doi.org/10.1111/j.1365-2141.2004.05052.x
- King MJ, Garçon L, Hoyer JD, et al. ICSH guidelines for the laboratory diagnosis of nonimmune hereditary red cell membrane disorders. Int J Lab Hematol. 2015;37:304–325. doi: https://doi.org/10.1111/ijlh.12335