
ABSTRACT
Objectives: In myelodysplastic syndrome (MDS), the prognostic role of monosomal karyotype (MK), defined as at least two autosomal monosomies or a single monosomy associated with at least one additional structural abnormality, remained controversial. Therefore, we conducted a meta-analysis to address this issue.
Methods: PubMed, Embase, Web of Science, Medline, and the Cochrane Library were retrieved. We extracted hazard ratios (HRs) and the corresponding 95% confidential intervals (CIs) for overall survival (OS) on patients with MK versus those without, as well as on MK patients with monosomies of chromosome 7 and/or 5 versus those without from the available studies.
Results: Seventeen studies covering 7500 patients were included this meta-analysis. The pooled HRs indicated MK had a negative impact on OS in MDS (pooled HR: 2.484, 95%CI: 2.033–3.036, P < .001), in MDS patients undergoing allogeneic hematopoietic stem cell transplantation (allo-HSCT) (pooled HR: 2.150, 95%CI: 1.861–2.48, P < .001), and in MDS with complex karyotype (CK) (pooled HR: 2.56, 95%CI: 2.032–3.036, P = .01). However, monosomies of chromosome 5 and/or 7 had no impact on OS in MDS with MK (pooled HR: 1.330, 95%CI: 0.827–2.139, P = .240). Meta-regression indicated that therapy was the origin of the heterogeneity (P = .012).
Discussion: Our meta-analysis indicated that MK has a negative impact on OS in MDS, in MDS patients undergoing allo-HSCT, and MDS with CK, but monosomies of chromosome 5 and/or 7 have no impact on OS in MDS with MK. The heterogeneity reflected the biologic and therapeutic heterogeneity of MDS.
Conclusion: MK is associated with poor prognosis in MDS, the underlying mechanism needs further exploring.
Introduction
Myelodysplastic syndrome (MDS) is a group of heterogeneous clonal hematopoietic disorders characterized by dysplastic morphologic features of bone marrow and blood cells, the presence of cytopenia, and a predisposition to acute myeloid leukemia (AML) [Citation1,Citation2]. Karyotype plays an important role in the prognostic categorization of MDS and is utilized in several scoring systems, including the WHO classification-based Prognostic Scoring System (WPSS), the International Prognostic Scoring System (IPSS), and the revised IPSS (IPSS-R), for risk-stratification [Citation3-5].
The conception of monosomal karyotype (MK), defined as at least two autosomal monosomies or a single autosomal monosomy associated with at least one additional structural abnormality, was first proposed by Breems et al. in 2008 [Citation6]. In AML, MK defines a subgroup of the most dismal prognosis [Citation6,Citation7]. However, its prognostic role in MDS has still remained controversial. Several studies indicated that MK served as an independent negative predictor of overall survival (OS) in MDS [Citation8-12]. But in the study conducted by Schanz et al. [Citation13] MK was associated with inferior OS in patients with ≤4 abnormalities only, not in highly complex karyotypes (≥5 abnormalities). In other studies, MK demonstrated negative impact on OS but was not identified as an independent risk factor [Citation14-16]. MK is considerably overlapped with complex karyotype (CK, defined as at least three cytogenetic abnormalities). Some studies indicated that MK was associated with a significantly inferior OS in MDS with CK, [Citation8,Citation10,Citation17] but others did not yield similar outcomes [Citation14,Citation15,Citation18,Citation19]. Additionally, Monosomies of chromosome 5 and/or 7 were the most frequent monosomies in MK, [Citation20] and several studies reported their controversial impact on OS in MDS with MK [Citation14,Citation18-20].
To further address the prognostic significance of MK in MDS, we conducted this meta-analysis. Although chronic myelomonocytic leukemia (CMML) has been excluded from the MDS category by WHO classification, some studies still included CMML patients, [Citation11,Citation13] so we also focused on the prognostic role of MK in CMML.
Materials and methods
Literature search and search strategy
A systemic literature search of PubMed, Embase, Web of Science, Medline, and the Cochrane Library was conducted with the following search terms: ‘monosomal karyotype’ or ‘MK’ and ‘myelodysplastic syndrome’ or ‘MDS’ or ‘myelodysplasia’ or ‘preleukemia’ or ‘chronic myelomonocytic leukemia’ or ‘CMML’. The search was restricted to human study, free articles, with the language limited to English. Relevant papers published between 2008 and 2017 were obtained by two independent reviewers (Y.W. and X.Z.). We also reviewed the references for missing information.
We included the researched papers fulfilling the following criteria: (1) the diagnosis of MDS was based on the World Health Organization (WHO) 2008 criteria or the French-American-British (FAB) criteria; (2) published between January 1, 2008 and December 31, 2017 as original articles; (3) assessed the association between the MK status and the OS in MDS, or the association between the monosomies of chromosome 5 and/or 7 status and the OS in MDS with MK; (4) offered detailed survival information for us to extract or calculate the hazard ratios (HRs) with the corresponding 95% confidential intervals(CIs) of OS in patients with MK versus those without, as well as MK patients with monosomies of chromosome 5 and/or 7 versus those without; (6) for the studies reported in duplication, the one published more recently or provided more detailed information was included. MK was defined as at least two autosomal monosomies or a single autosomal monosomy associated with at least one additional structural abnormality. CK was defined as at least three cytogenetic abnormalities. OS was measured from the date of the first karyotype analysis to the time of death from any causes or at the last follow-up (censored). Studies published in abstract form, review article, case report, or studies with unavailable or incomplete data were excluded.
Data extraction
Two reviewers (Y.W. and X.Z.) independently extracted data from the included studies. Disagreement was resolved by discussion until a consensus was achieved. The following data were extracted from the studies: the name of the first author, year of publication, journal, number of patients, age, criteria for classification of MDS and CMML, therapy, period of follow-up, number of patients with MK, and HRs with the corresponding 95% CIs for the OS based on the MK or the monosomies of chromosome 5 and/or 7 status. If the HRs with the corresponding 95% CIs were not available, we calculated survival data from the Kaplan–Meier survival curves or the available data using methods reported by Parmar et al. [Citation21]. If several HRs were provided in the same study, we adopted the most accurate one (multivariate analysis superior to univariate analysis, and univariate analysis superior to Kaplan–Meier analysis).
Quality assessment
Two reviewers (Y.W. and X.Z.) independently assessed the study quality. The Newcastle-Ottawa (NOS) [Citation22] was used to score the quality of each study. This scale has nine items classified into the following three major categories: selection (four items), comparability (two items) and outcome (three items). The overall quality score was classified into the following three types: high quality (7–9 scores), intermediate quality (4–6 scores), and low quality (1–3 scores). Any discrepancy was resolved by consensus.
Statistical analysis
All statistical analyses were performed using STATA version 12 software (College Station, TX, U.S.A.). The statistical heterogeneity between the included studies was assessed by the I2 and the Q statistics (I2 = 0–25%, no heterogeneity; I2 = 25–50%, moderate heterogeneity; I2 = 50–75%, large heterogeneity; I2 = 75–100%, extreme heterogeneity). When the heterogeneity across studies was identified (I2 > 50%), the random-effects model (the DerSimonian and Laird method) was chosen; otherwise, the fixed-effects model (the Mantel–Haenszel method) was chosen. Sensitivity analysis was conducted to test the influence of one single study on the stability of the overall meta-analysis. Subgroup analyses and meta-regression were performed to investigate the potential origin of heterogeneity. Begg’s and Egger’s tests were used to assess the possible publication bias [Citation23,Citation24]. A two-tailed P-value of less than .05 was considered statistically significant. All the statistical analyses were done by Y.W. and X.Z.
Results
Study selection and characteristics
As shown in the , 426 records were obtained by a systemic literature research. After excluding 180 duplicates, 246 records remained for further screening. By reading the titles and reviewing the abstracts, we excluded unrelated studies (n = 212) and reviews (n = 4). Thus, 30 records remained for full-text screening. After carefully reading the full texts, 13 studies were excluded due to insufficient data. Finally, 17 studies, [Citation8–20,Citation25–28] including a letter to the editor [Citation18] were included in this meta-analysis.
Figure 1. Flow diagram of selection process in the meta-analysis.
Individual characteristics of the 17 included studies were summarized in . All the 17 eligible studies were retrospective ones. The studies were published between 2011 and 2017, and covered 7500 MDS patients, including 1241 patients with MK. The sample size ranged from 79 to 1404, and the frequency of MK varied from 2.7% to 83.5%. After excluding 1 study on patients with CMML only, [Citation28] 2 studies on patients with CK only, [Citation17,Citation18] and 1 study on patients with ≥ 2 cytogenetic abnormalities only, [Citation13] the frequency of MK varied from 6.4% to 37%. The study conducted by Xing et al. [Citation9] included 610 patients, however, follow-up data were only available in 390 patients who received nonintensive therapies and extracted for this meta-analysis. Of the 17 eligible studies, 5 studies were from North America, [Citation17,Citation25–28] 5 from Europe, [Citation13,Citation14,Citation16–18] 6 from Asia, [Citation9,Citation11,Citation12,Citation15,Citation19,Citation20] 1 from Oceania [Citation10]. The median age in 6 studies was over 60 years, [Citation10,Citation13–15,Citation17,Citation19] in 7 studies under 60 years, [Citation11,Citation12,Citation16,Citation20,Citation25–27] and in 4 studies not available [Citation8,Citation9,Citation18,Citation28]. In 10 studies patients were classified by WHO criteria, [Citation9,Citation10,Citation15,Citation17,Citation19,Citation25,Citation27] in 1 study by FAB criteria, [Citation28] in 5 studies by both WHO and FAB criteria, [Citation8,Citation13,Citation16,Citation20,Citation26] but classification criteria were not available in 1 study [Citation18]. Patients in 7 studies were treated with allogenetic hematopoietic stem cell transplantation (allo-HSCT), [Citation8,Citation11,Citation12,Citation16,Citation25–27] in 2 studies with hypomethylating agents (HMAs), [Citation15,Citation18] in 1 study were untreated, [Citation13] and in 4 studies were treated with various therapies, from the most conservative best supportive care (BSC) to the most aggressive HSCT, or a blend of several therapies [Citation9,Citation14,Citation19,Citation20]. But therapy information was not available in 3 studies [Citation10,Citation17,Citation28]. In the 17 eligible studies, NOS scores were from 6 to 8 (median 7) ().
Table 1. Characteristics of the included 17 studies.
Table 2. Quality assessment of individual Study.
Outcomes of the meta-analysis
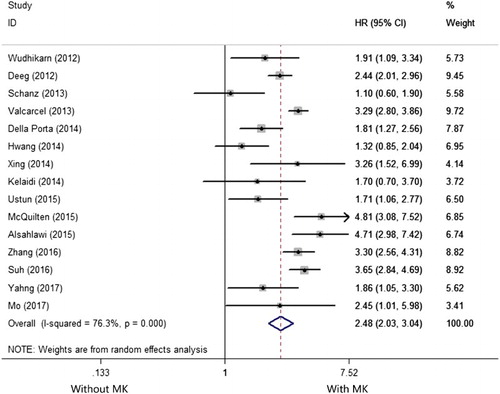
Fifteen studies reported the prognostic impact of MK in MDS [Citation8–16,Citation19,Citation20,Citation24–27]. There was an extreme heterogeneity among the 15 included studies (I2 =76.3%, P < .001) so that a random-effects model was applied to evaluate the pooled HR. As shown in the , the pooled HR for OS was 2.484 (95%CI: 2.033–3.036) for patients with MK versus those without (P < .001), suggesting MK has a negative impact on OS in MDS.
Figure 2. Forest plots of the HRs and the 95% CIs of the association between MK and OS in MDS. The size of the blocks or diamonds represents the weight and the length of the straight line represents the width of 95% CI.
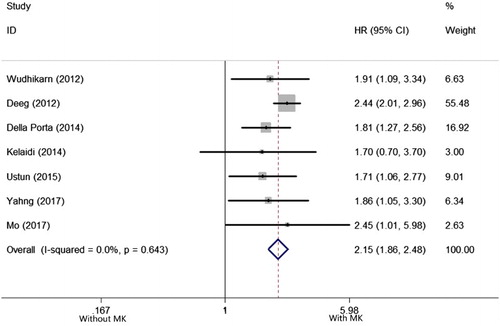
Seven studies reported the prognostic impact of MK in MDS patients undergoing allo-HSCT [Citation8,Citation11,Citation12,Citation16,Citation25–27]. There was no heterogeneity among the 7 included studies (I2 = 0.0%, P = .643), so that a fixed-effects model was applied to evaluate the pooled HR. As shown in the , the pooled HR for OS was 2.150 (95%CI: 1.861–2.483), for patients with MK versus those without (P < .001), suggesting MK has a negative impact on OS MDS patients undergoing allo-HSCT.
Figure 3. Forest plots of pooled HRs and 95% CIs of association between MK and OS in MDS patients undergoing allo-HSCT. The size of the blocks or diamonds represents the weight and the length of the straight line represents the width of 95% CI.
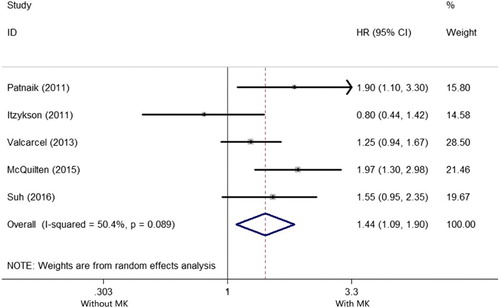
Five studies reported the prognostic impact of MK in MDS with CK [Citation10,Citation14,Citation17–19]. There was a large heterogeneity among the 5 included studies (I2 = 50.4%, P = .089), so that a random-effects model was applied to evaluate the pooled HR. As shown in the , the pooled HR for OS was 2.56 (95%CI: 2.032–3.036) for patients with MK versus those without (P = .01), suggesting MK has a negative impact on OS in MDS with CK.
Figure 4. Forest plots of pooled HRs and 95% CIs of association between MK and OS in MDS with CK. The size of the blocks or diamonds represents the weight and the length of the straight line represents the width of 95% CI.
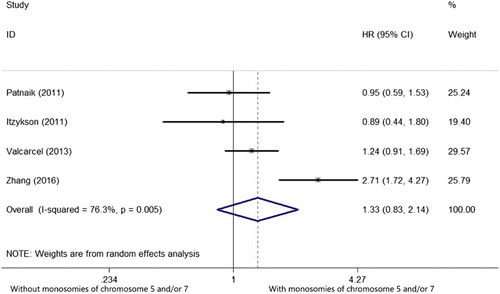
Four studies reported the prognostic impact of monosomies of chromosome 5 and/or 7 in MDS with MK [Citation14,Citation18–20]. There was an extreme heterogeneity among the 4 included studies (I2 = 76.3%, P = .005), so that a random-effects model was applied to evaluate the pooled HR. As shown in the , the pooled HR of OS was 1.330 (95%CI: 0.827–2.139, P = .240), suggesting monosomies of chromosome 5 and/or 7 have no prognostic impact on OS in MDS with MK.
Figure 5. Forest plots of pooled HRs and 95% CIs of association between monosomies of chromosome 5 and/or 7 and OS in MDS with MK. The size of the blocks or diamonds represents the weight and the length of the straight line represents the width of 95% CI.
Subgroup analysis and meta-regression
As there was an extreme heterogeneity among the 15 included studies for the meta-analysis of OS in MDS, we conducted subgroup analyses to explore the origin of the heterogeneity. The effect sizes were similar among the subgroups divided by region, sample size, median age, therapy and survival analysis. To investigate the effects of various study characteristics on the HR estimates, a meta-regression analysis was conducted by subgroups. The P values for study region, sample size, median age, therapy and survival analysis were .613, .065, .817, .012, .498 respectively, indicating therapy was the origin of the heterogeneity ().
Table 3. Subgroup analyses for OS in MDS regarding region, sample size, median age, therapy and survival analysis.
Sensitivity analysis and publication bias
To address the potential bias due to the quality of the included studies, we performed the sensitivity analysis by calculating pooled HR again when omitting one study each time. AS shown in the , the results did not show significant differences when any study was omitted, indicating that every single study did not influence the stability of the association between MK and OS in MDS. The funnel plot did not show evidence of asymmetry ((a)). According to Begg’s and Egger’s test, there was no evidence of publication bias (Begg’s test P = .553, Egger’s test P = .142, ).
Figure 6. Sensitivity analysis for individual studies on the pooled HR of OS in MDS. The results were computed by omitting each study in turn. Meta-analysis random-effects estimates (exponential form) were used. The two ends of the dotted lines represent the 95% CI.
Figure 7. Publication bias tests for OS in MDS. (a) Begg’s funnel plot. Each dot represents a separate study and the horizontal line represents the mean effect size. Studies are distributed symmetrically, suggesting there is no significant bias exist. (b) Egger’s linear regression test. Each dot represents a separate study and the oblique line represents the mean effect size. Studies are distributed symmetrically, suggesting there is no significant bias exist.
Discussion
MK has proven to be a predictor of the worst prognosis in AML [Citation6,Citation7]. Initially in 2008, the HOVON-SAKK group reported that in AML patients aged between 15 and 60 years, patients with MK had a 4-year OS of 4%;[Citation6] subsequently, the SWOG study also reported that in AML patients aged between 16 and 88 years, patients with MK had a 4-year OS of 3%, compared with a 4-year OS of 13% in patients with an unfavorable karyotype but without MK [Citation7]. Although many studies have assessed the prognostic impact of MK in MDS, the results are inconsistent [Citation8–20,Citation25–28]. Xing et al. [Citation9] indicated that MK was an independent negative risk of OS in MDS. By contrast, the Spanish group of MDS (GESMD) analyzed 1054 MDS patients with an abnormal karyotype. In univariate analysis, MK was associated with a significantly lower OS, but this effect did not persist in multivariate analysis [Citation14]. Similarly, Schanz et al. [Citation13] conducted a study on 431 untreated MDS patients with ≥ 2 chromosome abnormalities, and also did not deem MK as an independent prognostic factor in MDS. To exactly delineate the prognostic impact of MK in MDS, we conducted this meta-analysis.
In the present analysis, 17 studies covering 7500 patients were included. In the 15 studies on the prognostic impact of MK in MDS, the pooled HR was 2.484 (95%CI: 2.033–3.036, P < .001), indicating MK significantly negatively affects the OS in MDS. Though an extreme heterogeneity occurred (I2 = 76.3%, P < .001), the sensitivity analysis indicated the stability of our analysis, demonstrating the reliability of the result. Our result was in line with Xing et al. [Citation9] and other studies. Also, we found even allo-HSCT, the only potentially curable method so far, could not overcome the negative impact of MK in MDS (pooled HR: 2.150, 95%CI: 1.861–2.483, P < .001).
In MDS, CK is categorized into poor karyotype [Citation3–5]. In MDS with CK, the frequency of MK varied from 73% to 83.9% [Citation14,Citation17,Citation18]. Some studies reported controversial results of the prognostic impact of MK in MDS with CK [Citation8,Citation10,Citation14,Citation15,Citation17–19]. In our meta-analysis, 5 studies were included and the pooled HR was 2.56 (95%CI: 2.032–3.036, P = .01). Our result was consistent with those of McQuilten et al. [Citation10] and Patnaik et al. [Citation17] indicating MK defines a subgroup of even worse prognosis in MDS with CK.
Monosomies of chromosome 5 and/or 7 were the most frequent monosomies in MDS, [Citation20] the latter is also categorized to poor karyotype [Citation3–5]. In our meta-analysis, the pooled HR was 1.330 (95%CI: 0.827–2.139, P = .240), indicating monosomies of chromosome 5 and/or 7 do not negatively impact OS in MDS with MK.
Our study confirmed that MK is associated with significantly low OS in MDS, but the underlying mechanism has been still unclear. In AML, deletions or mutations of TP53 gene may be responsible for the inferior prognostic impact of MK [Citation29]. However, there has been no study reporting similar result in MDS to date. In the study conducted by McQuilten et al., the prognostic effect of MK decreased with increasing cytogenetic complexity [Citation10]. Similarly, Schanz et al. revealed that MK demonstrated prognostic effect only in patients with ≤4 abnormalities, but not in those with highly complex karyotype (≥5 abnormalities) [Citation13]. It seems that in MDS, the instability of cytogenetics can influence the prognosis more than the presence of MK, but the hypothesis needs further confirming.
Our study is the first meta-analysis evaluating the prognostic impact of MK in MDS. However, there were still some limitations in our meta-analysis. First, all the included studies are retrospective ones, rather than prospective ones. Second, though we used comprehensive searching strategy, missing relevant studies were unavoidable, especially those published in langue other than English. Third, some studies did not provide HRs with corresponding 95%CIs directly, so we had to extract them from the Kaplan–Meier survival curves, which crippled the accuracy of data. Fourth, there was an extreme heterogeneity when calculating the pooled HR for MK in MDS. Through the meta-regression analysis, we found different therapies were the origin of the heterogeneity. MDS comprises a group of highly heterogenetic disorders, and various therapies are applied, yielding various outcomes. Comparatively, most transplanted patients are of higher risk, better general status, and less complications. So we considered that the heterogeneity reflected the biologic and therapeutic heterogeneity of MDS. Finally, more than 30% patients were transplanted, this rate was over the reality of MDS therapy, and suggested potential therapeutic bias in this meta-analysis.
In conclusion, our meta-analysis indicated that MK has a negative impact of OS in MDS, in MDS patients undergoing allo-HSCT, and in MDS with CK, but monosomies of chromosome 5 and/or 7 do not in MDS with MK. Studies on the underlying mechanism responsible for the inferior prognostic impact of MK in MDS are urgently needed.
Acknowledgments
We thank all the patients and the clinical investigators who were involved in the studies selected for the meta-analysis.
Disclosure statement
No potential conflict of interest was reported by the author(s).
Related Research Data
References
- Tefferi A, Vardiman JW. Myelodysplastic syndromes. N Engl J Med. 2009;361(19):1872–1885. doi: 10.1056/NEJMra0902908
- Nimer SD. Myelodysplastic syndromes. Blood. 2008;111(10):4841–4851. doi: 10.1182/blood-2007-08-078139
- Malcovati L, Della Porta MG, Strupp C, et al. Impact of the degree of anemia on the outcome of patients with myelodysplastic syndrome and its integration into the WHO classification-based prognostic scoring system (WPSS). Haematologica. 2011;96(10):1433–1440. doi: 10.3324/haematol.2011.044602
- Greenberg P, Cox C, LeBeau MM, et al. International scoring system for evaluating prognosis in myelodysplastic syndromes. Blood. 1997;89(6):2079–2088.
- Greenberg PL, Tuechler H, Schanz J, et al. Revised international prognostic scoring system for myelodysplastic syndromes. Blood. 2012;120(12):2454–2465. doi: 10.1182/blood-2012-03-420489
- Breems DA, Val Putten WL, De Greef GE, et al. Monosomal karyotype in acute myeloid leukemia: a better indicator of poor prognosis than a complex karyotype. J Clin Oncol. 2008;26(29):4791–4797. doi: 10.1200/JCO.2008.16.0259
- Medeiros BC, Othus M, Fang M, et al. Prognostic impact of monosomal karyotype in young adult and elderly acute myeloid leukemia: the southwest oncology group (SWOG) experience. Blood. 2010;116(13):2224–2228. doi: 10.1182/blood-2010-02-270330
- Della Porta MG, Alessandrino EP, Bacigalupo A, et al. Predictive factors for the outcome of allogeneic transplantation inpatients with MDS stratified according to the revised IPSS-R. Blood. 2014;123(15):2333–2342. doi: 10.1182/blood-2013-12-542720
- Xing R, Li C, Gale RP, et al. Monosomal karyotype is an independent predictor of survival in patients with higher-risk myelodysplastic syndrome. Am J Hematol. 2014;89(10):E163–E168. doi: 10.1002/ajh.23801
- McQuilten ZK, Sundararajan V, Andrianopoulos N, et al. Monosomal karyotype predicts inferior survival independently of a complex karyotype in patients with myelodysplastic syndromes. Cancer. 2015;121(17):2892–2899. doi: 10.1002/cncr.29396
- Yahng SA, Jeon YW, Yoon JH, et al. Dynamic prognostic value of the revised international prognostic scoring system following pretransplant hypomethylating treatment in myelodysplastic syndrome. Bone Marrow Transplant. 2017;52(4):522–531. doi: 10.1038/bmt.2016.295
- Mo XD, Zhang XH, Xu LP, et al. Haploidentical hematopoietic stem cell transplantation for myelodysplastic syndrome. Biol Blood Marrow Transplant. 2017;23(12):2143–2150. doi: 10.1016/j.bbmt.2017.08.026
- Schanz J, Tuchler H, Sole F, et al. Monosomal karyotype in MDS: explaining the poor prognosis? Leukemia. 2013;27(10):1988–1995. doi: 10.1038/leu.2013.187
- Valcarcel D, Adema V, Sole F, et al. Complex, not monosomal, karyotype is the cytogenetic marker of poorest prognosis in patients with primary myelodysplastic syndrome. J Clin Oncol. 2013;31(7):916–922. doi: 10.1200/JCO.2012.41.6073
- Hwang KL, Soong MK, Shin HJ, et al. Monosomal and complex karyotypes as prognostic parameters in patients with international prognostic scoring system higher risk myelodysplastic syndrome treated with azacitidine. Blood Res. 2014;49(4):234–240. doi: 10.5045/br.2014.49.4.234
- Kelaidi C, Tzannou I, Baltadakis I, et al. Specific abnormalities versus number of abnormalities and cytogenetic scoring systems for outcome prediction after allogeneic hematopoietic SCT for myelodysplastic syndromes. Bone Marrow Transplant. 2014;49(8):1022–1028. doi: 10.1038/bmt.2014.87
- Patnaik MM, Hanson CA, Hodnefield JM, et al. Monosomal karyotype in myelodysplastic syndromes, with or without monosomy 7 or 5, is prognostically worse than an otherwise complex karyotype. Leukemia. 2011;25(2):266–270. doi: 10.1038/leu.2010.258
- Itzykson R, Thepot S, Eclache V, et al. Prognostic significance of monosomal karyotype in higher risk myelodysplastic syndrome treated with azacitidine. Luekemia. 2011;25(7):1207–1209. doi: 10.1038/leu.2011.63
- Suh KJ, Cheong JW, Kim I, et al. Prognostic impact of IPSS-R and chromosomal translocations in 751 Korean patients with primary myelodysplastic syndrome. PloS one. 2016;11(11):e0166245. doi: 10.1371/journal.pone.0166245
- Zhang T, Xu Y, Pan J, et al. Monosomal karyotype of chromosome 5/7 was an independent poor prognostic factor for Chinese myelodysplastic syndrome patients. Cancer Genet. 2016;209(9):423–429. doi: 10.1016/j.cancergen.2016.06.007
- Parmar MK, Torri V, Stewart L. Extracting summary statistics to perform meta-analyses of the published literature for survival endpoints. Stat Med. 1998;17(24):2815–2834. doi: 10.1002/(SICI)1097-0258(19981230)17:24<2815::AID-SIM110>3.0.CO;2-8
- Stang A. Critical evaluation of the Newcastle-Ottawa scale for the assessment of the quality of nonrandomized studies in meta-analyses. Eur J Epidemiol. 2010;25(9):603–605. doi: 10.1007/s10654-010-9491-z
- Begg CB, Mazumdar M. Operating characteristics of a rank correlation test for publication bias. Biometrics. 1994;50(4):1088–1101. doi: 10.2307/2533446
- Egger M, Davey SG, Schneider M. Bias in meta-analysis detected by a simple, graphical test. Br Med J. 1997;315(7109):629–634. doi: 10.1136/bmj.315.7109.629
- Wudhikarn K, Van Rheeden R, Leopold C, et al. Outcome of allogeneic stem cell transplantation in myelodysplastic syndrome patients: prognostic implication of monosomal karyotype. Eur J Haematol. 2012;89(4):294–301. doi: 10.1111/j.1600-0609.2012.01830.x
- Deeg HJ, Scott BL, Fang M, et al. Five-group cytogenetic risk classification, monosomal karyotype, and outcome after hematopoietic cell transplantation for MDS or acute leukemia evolving from MDS. Blood. 2012;120(7):1398–1408. doi: 10.1182/blood-2012-04-423046
- Ustun C, Trottier BJ, Sachs Z, et al. Monosomal karyotype at the time of diagnosis or transplantation predicts outcomes of allogeneic hematopoietic cell transplantation in myelodysplastic syndrome. Biol Blood Marrow Transplant. 2015;21(5):866–872. doi: 10.1016/j.bbmt.2015.01.017
- Alsahlawi A, Alkhateeb H, Patnaik M, et al. Monosomal karyotype predicts adverse prognosis in patients diagnosed with chronic myelomonocytic leukemia: a single-institution experience. Clin Lymphoma Myeloma Leuk. 2015;15(2):e39–e41. doi: 10.1016/j.clml.2014.06.007
- Rucker FG, Schlenk RF, Bullinger L, et al. TP53 alterations in acute myeloid leukemia with complex karyotype correlate with specific copy number alterations, monosomal karyotype, and dismal outcome. Blood. 2012;119(9):2114–2121. doi: 10.1182/blood-2011-08-375758