
ABSTRACT
Objectives: Interleukin-2 (alias: IL-2, TCGF, Lymphokine), a type of interleukin, is also a potent signalling molecule in the signalling cascade of the immune-mediated activation of T Lymphocytes leading to the destruction of haematopoietic stem cell (HSC) which is the basis of acquired aplastic anaemia (AAA). The objective was to study the association of IL-2 in the bone marrow plasma (BMP) and peripheral blood plasma (PBP) in AAA patients.
Methods: A total of 52 BMP and PBP-paired samples (both from the same patients) was collected from the confirmed AAA patients and 10 healthy individuals. The level of IL-2 was measured by the quantitative enzyme-linked immunosorbent assay (ELISA). The Mann–Whitney U test was used for statistical analysis.
Results: Significantly increased level of IL-2 was observed in the BMP than PBP of AAA patients. The level of IL-2 in PBP and BMP was found to be very low in the control cases. Considerably increased levels of IL-2 were found in the PBP and BMP of AAA patients as compared to controls (48.54 ± 21.89 vs. 1.99 ± 1.25 p-value < 0.00001) and (75.33 ± 41.9 vs. 3.12 ± 1.82; p-value < 0.00001) respectively. Among these patients, the IL-2 levels were higher in patients with Very Severe Aplastic Anaemia (VSAA) and Severe Aplastic Anaemia (SAA) than those with Non-severe Aplastic Anaemia (NSAA) in the PBP (65.6 ± 23.61 vs. 31.72 ± 7.64; p-value 0.00338) and (45.37 ± 16.25 vs. 31.72 ± 7.64; p-value 0.01468) respectively. Again the IL-2 levels were higher in patients with VSAA and SAA than those with NSAA in the BMP (115.01 ± 38.91 vs. 38.32 ± 19.49; p-value < 0.00001) and (66.44 ± 23.34 vs. 38.32 ± 19.49; p-value 0.0006). The IL-2 level was higher in VSAA than SAA in PBP (65.6 ± 23.61vs. 45.37 ± 16.25; p-value 0.0114) and BMP (115.01 ± 38.91 vs. 66.44 ± 23.34; p-value 0.00044).
Conclusion: This study emphasized on the bone marrow and blood plasma levels of IL-2 in aplastic anaemia and their relationship with disease severity. The results indicate towards the fact that IL-2 may have an important association with the marrow failure of AAA patients and thus can help in disease development. Further study is necessary for better understanding.
1. Introduction
A regular deficiency mainly of stem cell progenitors in the bone marrow (BM) is the elementary fault in aplastic anaemia (AA) [Citation1]. It manifests as peripheral blood pancytopenia and depression of haematopoietic stem cell (HSC). The disease is categorized into two groups, i.e. inherited aplastic anaemia (IAA) and acquired aplastic anaemia (AAA). The potential mechanisms responsible for acquired marrow cell failure include (1) direct toxicity to HSC, (2) defects in the stromal microenvironment of HSC growth, (3) impaired production of essential haematopoietic growth factors, (4) cellular or humoral immune suppression of the marrow HSC, and (5) progressive erosion of chromosome telomeres. AA can be cured by stem-cell transplantation or the immunosuppressive therapy with anti-thymocyte globulin (ATG) and cyclosporine. For this purpose, most of the studies on its pathogenesis have concentrated on the stem-cell defects or the immune mechanisms. Till date, there is very little documentation on the role of stromal marrow microenvironment in the AAA patients.
Exogenous or neo-antigens (toxin and drug exposure, viral infection or unknown agent) are processed by Class-II Major Histocompatibility Complex (MHC) molecule and presented towards the T Helper type-1 (TH1) cell by the antigen presenting cells. On a stimulation, T-bet, a transcription factor binds to the Interferon-γ (IFN-γ) promoter region and induces gene expression [Citation2]. The activated TH1 cells can produce IL-2 and more IFN-γ [Citation2,Citation3]. IFN-γ, in turn, stimulates macrophages and increased expression of class I (present on Tc cells) and class II MHC molecule further increases Ag presentation. Activated macrophages produce Tumour Necrosis Factor-α (TNF-α) [Citation4,Citation5]. IFN-γ and TNF-α both synergically regulate the expression of T cell receptor (TCR) and Fas receptor, which promotes the differentiation of cytotoxic Tc cells (CTLs) from CD 8+ precursors (Tc cell) and destroys altered self-cells [Citation6]. We have focused on such a major cytokine IL-2 in this study and its possible correlation with the disease severity of AAA patients. This study is the first documentation on the levels of IL-2 in AAA patients and their steady increment with the disease severity in eastern India.
2. Material and methods
2.1. Ethics
This study is ethically cleared by the ethics committee of Nil Ratan Sircar Medical College & Hospital, Kolkata and Vivekananda Institute of Medical Sciences, Kolkata.
2.2. Questionnaire and consent
Patients and control cases were informed about the study and written consent was taken before collection of BM and PVB samples.
2.3. Study design
The Guidelines of International Agranulocytosis and Aplastic Anaemia Study Group (IAAA), 1987 was followed for the diagnosis of AA patients. Minimum two of the three criteria with hypocellular bone marrow should be present to define AA which is, (1) haemoglobin <100 g/L, (2) platelet count <50 × 109/L, (3) neutrophil count <1.5 × 10⁹/L. A total of 100 confirmed AA patients took part in this study. Bone marrow aspiration and biopsy (BMA & BMB) was done by the clinician for the confirmation of the disease. Patients were screened at the out a patients department of the haematology unit of the Nil Ratan Sircar Medical College & Hospital, Kolkata from January 2016 to February 2018.
2.4. Exclusion criteria
According to the British Committee for Standards in Haematology guideline, chromosomal breakage analysis was done to discriminate between acquired and inherited AA, if the patient is <50 years old [Citation1].
2.5. Sample selection, collection and preservation
Total 100 confirmed AA patients were participated in this study. Among them, we were able to collect 52 paired plasma samples [Peripheral blood plasma (PBP) and Bone marrow plasma (BMP) of the same patient]. Samples were collected at the time of BMA and BMB because it is an invasive procedure and cannot be perform repeatedly. The samples were collected by professional medical physicians of the N.R.S. Medical College & Hospital, as it is the only nodal centre of the haematology in eastern India. This documentation was done on 52 AAA patients after having the reports of the BMA and BMB. The chance of dilution of the BM with the PVB was ruled out by the biopsy examination report.
Only four patients were found to be positive for chromosomal breakage test and excluded from the study. In the other 44 cases, plasma isolation could not be done due to the low amount of sample. Control samples were collected from the healthy persons (without pancytopenia) on request from the accompanying persons of the patients and it was a voluntary donation for the research purpose. Control cases were not age and sex-matched due to the huge difference in the number of control (n = 10) and patient samples (n = 52). Again BMA and BMB is a painful procedure, thus very few persons (control) agreed to join the study.
Paired plasma samples of the patient and control were collected in the heparinized vial (Green vial). The sample was centrifuged at 2000 rpm for 10 minutes. After the separation of the cells from the yellowish liquid matter (known as plasma), a minimum amount of 300 µl plasma was collected and was stored at −20°C until use. A repeated freeze–thaw cycle was avoided as it may compromise the amount IL-2.
2.6. Methodologies
Level of IL-2 was measured by ELISA using the ab174444-IL-2 kit (Abcam Human simple step ELISA Kit, USA) and automated ELISA plate reader (Readwell touch; Robonik) with the lower limit of detection (LLOD) being 9 pg/ml. To calculate the concentration of the IL-2, best fit standard graph was prepared according to the kit protocol. Samples were run in a duplicate manner. Averages of the absorbance or optical density (450 nm) were taken in the calculation of concentration (pg/ml). In case the plasma sample showed absorbance below the level of LLOD, the concentration was calculated from the standard graph.
2.7. Statistical analysis
The Mann–Whitney U test was used to compare the values of cytokines of interest in AAA patients with the controls. Statistical significance was taken as p < 0.05. Correlation coefficient (r) was calculated between the PBP and BMP.
3. Results
3.1. Results of the cytokine in AAA patients
The median age of the patients was 50 years. The age range of the patients was 3–85 years. Among them, 51.92% (n = 27) were male and 48.08% (n = 25) were female. The means, standard deviations and ranges of the levels of IL-2 in AAA patients and controls are tabulated in . In the control cases, the levels of IL-2 were 1.99 ± 1.25 pg/ml and 3.12 ± 1.82 pg/ml in PBP and BMP, respectively. Again in the 52 AAA patients, the levels of IL-2 in PBP and BMP were 48.54 ± 21.89 pg/ml and 75.33 ± 41.9 pg/ml, respectively. On the basis of severity the patients were categorized into three groups, those are, very severe aplastic anaemia (VSAA) 34.62% (n = 18), severe aplastic anaemia (SAA) 38.46% (n = 20) and non-severe aplastic anaemia (NSAA) 26.92% (n = 14). Noticeably the level IL-2 obtained was higher in BMP than PBP in AAA patients supportive of the fact that IL-2 might play an important role in the autoimmune damage of HSC. The levels of IL-2 in patients and controls are described by the Box–Whisker plot and the p-values are displayed in (A). The values of cytokines in AAA patients and control (both in PBP and BMP) were statistically analysed by Mann–Whitney U test. The p-value(s) were found to be extremely significant at a 5% confidence level and the p-values are shown in (B,C). For a better understanding of the results of IL-2 obtained from the 52 AAA patients, correlation study was done between the PBP and BMP. The value of correlation coefficient (r) is 0.5688. This is a moderate positive correlation, which means there is a tendency for high PBP variable scores go with high BMP variable scores (and vice versa).
Figure 1. Showing the IL-2 levels in 52 AAA patients and in 10 control cases (A). A significant increase in the IL-2 level is observed in BMP than in PBP of the AAA patients. The levels of the IL-2 in the BMP and PBP of healthy controls were very low and almost similar. The observations are indicating higher level of IL-2 is associated in AAA in both the PBP and BMP. But as the immune reaction is occurring in the BM compartment, the IL-2 is even higher in BMP. The levels of IL-2 in the PBP (B) were lower than the BMP (C) of 52 AAA patients. The AAA patients were categorized in three groups NSAA, SAA and VSAA. The order of the level of IL-2 was VSAA>SAA>NSAA. In every group the level of IL-2 was higher in BMP than the corresponding PBP. The bracket lines are indicating the two groups, between which the Mann–Whitney U test was done. The p-values between every group were found to be <0.05. BMP: bone marrow plasma; PBP: peripheral blood plasma; AAA: acquired aplastic anaemia; NSAA: non-severe aplastic anaemia; SAA: severe aplastic anaemia; VSAA: very severe aplastic anaemia; BM: bone marrow
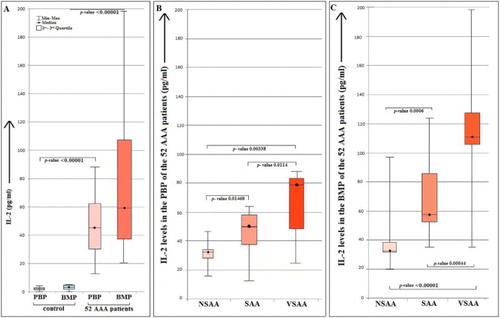
Table 1. Showing the mean ± SD and the range of IL-2 in 52 AAA patients and 10 control cases.
4. Discussion
Cytokine performs a significant role in the process of BM failure. Cytotoxic T-cell arbitrated outbreak on multipotential HSC is the foundation of AAA. IFN-γ, IL-2 and TNFα are also known as anti-haematopoietic cytokines. Activated CD4+ and CD8+ T cells, neurons, microglia and haematopoietic stem cells can secrete IL-2 in response to antigenic or mitogenic stimulation. Complete deficiency of IL-2 has been implicated in Severe Combined Immune Deficiency (SCID) [Citation7], whereas reduction of the IL-2 correlates with reduced function of CD4+ CD25+ regulatory T cell and destabilization of immune homeostasis leading to autoimmune disease [Citation8]. IL-2, therefore, is both an immune stimulator and suppressor cytokine which efficiently controls the immune system to deal with autoimmunity and adaptive immune response. The quantity of HSC progenitors and their derivative Colony-Forming Unit-Granulocyte-Macrophage (CFU-GM) and Burst Forming Unit–Erythroid (BFU–E) are markedly reduced in AAA [Citation9-12]. Elevated serum levels of interferon-γ are present in around 30% of the patients with aplastic anaemia, and interferon-γ expression has been detected in the marrow of most acquired aplastic anaemia patients [Citation13]. Addition of antibodies to interferon-γ enhances in-vitro colony growth of marrow cells in affected patients. These observations indicate that acquired aplastic anaemia is the result of cellular immune-induced apoptosis of primitive CD34+ multipotential haematopoietic progenitors, mediated by cytotoxic T lymphocytes, in part, through the expression of T-helper type1 (Th1) inhibitory cytokines, like IL-2, IFN- γ and TNF-α [Citation2-4,Citation14-16]. A very common practice is the administration of cyclosporine, which inhibits IL-2 production by T lymphocytes. Thus preventing the expansion of cytotoxic T cells in response to IL-2, this is another approach of immunotherapy in AA patients [Citation17]. Immunosuppressive agents, such as mycophenolate mofetil, rapamycin, or monoclonal antibodies, to the IL-2 receptor, have been found to be effective in decreasing cytotoxic T cell activity from targeting HSC [Citation6]. These observations support the fact that IL-2 might have a contribution in the autoimmune pathogenesis of the AAA patients. Only two Indian studies have focused on IL-8, IFN- γ and TNF-α [Citation18,Citation19] in AA patients.
A considerably elevated level of IL-2 was found in AAA patients in the PBP and BMP than the control samples. Even it was observed that the mean and standard deviation of the IL-2 level, both in PBP and BMP changes with the severity of the disease. IL-2 helps in the clonal proliferation of TH1 cells, thereby, increasing the antigen presentation. The higher the level of the IL-2, the higher the immune reaction, in the BM compartment. Until now, no study has been documented on the elevated IL-2 levels in the paired plasma samples of AA patients. We have demonstrated that PBP and BMP of AAA patients have increased levels of IL-2 than control samples, points towards a correlation with disease. Immune histo-chemistry, western blot technique and northern blot technique can be used for the confirmation of the finding in protein and RNA level respectively. Study with a higher sample size is recommended for further understanding.
Acknowledgements
The authors are indebted to Swami Nityakamananda, Secretary, Ramakrishna Mission Seva Pratishthan, Vivekananda Institute of Medical Sciences, Kolkata for giving us inventory support. The authors are also obliged to the Department of Haematology, Nil Ratan Sircar Medical College & Hospital, Kolkata for providing samples and other kinds of assistances.
Disclosure statement
No potential conflict of interest was reported by the authors.
Additional information
Funding
Related Research Data
References
- Marsh JCW, Ball SE, Cavenagh J, et al. Guidelines for the diagnosis and management of aplastic anaemia. Br J Haematol. 2009;147:43–70. doi: 10.1111/j.1365-2141.2009.07842.x
- Laver J, Castro-Malaspina H, Kernan NA, et al. In vitro interferon-gamma production by cultured T-cells in severe aplastic anaemia: correlation with granulomonopoietic inhibition in patients who respond to anti-thymocyte globulin. Br J Haematol. 1988;69:545–550. doi: 10.1111/j.1365-2141.1988.tb02413.x
- Gascon P, Zoumbos NC, Scala G, et al. Lymphokine abnormalities in aplastic anemia: implications for the mechanism of action of antithymocyte globulin. Blood. 1985;65:407–413.
- Hinterberger W, Adolf G, Bettelheim P, et al. Lymphokine overproduction in severe aplastic anemia is not related to blood transfusions. Blood. 1989;74:2713–2727.
- Shinohara K, Ayame H, Tanaka M, et al. Increased production of tumor necrosis factor alpha by peripheral blood mononuclear cells in the patients with aplastic anemia. Am J Hematol. 1991;37:75–79. doi: 10.1002/ajh.2830370203
- Young NS, Calado RT, Scheinberg P. Current concepts in the pathophysiology and treatment of aplastic anemia. Blood. 2006;108:2509–2519. doi: 10.1182/blood-2006-03-010777
- Voss SD, Hong R, Sondel PM. Severe combined immunodeficiency, interleukin-2 (IL-2), and the IL-2 receptor: experiments of nature continue to point the way. Blood. 1994;83:626–635.
- Yamanouchi J, Rainbow D, Serra P, et al. Interleukin-2 gene variation impairs regulatory T cell function and causes autoimmunity. Nat Genet. 2007;39:329–337. doi: 10.1038/ng1958
- Kagan WA, Ascensão JA, Pahwa RN, et al. Aplastic anemia: presence in human bone marrow of cells that suppress myelopoiesis. Proc Natl Acad Sci. 1976;73:2890–2894. doi: 10.1073/pnas.73.8.2890
- Maciejewski JP, Anderson S, Katevas P, et al. Phenotypic and functional analysis of bone marrow progenitor cell compartment in bone marrow failure. Br J Haematol. 1994;87:227–234. doi: 10.1111/j.1365-2141.1994.tb04903.x
- Scopes J, Bagnara M, Gordon-Smith EC, et al. Haemopoietic progenitor cells are reduced in aplastic anemia. Br J Haematol. 1994;86:427–430. doi: 10.1111/j.1365-2141.1994.tb04761.x
- Maciejewski JP, Selleri C, Sato T, et al. A severe and consistent deficit in marrow and circulating primitive hematopoietic cells (long-term culture-initiating cells) in acquired aplastic anemia. Blood. 1996;88:1983–1991.
- Nistico A, Young NS. Gamma-interferon gene expression in the bone marrow of patients with aplastic anemia. Ann Intern Med. 1994;120:463–469. doi: 10.7326/0003-4819-120-6-199403150-00003
- Zoumbos N, Gascon P, Djeu J, et al. Interferon is a mediator of hematopoietic suppression in aplastic anemia in vitro and possibly in vivo. Proc Natl Acad Sci U S A. 1985;82:188–192. doi: 10.1073/pnas.82.1.188
- Sloand E, Kim S, Maciejewski JP, et al. Intracellular interferon-gamma in circulating and marrow T cells detected by flow cytometry and the response to immunosuppressive therapy in patients with aplastic anemia. Blood. 2002;100:1185–1191. doi: 10.1182/blood-2002-01-0035
- S1 I, Kaufman DW, Anderson T, et al. The epidemiology of aplastic anemia in Thailand. Blood. 2006 Feb 15;107(4):1299–1307. doi: 10.1182/blood-2005-01-0161
- Stryckmans PA, Dumont JP, Velu T, et al. Cyclosporine in refractory severe aplastic anemia [letter]. (letter). N Engl J Med. 1984;310:655–656. doi: 10.1056/NEJM198403083101013
- Tripathy NK, Nityanand S. Bone marrow and blood plasma levels of IL-8 in aplastic anemia and their relationship with disease severity. Am J Hematol. 2005;79:240–242. doi: 10.1002/ajh.20367
- Dubey S, Shukla P, Nityanand S. Expression of interferon-gamma and tumor necrosis factor-alpha in bone marrow T cells and their levels in bone marrow plasma in patients with aplastic anemia. Ann Hematol. 2005;84(9):572–577. doi: 10.1007/s00277-005-1022-8