
ABSTRACT
Objectives: Reduced platelet (PLT) function during storage has been shown for buffy-coat-derived platelet concentrates (BCP) and apheresis platelet units (AP), while for whole blood (WB) it has not been well studied. The aim of this study was to investigate PLT function in these blood products throughout storage using a novel flow cytometric assay.
Methods: Flow cytometric measurement of agonist-induced platelet aggregation, CD62P expression and PAC-1 binding during storage in BCP, AP (1–9 days at 20°C) and WB (1–21 days at 2–6°C).
Results: PLT-aggregation capacity decreased from day 1 to day 7 for almost all product–agonist combinations (P = .004 to P = .029) with aggregation capacity of WB being similar to that of AP and BCP. WB aggregation capacity remained relatively unchanged from day 7 to day 21. For all blood products, the fraction of agonist-induced CD62P-expression remained high and the fraction of PAC-1 binding decreased during storage. WB PLTs underwent only small changes in CD62P expression and PAC-1 binding from day 7 to day 21.
Conclusion: This study found PLT aggregation in WB stored at 4°C to be as least as good as for BCP and AP stored at 20°C. WB retained significant PLT-aggregation capacity to day 21.
Introduction
Platelets (PLTs) are pivotal in primary haemostasis [Citation1], and PLT transfusions are used to treat patients with active haemorrhage or to prevent haemorrhage in patients with thrombocytopenia [Citation2–5]. Studies suggest that it is not simply the patient’s PLT concentration that determines their risk of bleeding [Citation3–5]; and several recent studies have shown an association between thrombocytopenic patients’ in vitro PLT function and their bleeding tendency [Citation6–9]. This association begs the question about whether using in vitro PLT functional assays could be used to predict the haemostatic capability of transfused PLTs.
PLTs for transfusion may be provided in the form of buffy-coat-derived platelet concentrates (BCP) or as apheresis platelets (AP). In addition, PLTs are transfused when whole blood (WB) is administered. WB transfusions are increasingly being used to treat life-threatening traumatic bleeding, and wider indications for the use of WB are currently being investigated and debated [Citation10,Citation11].
Several studies have shown that PLT function tends to decrease during storage at room temperature [Citation12–20]. A few studies have examined PLT activity in WB and found contradicting results depending on the agonist used [Citation21–23]. Further, PLT function in WB during storage has been shown superior than that of BCP [Citation23,Citation24]. However, these studies assessed PLT function by methodologies that are known to be dependent on the PLT count or the medium in which the PLTs are suspended [Citation25,Citation26]. Recently, a flow cytometric PLT aggregation approach was described [Citation27]. This assay enables the measurement of PLT aggregation independent of the suspension medium and sample PLT count. This assay’s independence of medium and PLT count is achieved in the sample preparation stage, where PLTs are isolated from the original sample and the PLT count is adjusted to a predefined level [Citation9]. In addition to evaluating PLT aggregation, this approach includes the assessment of PLT activation capacity by flow cytometry. Two markers of PLT activation are employed. One is expression of P-selectin (CD62P), which is present in the α-granule membrane and becomes exposed on the PLT surface upon α-granule degranulation [Citation28]. The other is binding of PAC-1, a murine antibody that binds specifically to the activated GPIIb/IIIa receptor. This receptor is crucial for PLT aggregation, as it in its activated form binds fibrinogen, which is a significant step towards PLT aggregation [Citation29]. Thus, this novel flow cytometric approach evaluates many aspects of PLT function (aggregation, expression of CD62P and binding of PAC-1), and it has not yet been used for studying PLT function in blood products.
The objective of this study was to use the flow cytometric test described above to investigate and compare PLT function in PLT-containing blood products including BCP, apheresis PLT units and, WB units from manufacturer and through storage.
Materials and methods
Participants and ethics
According to Danish law and in agreement with the Danish blood donor organization (Bloddonorerne i Danmark, Copenhagen, Denmark), the protocol for this study did not need approval by a scientific ethical committee or by the Danish Data Protection Agency, because the WB/PLT donations used in the study were irreversibly anonymized before entry into the study.
Blood bank PLT preparation procedures
Blood products were manufactured from volunteer donations at Odense University Hospital, using the hospital blood bank’s standard procedures and in accordance with Danish law and regulations [Citation30]. The standard procedure for WB collection was to collect WB in a bag containing 66.5 mL citrate–phosphate–dextrose anticoagulant (MacoPharma-Rue Lorthiosis, Mouvaux, France). For this study, WB was stored at 2–6°C for 21 days without agitation. AP units were collected using the Spectra Optia® Apheresis System (Terumo BCT, Lakewood, CO, USA) into a collection bag containing PLT additive solution (Terumo BCT, Lakewood, CO, USA). APs were stored on a flatbed agitator at 20–24°C for 9 days. Buffy-coats (from four donors) were prepared according to the manufacturer’s instructions and pooled with Composal PS® PLT storage solution (Fresenius Kabi AG, Bad Homburg, Germany), then centrifuged and leukocyte depleted. The resulting BCP were stored on the flatbed agitator under constant agitation at 20–24°C for 9 days.
The PLT-poor plasma used as a reagent in the PLT activation and aggregation assay was derived from blood collected from one anonymous group A RhD-positive donor; it was produced by double centrifugation (1000 g at10 min and 22°C) and the sediment was discarded. Plasma was stored at −80°C until it was used.
Haematology parameters
Mean PLT volume (MPV) and PLT concentration were measured using a Sysmex XN-9000 analyzer (Sysmex, Kobe, Japan).
PLT aggregation
PLT aggregation was analysed by a flow cytometric assay, which is described in detail elsewhere [Citation9].
Briefly, PLTs were isolated from WB samples, by centrifugation (200 g for 10 min at 22°C). APs and BCPs were not subjected to this centrifugation step, as they were already depleted of other blood cells than PLTs. PLT-rich PLT suspensions (all samples) were then centrifuged (1000 g for 10 min at 22°C) to separate them from their suspension medium or plasma. Before centrifugation, acid–citrate–dextrose solution (100 µL/1 mL PRP (platelet-rich plasma)) and prostaglandin E1 (Alprostadil 0.9 µmol/L, Tocris, Bristol, United Kingdom) were added to prevent PLT activation. The supernatant was discarded and PLTs were resuspended in buffer (NaCl 134 mM, KCl 2.9 mM, MgCl2 1 mM, glucose 5.6 mM and 4-(2-hydroxyethyl)-1-piperazineethanesulfonic acid 20 mM, pH 7.4).
The PLTs in buffer solution were then split. One aliquot was prepared with a PLT count of 144 × 109/L and labelled with calcein acetoxymethyl ester (CAM) Ultrapuregrade. A second aliquot with a PLT count of 16 × 109/L was labelled with CAM Violet 450 (both eBioscience, San Diego, CA, USA). The two PLT fractions were mixed (35 µL of each) and added 70 µL from the pre-prepared pool of PLT-poor plasma. The mixture was incubated for 30 min at 37°C. To induce PLT aggregation, one of three different agonists was then added to mixture a final concentration of 2.2 µg/mL collagen-related peptide (CRP) (provided by Dr. Richard W. Farndale, University of Cambridge, United Kingdom), 244 µM thrombin receptor-activating peptide (TRAP) (SFLLRN; JPT Peptide Technologies GmbH, Berlin, Germany), or 244 µM adenosine diphosphate (ADP) (Sigma-Aldrich, St. Louis, MO, USA). Unstimulated samples (agonist not added) were used to evaluate the extent of spontaneous PLT aggregation. The mixture was then shaken (1000 rpm for 5 min at 37°C) to facilitate PLT aggregation. Finally, the PLTs were fixed in 0.2% formalin buffer and run on the flow cytometer (FACSCanto II, BD Biosciences, San Jose, CA, USA). For each blood product, tests of PLT aggregation were performed in triplicate for each agonist. Median of this triplicate was used for data analysis.
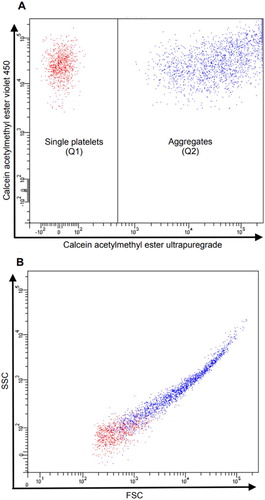
PLT aggregation was calculated as the percentage of events positive for both CAM Ultrapuregrade and CAM Violet 450 out of the total CAM Violet 450-positive events ().
Figure 1. PLTs run on the flow cytometer gated on CAM ester Violet 450-postitive events (Q1) and CAM ester ultrapuregade-positive events. (A) PLT aggregation was calculated as the percentage of events positive for both CAM Ultrapuregrade and CAM Violet 450 representing PLT aggregates (Q2) out of the total CAM Violet 450-positive events (Q1 + Q2). PLT aggregation (%) = Q2/(Q1 + Q2)B) shows the values of side scatter (SSC) and forward scatter (FSC) of CAM ester Violet 450-postitive PLTs (Q1) and PLTs positive for both CAM ester Violet 450 and CAM ester ultrapuregrade.
Fresh, sodium-citrate stabilized and anonymized samples from 10 healthy blood donors (henceforth referred to as ‘control samples’) were used to establish normal ranges for PLT aggregation. Each donor was tested once with each agonist.
PLT activation
PLT activation was investigated by flow cytometry as level of PAC1-binding (activated GPIIb/IIIa-complex) and as expression of CD62 (P-selectin). For each test, 2.5 µL PLT solution (see below for details), 5.5 µL antibody-mixture and 2.5 µL agonist was mixed and phosphate buffered saline (PBS) added to a final volume of 32.5 µL. For unstimulated samples, PBS was added instead of the agonist. The PLT–agonist–antibody mixtures were incubated for 15 min at 37°C and then added a 0.2% formalin solution.
For WB, the PLT solution comprised undiluted WB, whereas for AP and BCP, the PLT count was adjusted to 560 × 109/L with PBS, then plasma was added in a 1:1 ratio. The PLT solution was incubated for 30 min at 37°C prior to use. The antibody-mixture comprised fluorophore-conjugated monoclonal antibodies (mAbs): phycoerythrin (PE)-conjugated GPIb (CD42b, Clone HIP1), allophycocyanin (APC)-conjugated P-selectin (CD62P, Clone Psel.KO2.3) (both eBioscience, San Diego, CA, USA), and fluorescein isothiocyanate (FITC)-conjugated PAC-1 (Becton Dickinson Bioscience, San Jose, CA, USA). The final concentration of the agonists were 1.1 µg/mL CRP, 10 µM TRAP or 12.8 µM ADP. To quantitate the extent of non-specific fluorescence, PLT sample from each blood product was incubated with an isotype-matched APC-conjugated immunoglobulin control (eBioscience, San Diego, CA, USA) to estimate interference with P-selectin measurement and added 2.5 µL EDTA (final concentration of 769 µM) to inhibit binding of PAC-1. Except the samples with isotype-matched controls, all tests were performed in duplicate. Mean of the two values were used for data analysis. Flow cytometry was carried out using a FACSCanto II flow cytometer. Kaluza software 1.5a (Beckman Coulter, CA, USA) was used to analyse the data. PLTs were identified as CD42b-positive events and the results were reported as the mean fluorescence intensities and as the percentage of PLTs positive for PAC-1 and CD62P compared to the negative sample.
Days of sampling
The day of WB collection or apheresis was set as day 0. Storage day 1 was the first day after collection and so forth. PLT aggregation, PLT activation and haematology parameters were assessed on storage days 1, 2, 5, 7 and 9. In addition, for WB, the aggregation assay and measurement of activation markers was performed on days 15 and 21.
Statistical analysis
The results on PLT aggregation, PAC-1 binding and CD62P expression are reported as mean ± standard error of the mean (SEM) (–). In addition, PLT aggregation data are presented as mean and range (). One-way analysis of variance (ANOVA) was used for comparisons between different types of PLT products (on storage day 1 and on storage day 7) and for comparisons of PLT products with fresh blood (–). Paired t-test (day 1 vs. day 7) or ANOVA (day 1 vs. day 7 vs. day 21) was applied to evaluating the effect of storage within blood products (). P-values <.05 for two-sided tests were considered statistically significant. All statistic calculations were performed using SAS JMP, version 12.01 (SAS Institute, Cary, NC, USA).
Figure 2. PLT aggregation in BCP, AP and WB by storage day and in control samples (fresh blood) presented as mean aggregation ± SEM. (A) TRAP stimulation, (B) CRP stimulation, and (C) ADP stimulation. Asterisk indicates significant difference across blood products at the given day of storage.
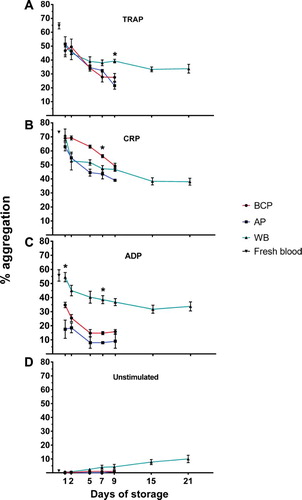
Figure 3. PLT activation measured in BCP, AP and WB by storage day, assessed as the percentage of platelets expressing CD62P (P-selectin) and presented as mean percentage ± SEM. (A) TRAP stimulation, (B) CRP stimulation, and (C) ADP stimulation. Asterisk indicates significant difference across blood products at the given day of storage.
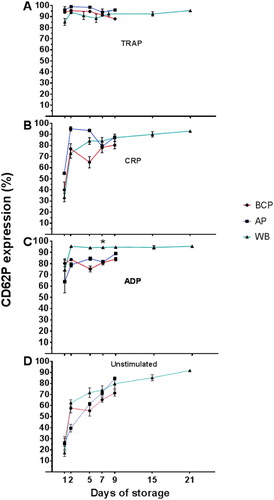
Figure 4. PLT activation measured in BCP, AP and WB by storage day, assessed as the percentage of platelets binding PAC-1, and presented as mean percentage ± SEM. (A) TRAP stimulation, (B) CRP stimulation, and (C) ADP stimulation. Asterisk indicates significant change across blood products at the given day of storage.
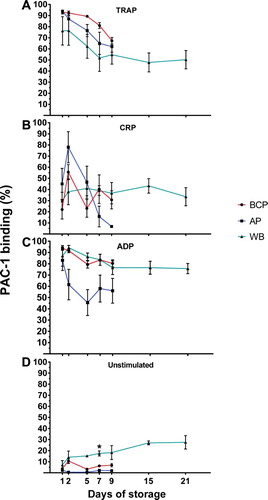
Table 1. PLT aggregation in BCP, AP and WB by storage day presented as mean aggregation (range).
Results
Four BCP units, 4 WB units and 2 AP units, all from separate donors, were procured for the study, henceforth referred to individually or collectively as ‘PLT-containing blood products’.
Haematology analyzer parameters
The MPV and PLT count were generally stable during storage for all PLT-containing blood products, aside from a decreased MPV in BCP at day 9 of storage compared to day 1 (data not shown).
PLT aggregation
Reproducibility of aggregation assay
Analysis of variance within triplicates demonstrated a median pooled standard deviation (SD) for all days of storage across all three PLT products and across all three agonists (i.e. 9 SD values) of 2.7 percentage points (range: 2.5–3.1 percentage points). This corresponds to an estimated correlation coefficient of 5.4% at an aggregation level of 50%.
Storage day 1, comparisons with control samples
For TRAP-induced PLT aggregation, the mean aggregation level was again highest for the control samples, but this was only significantly higher compared to BCP (P = .009) ((A)). With regard to CRP-induced aggregation, there was no significant difference between the various PLT-containing blood products and control samples, although the pattern of mean aggregation levels closely mimicked that of ADP (i.e. control samples > WB > BC > AP) ((B)). The ADP-induced PLT aggregation capacity was significantly higher in the control samples (fresh blood) compared to BCP (21 percentage points [pp]) and AP (38 pp) but not WB on the first day of storage (P = .006) ((C)).
Changes in PLT aggregation within products during storage
PLT aggregation capacity decreased during storage (). By day 7 of storage, a decline in PLT aggregation capacity was observed for all of the PLT-containing blood products (range of change [day 1–day 7] for the three agonists: AP: 10–20 pp; BCP: 13–20 pp and WB: 12–24 pp) compared to storage day 1. The declines were statistically significant for all the PLT-containing blood component and agonist combinations (P= .004 to P = .029), except for ADP with AP and TRAP with WB where changes were not statistically significant. WB PLTs appeared to undergo only minor changes in aggregation capacity upon stimulation from storage day 7 to day 21 (range in changes for the three agonists aggregation capacity: –4 to –18 pp).
Comparisons of PLT aggregation across products on storage day 1 and storage day 7
A variety of trends were observed when comparing PLT aggregation across the three PLT-containing blood products. Of note was ADP-induced PLT aggregation, which was 28 pp (P = .001) and 27 pp (P < .0001) higher in WB in comparison with mean level of PLT aggregation of BCP and AP on day 1 and on day 7, respectively ((C)). On storage day 7, CRP-induced PLT aggregation was significantly (P = .011) higher in BCP when compared to AP and WB (median difference 11 pp), this difference however, had diminished by storage day 9. Finally, the higher mean TRAP-induced aggregation of WB at day 7 compared to AP and BCP (median difference 8 pp) was not statistically significant (P = .085), but had increased further at day 9 (median difference 14 pp, P = .004) ((A)).
Unstimulated PLT aggregation
In unstimulated ((D)) samples, spontaneous PLT aggregation in WB increased significantly by day 21 of storage compared to day 1 (mean difference 10 pp, P = .038), while storage did not cause a significant increase in spontaneous (unstimulated) PLT aggregation at day 7 compared to day 1 for BCP and AP.
PLT activation
Changes in PLT activation within products during storage
The percentage of PLTs positive for P-selectin following agonist-stimulation remained high throughout storage following an initial rise from storage day 1 to day 2, most pronounced for stimulation by CRP or ADP ((B, C)). After agonist-stimulation, the percentage of PLTs positive for activated GPIIb/IIIa decreased during storage from storage day 1 in all of the PLT-containing blood products with TRAP-stimulation (median decrease 12 pp for BCP at day 7, P = .0158), and in BCP with ADP-stimulation (median decrease 10 pp at day 7, P = .001) (). Overall, WB appeared to undergo only minor changes in expression of CD62P and PAC-1 binding upon stimulation from storage day 7 to day 21. Numerically the changes (given as range in changes for the three agonists) for the two activation markers were: CD62P expression: +1 to + 9 pp and PAC-1 binding: –2 to –8 pp. For the same storage period, there was a significant increase in unstimulated expression of CD62P (median increase 18 pp; P = .012) and also a 10 pp but not statistically significant increase in PAC-1 binding (P = .135) ( and ).
Comparisons of PLT activation across blood products on storage day 1 and storage day 7
On storage day 1, the PLT activation capacity (percentages of PLTs positive for CD62P and PAC-1 binding) was similar between the various blood products, only for CD62P-expression following CRP stimulation was there a close to significant difference, with AP having higher mean CD62P-expression (median difference 18 pp, P = .08) compared to BCP and WB.
Unstimulated PLT activation
In unstimulated samples, the degree of spontaneous expression of P-selectin (CD62P, (D)) increased at approximately the same rate for all of the PLT-containing blood products during storage, while the percentage of PLTs with activated GPIIb/IIIa (PAC-1 binding, (D)) was considerably less affected by storage; the mean PAC-1 binding in WB had risen significantly beyond the level of AP and BCP (median difference 13 pp, P = .003) by day 7 of storage, and continued to rise until storage day 21 ((D)).
Fluorescence intensity of activation markers
The fluorescence profile of the activation markers followed unimodal distributions throughout, meaning that the mean fluorescence intensity of P-selectin and PAC-1 binding of PLTs in all blood components were positively correlated to the percentages of PLTs positive for the each of the two activation markers (data not shown).
Discussion
The presented data indicate that the capacity for activation of the GPIIb/IIIa receptor and PLT aggregation decline in all PLT blood products during storage and that increasing levels of spontaneous PLT activation as assessed by P-selectin exposure are observed.
As had been demonstrated previously, the routine PLT parameters (PLT count and MPV) were stable in the blood products during storage [Citation15,Citation31]. Thus, spontaneous PLT aggregation or adhesion onto the storage bag surface must have been minimal in our setting.
Activation of GPIIb/IIIa is a result of PLT activation and permits binding of fibrinogen to the receptor. This leads to PLT aggregation [Citation29]. Overall, the current study showed that upon agonist-stimulation, activated GPIIb/IIIa, and accordingly PLT aggregation capacity, tended to decline during storage in all tested blood products.
This study found only minor differences in PLT aggregation among the different blood products, although the ADP-induced PLT aggregation in WB at day 7 was 30.3% and 23.8% higher than in AP and BCP, respectively. As this was only observed in ADP-stimulated PLTs, this suggests that one or more components of the PAS storage medium specifically inhibit ADP-induced aggregation in vitro. Nonetheless, the PLT aggregation capacity of WB is at least as good as it is in BCP or AP. Previous studies have shown reduced PLT aggregation capacity in BCP and AP during storage as measured by light transmission aggregometry [Citation12–18] or multiple electrode aggregometry [Citation12,Citation13,Citation19,Citation20], but only few have compared PLT function in BCP or AP to that of WB [Citation23,Citation24]. Knowledge of PLT function in WB during storage is sparse and has shown conflicting results [Citation21–23]. In contrast to existing studies, the PLT aggregation capacity results were confirmed with measurements of activated GPIIb/IIIa in the present study. Further, PLT counts decreased significantly during storage in the studies of Jobes et al. [Citation21] and Pidcoke et al. [Citation22] without any correction of the results for this confounder. Further, Kornblith et al. [Citation24] compared fresh WB to expired PLT concentrates and Rodgers et al. [Citation23] only examined up till 3 days of storage, thereby making direct comparisons with the current study difficult.
Upon PLT activation, P-selectin, a protein in the a-granule of PLTs, becomes exposed on the PLT surface [Citation28]. In agreement with previous studies [Citation13,Citation15,Citation31–33], PLTs in the present study became spontaneously activated during storage as measured as the percentage of P-selectin-positive. Spontaneous activation of GPIIb/IIIa was less pronounced and did to some degree parallel the spontaneous aggregation, suggesting that the main mechanism behind unstimulated aggregation mechanism might be GBIIb/IIIa activation. Few studies have examined PLT activation capacity during storage in terms of P-selectin and activated GPIIb/IIIa-complex expression upon agonist stimulation. These studies have reported both unaltered [Citation15] as well as declining [Citation34] PLT activation during storage.
Overall, the percentage of P-selectin-positive PLTs after agonist stimulation remained high during storage. It may be speculated that spontaneously activated PLTs in blood products contribute to the apparent immediate haemostatic response following transfusion. However, activated PLTs are likely to be removed quickly from the circulation in vivo [Citation35]. Thus, spontaneously activated PLTs might be particularly relevant in settings of acute critical bleeding. On the other hand, we found that the phenotype of a spontaneously (storage-induced) activated PLT differ from that an agonist-induced PLT activation as the level of aggregation and the percentage of PLTs with activated GPIIb/IIIa in the former does not reach the levels as expected based on P-selectin expression. However, the in vivo haemostatic potential of these storage-induced activated PLTs remains uncertain.
A minor drawback of our study design is that we only had acces to a limited number of PLT-containing blood products. We find, however, this to be amply countered by the very high level of precision of the flow cytometric aggregation assay, of which we demonstrated the reproducibility in triplicates to be at level of a median pooled SD of 2.7 percentage points. Further, the data on aggregation within each blood product aggregated quite uniformly as show both in and also by the ‘narrow’ SEM limits for most data points in .
The advantage of the current study’s approach is the specific measurement of PLT aggregation independent of the suspension medium and sample PLT count [Citation9], thereby preventing spurious results due to changes in the composition of the media and PLT count during storage and differences between different blood components [Citation22,Citation36]. Of importance, in vitro PLT activation capacity seems to be associated with bleeding tendency in patients with immune thrombocytopenia [Citation6,Citation8] and in patients with acute myeloid leukemia [Citation7]. Moreover, reduced flow cytometric PLT aggregation capacity was associated with a bleeding tendency in patients with acute myeloid leukemia and thrombocytopenia [Citation9]. While evidence is mounting that in vitro PLT function is important for bleeding risk, it is less clear whether PLT function in blood products may predict their haemostatic function/potential in vivo, following transfusion.
Conclusion
In conclusion, we show that PLT functional capacity deceases during storage, as PLT aggregation and PLT activation (PLTs positive for activated GPIIb/IIIa-complex) decrease with time. Spontaneous PLT activation are seen in all blood products with storage, especially as increasing percentages of PLTs spontaneously positive for P-selectin with time. This study found PLT function in cold-stored non-agitated WB to be at least as good as for BCP and APs stored with agitation at room temperature. Larger studies are warranted to confirm these findings.
Disclosure statement
No potential conflict of interest was reported by the authors.
ORCID
Pernille J. Vinholt http://orcid.org/0000-0002-2035-0169
Henrik Frederiksen http://orcid.org/0000-0001-8905-0220
Additional information
Funding
Related Research Data
References
- Arnout J, Hoylaerts MF, Lijnen HR. Haemostasis. Handb Exp Pharmacol. 2006;176(176 Pt 2):1–41.
- Vejledning om blodtransfusion. Vejledning nr. 9038 af [15 Jan 2015] [Instructions regarding blood transfusion] [Online] Available at: [cited 2017 June 9]. Danish Health and Medicines Authority; 2015.
- Wandt H, Schaefer-Eckart K, Wendelin K, et al. Therapeutic platelet transfusion versus routine prophylactic transfusion in patients with haematological malignancies: an open-label, multicentre, randomised study. Lancet. 2012;380(9850):1309–1316. doi: 10.1016/S0140-6736(12)60689-8
- Heddle NM, Cook RJ, Sigouin C, et al. A descriptive analysis of international transfusion practice and bleeding outcomes in patients with acute leukemia. Transfusion. 2006;46(6):903–911. doi: 10.1111/j.1537-2995.2006.00822.x
- Stanworth SJ, Estcourt LJ, Powter G, et al. A no-prophylaxis platelet-transfusion strategy for hematologic cancers. N Engl J Med. 2013;368(19):1771–1780. doi: 10.1056/NEJMoa1212772
- Frelinger AL 3rd, Grace RF, Gerrits AJ, et al. Platelet function tests, independent of platelet count, are associated with bleeding severity in ITP. Blood. 2015;126(7):873–879. doi: 10.1182/blood-2015-02-628461
- Leinoe EB, Hoffmann MH, Kjaersgaard E, et al. Prediction of haemorrhage in the early stage of acute myeloid leukaemia by flow cytometric analysis of platelet function. Br J Haematol. 2005;128(4):526–532. doi: 10.1111/j.1365-2141.2004.05335.x
- Psaila B, Bussel JB, Frelinger AL, et al. Differences in platelet function in patients with acute myeloid leukemia and myelodysplasia compared to equally thrombocytopenic patients with immune thrombocytopenia. J Thromb Haemost. 2011;9(11):2302–2310. doi: 10.1111/j.1538-7836.2011.04506.x
- Vinholt PJ, Frederiksen H, Hvas AM, et al. Measurement of platelet aggregation, independent of patient platelet count: a flow-cytometric approach. J Thromb Haemost. 2017;156(6):1191–1202. doi: 10.1111/jth.13675
- Spinella PC, Pidcoke HF, Strandenes G, et al. Whole blood for hemostatic resuscitation of major bleeding. Transfusion. 2016;56(Suppl. 2):S190–S202. doi: 10.1111/trf.13491
- Zielinski MD, Stubbs JR, Berns KS, et al. Prehospital blood transfusion programs. J Trauma Acute Care Surg. 2017;82(6S Suppl. 1):S70–S78. doi: 10.1097/TA.0000000000001427
- Kicken C, Van Poucke S, Marcus AE, et al. Response of platelet concentrates to pressure and temperature changes without impairment of the in vitro function. Thromb Res. 2015;135(4):679–683. doi: 10.1016/j.thromres.2015.01.004
- Lance MD, Marcus MA, van Oerle R, et al. Platelet concentrate transport in pneumatic tube systems – does it work? Vox Sang. 2012;103(1):79–82. doi: 10.1111/j.1423-0410.2011.01580.x
- Miyaji R, Sakai M, Urano H, et al. Decreased platelet aggregation of platelet concentrate during storage recovers in the body after transfusion. Transfusion. 2004;44(6):891–899. doi: 10.1111/j.1537-2995.2004.03214.x
- Hechler B, Ohlmann P, Chafey P, et al. Preserved functional and biochemical characteristics of platelet components prepared with amotosalen and ultraviolet A for pathogen inactivation. Transfusion. 2013;53(6):1187–1200. doi: 10.1111/j.1537-2995.2012.03923.x
- Kocazeybek B, Arabaci U, Akdur H, et al. Prospective evaluation of platelets prepared by single and random methods during 5 days of storage: aspects related to quality and quantity. Transfus Apher Sci. 2002;26(1):29–34. doi: 10.1016/S1473-0502(01)00141-0
- Beck KH. Quality control of platelets during storage by the PFA-100: a comparison to platelet aggregation. Transfus Apher Scie. 2002;27(3):247–253. doi: 10.1016/S1473-0502(02)00072-1
- van der Meer PF, Bontekoe IJ, Daal BB, et al. Riboflavin and UV light treatment of platelets: a protective effect of platelet additive solution? Transfusion. 2015;55(8):1900–1908. doi: 10.1111/trf.13033
- Shams Hakimi C, Hesse C, Wallen H, et al. In vitro assessment of platelet concentrates with multiple electrode aggregometry. Platelets. 2015;26(2):132–137. doi: 10.3109/09537104.2014.898141
- Ponschab M, Schlimp CJ, Zipperle J, et al. Platelet function in reconstituted whole blood variants. J Trauma Acute Care Surg. 2015;79(5):797–804. doi: 10.1097/TA.0000000000000852
- Jobes D, Wolfe Y, O'Neill D, et al. Toward a definition of “fresh” whole blood: an in vitro characterization of coagulation properties in refrigerated whole blood for transfusion. Transfusion. 2011;51(1):43–51. doi: 10.1111/j.1537-2995.2010.02772.x
- Pidcoke HF, McFaul SJ, Ramasubramanian AK, et al. Primary hemostatic capacity of whole blood: a comprehensive analysis of pathogen reduction and refrigeration effects over time. Transfusion. 2013;53(Suppl. 1):137s–149s. doi: 10.1111/trf.12048
- Rodgers SE, Lloyd JV, Russell WJ. Platelet function in platelet concentrates and in whole blood. Anaesth Intensive Care. 1985;13(4):355–361.
- Kornblith LZ, Howard BM, Cheung CK, et al. The whole is greater than the sum of its parts. J Trauma Acute Care Surg. 2014;77(6):818–827. doi: 10.1097/TA.0000000000000354
- Panzer S, Jilma P. Methods for testing platelet function for transfusion medicine. Vox Sang. 2011;101(1):1–9. doi: 10.1111/j.1423-0410.2011.01467.x
- Vinholt PJ, Hvas AM, Nybo M. An overview of platelet indices and methods for evaluating platelet function in thrombocytopenic patients. Eur J Haematol. 2014;92(5):367–376. doi: 10.1111/ejh.12262
- De Cuyper IM, Meinders M, van de Vijver E, et al. A novel flow cytometry-based platelet aggregation assay. Blood. 2013;121(10):e70–e80. doi: 10.1182/blood-2012-06-437723
- Stenberg PE, McEver RP, Shuman MA, et al. A platelet alpha-granule membrane protein (GMP-140) is expressed on the plasma membrane after activation. J Cell Biol. 1985;101(3):880–886. doi: 10.1083/jcb.101.3.880
- Bennett JS. Regulation of integrins in platelets. Biopolymers. 2015;104(4):323–333. doi: 10.1002/bip.22679
- Lyngvig J. Bekendtgørelse om kvalitets- og sikkerhedskrav til blodbankvirksomhed BEK. nr. 1230 af 08.12.2005. [Danish law executive order no. 1230 of 08.12.2005 concerning quality and safety requirements at blood banks]. Lovtidende A: Danish Medicines Agency 16.12. 2005. Contract No.: AI002066.
- Reddoch KM, Pidcoke HF, Montgomery RK, et al. Hemostatic Function of Apheresis Platelets Stored at 4°C and 22°C. Shock. 2014;41(Suppl. 1):54–61. doi: 10.1097/SHK.0000000000000082
- Macher S, Sipurzynski-Budrass S, Rosskopf K, et al. Function and activation state of platelets in vitro depend on apheresis modality. Vox Sang. 2010;99(4):332–340. doi: 10.1111/j.1423-0410.2010.01353.x
- Albanyan AM, Murphy MF, Rasmussen JT, et al. Measurement of phosphatidylserine exposure during storage of platelet concentrates using the novel probe lactadherin: a comparison study with annexin V. Transfusion. 2009;49(1):99–107. doi: 10.1111/j.1537-2995.2008.01933.x
- Lozano ML, Rivera J, Gonzalez-Conejero R, et al. Loss of high-affinity thrombin receptors during platelet concentrate storage impairs the reactivity of platelets to thrombin. Transfusion. 1997;37(4):368–375. doi: 10.1046/j.1537-2995.1997.37497265336.x
- Rinder HM, Murphy M, Mitchell JG, et al. Progressive platelet activation with storage: evidence for shortened survival of activated platelets after transfusion. Transfusion. 1991;31(5):409–414. doi: 10.1046/j.1537-2995.1991.31591263195.x
- Bock M, Rahrig S, Kunz D, et al. Platelet concentrates derived from buffy coat and apheresis: biochemical and functional differences. Transfusion Med. 2002;12(5):317–324. doi: 10.1046/j.1365-3148.2002.00392.x