
ABSTRACT
Objectives: The diagnosis of myelodysplastic syndrome (MDS) is not always straightforward in the absence of objective markers such as ringed sideroblasts, an excess of blasts or clonal cytogenetic abnormalities. Moreover, the lack of specificity of morphological dysplasia makes the differentiation between MDS and other causes of peripheral cytopenia difficult. The WHO 2016 classification of MDS recognizes multiparameter flow cytometry (MFC) as an adjuvant tool for MDS diagnosis. An easily applicable MFC protocol based on CD34 and CD45 is proposed by Ogata et al. Furthermore, in the diagnostic workup of patients with peripheral cytopenia, the integration of MFC by means of a Lymphoid Screening Tube (LST) is recommended by the EuroFlow™ consortium. The aim of this study was to investigate whether the LST, supplemented with CD34, can be used to calculate the Ogata score, thereby obviating the need to run different flow cytometric tubes.
Methods: Bone marrow samples from 108 patients with peripheral cytopenia were analyzed (MDS n = 32; non-MDS n = 76). The LST used in the present study was based on the tube designed by the EuroFlow™ consortium, but with addition of CD34 and without TCRγδ.
Results: Rather low sensitivities of 55% in low-grade MDS patients and 80% in high-grade MDS patients were observed. However, a high specificity of 92% was found in the non-MDS group.
Conclusion: Besides screening for clonal lymphocytes, plasma cells and blasts, an LST supplemented with CD34 allows the calculation of the Ogata score as an adjuvant tool in the diagnostic workup of cytopenic patients suspected of MDS.
1. Introduction
Myelodysplastic syndromes (MDS) are clonal bone marrow (BM) disorders, characterized by peripheral cytopenia and dysplasia in one or more cell lines. The diagnosis is straightforward if objective markers such as ringed sideroblasts, an excess of blasts or clonal cytogenetic abnormalities are present. However, objective markers are found in less than half of the MDS patients. The diagnosis in patients without those markers largely relies on the presence of morphological dysplasia in BM smears according to the subjective judgement of the examiner, implying poor reproducibility of the morphologic analysis. Moreover, the lack of specificity of dysplastic changes makes the differentiation between MDS and other causes of cytopenia difficult. Other clonal disorders (e.g. lymphoma, myeloma, acute leukemia) as well as non-clonal causes are important in the differential diagnosis of peripheral cytopenia too [Citation1–5]. Hence, there is a need for other diagnostic criteria. The WHO 2016 classification of MDS recognizes multiparameter flow cytometry (MFC) as an adjuvant tool for MDS diagnosis. An easily applicable MFC protocol based on CD34 and CD45 is proposed by Ogata et al. [Citation6,Citation7]. Furthermore, in the workup of patients with peripheral cytopenia, the integration of MFC by means of a Lymphoid Screening Tube (LST) is recommended by the EuroFlow™ consortium [Citation8]. However, while the LST enables the evaluation of aberrant lymphocytic or plasmocytic populations, it does not enable the calculation of the Ogata score for MDS because of the lack of anti-CD34 in the antibody panel. Therefore, at least two flow cytometric panels – one LST and one for Ogata score calculation – would be required in the diagnostic workup of patients with cytopenia. The aim of this study was to investigate whether the LST, supplemented with CD34, can be used as a single flow cytometric tube to calculate the Ogata score, in addition to its established capacity to screen for clonal populations.
2. Materials and methods
Patients
All BM samples received in the laboratory of the AZ Sint-Jan Hospital, Bruges, Belgium, between January 2016 and December 2016 for investigation of unexplained peripheral blood cytopenia (n = 108) were analyzed in this study. Samples from patients with clinical suspicion of B-cell or T-cell lymphoma (e.g. based on the presence of adenopathies or lymphocytosis) were excluded.
Microscopic evaluation of dysplasia on BM smears was based on a consensus of two experienced examiners. Samples were categorized in three categories based on the microscopic evaluation: significant, insignificant or no dysplasia. Significant dysplasia was defined as ≥10% dysplastic cells in any hematopoietic lineage, according to the WHO criteria [Citation9]. Patient characteristics are shown in .
Table 1. Patient characteristics and microscopic evaluation of dysplasia.
Definitive diagnosis of MDS was made by the clinician according to the WHO criteria, based on extensive history taking, cytomorphology and cytogenetics, but not on flowcytometric data. The study population comprised 32 patients with MDS to evaluate the sensitivity, and 76 patients with other causes of peripheral cytopenia (non-MDS) to evaluate the specificity. As the myeloblast percentage is a critical factor in defining the WHO MDS categories and in the Revised International Prognostic Scoring System (IPSS-R), MDS patients were further classified in two groups as previously published: a low-grade group with less than 5% of BM blasts (SLD, MLD, RS-SLD, RS-MLD, 5q-), and a high-grade group with at least 5% of BM blasts (EB-1, EB-2) [Citation6,Citation7,Citation9].
Methods
Methods for sample preparation and instrument set-up were in accordance with the recommendations of the EuroFlow™ consortium [Citation10]. BM was collected in EDTA tubes (Sarstedt, Nümbrecht, Germany).
The LST used in the present study was based on the tube designed by the EuroFlow™ consortium, but with addition of CD34 and without TCRγδ. A preliminary validation study demonstrated that the addition of CD34 did not affect the results of the other monoclonal antibodies present in the LST (data not shown). Monoclonal antibodies used were: CD20 (HV450); CD4 (HV450); CD45 (HV500); CD8 (FITC); Lambda/Kappa (FITC/PE); CD56 (PE); CD5 (PerCP-Cy5.5); CD34 (PerCP-Cy5.5); CD19 (PE-Cy7); CD3 (APC); CD38 (APC-H7). Antibodies were obtained from Becton Dickinson (Erembodegem, Belgium) (CD20; CD4; CD45; CD8; CD5; CD34; CD3; CD38), Cytognos (Salamanca, Spain) (Lambda/Kappa; CD56) and Beckman Coulter (Suarlée, Belgium) (CD19).
Data were acquired using a FACSCantoII cytometer and analyzed with FACSDiva software (Becton Dickinson) by investigators who were blinded to the patients’ clinical and laboratory data, including the diagnosis.
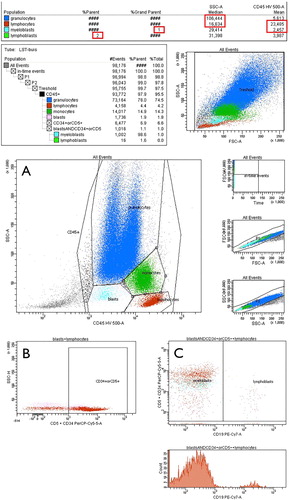
The Ogata score is calculated based on four parameters. One point is given per parameter outside the reference ranges (RR): (i) the percentage of CD34+ myeloblasts in all nucleated cells (RR < 2%); (ii) the percentage of CD34+ B-cell progenitors in all CD34+ cells (RR > 5%); (iii) the lymphocytes/myeloblasts CD45 expression ratio, defined as the mean fluorescence intensity (MFI) of CD45 on lymphocytes ÷ MFI of CD45 on CD34+ myeloblasts (RR 4–7.5); (iv) granulocytes/lymphocytes SSC peak channel ratio, defined as the median SSC-A of granulocytic cells ÷ median SSC-A of lymphocytes (RR > 6). The Ogata score is considered positive, and thus suggestive of MDS, if a value of 2 or more is observed [Citation6,Citation7]. The gating was further improved by the additional labeling of CD19 to better target B-cell progenitors according to a study of Bardet et al. [Citation11]. The gating strategy is shown in (Ogata score calculation is supplied in ).
Figure 1. Gating strategy. (A) Granulocytes, lymphocytes, monocytes and blasts were defined in a CD45-versus-SSC plot. (B) Subsequently, CD34+ blasts were identified as the compound gate of the former defined “blasts” gate and the “CD34+ or CD5+” gate defined in a CD34-versus-SSC plot. (C) In a final step CD34+ blasts were displayed in a CD19-versus-CD34 plot to define CD34+ B-cell progenitors (CD19+CD34+) and myeloblasts (CD19-CD34+). SSC of lymphocytes and granulocytes and CD45 mean intensity of lymphocytes and myeloblasts were computed by the FACSDiva software (Becton Dickinson) (statistics shown at the top).
Sensitivity and specificity calculation was performed using Microsoft® Excel 2010 (Microsoft Corp., Redmond, WA, USA).
3. Results
The study population consisted of 32 patients with a definitive diagnosis of MDS and 76 patients with non-MDS cytopenia (detailed results are supplied in ).
Of 32 MDS patients included, 22 were classified as low-grade, and 10 as high-grade. Overall, a positive Ogata score was obtained in 20/32 MDS cases (sensitivity 63%): 12/22 (55%) cases of the low-grade group and 8/10 (80%) cases of the high-grade group ().
Table 2. Results Ogata score.
Microscopic evaluation in the group of high-grade MDS patients (n = 10) showed significant morphological dysplasia in all cases. Microscopic evaluation in the group of low-grade MDS patients (n = 22) showed significant morphological dysplasia in 16/22 cases and insignificant dysplasia in 6/22 cases (). When considering the samples with insignificant morphological dysplasia, a correct diagnosis by use of the Ogata score was obtained in 4/6 cases.
A false positive Ogata score was found in 6/76 non-MDS cases (specificity 92%). Samples with false positive Ogata score included patients with renal anemia (n = 1), iron deficiency anemia (n = 1), immune pancytopenia (n = 1), reactive cytopenia (toxic/infectious; n = 2) and idiopathic cytopenia (n = 1) ().
When considering samples of non-MDS patients with a morphological analysis incorrectly suspicious for dysplasia (5/76), a false positive Ogata score was obtained in 2/5 samples and a correct negative score in 3/5 samples. In none of the 13/76 non-MDS cases with insignificant morphological dysplasia a false positive score was found. The majority of non-MDS cases were morphologically not suspicious for MDS (58/76), a false positive score was found in 4/58 samples of this group ().
Overall, a positive predictive value (PPV) of 77% (20/26) and a negative predictive value (NPV) of 85% (70/82) was observed by using the Ogata score for MDS diagnosis ().
4. Discussion
In this study we investigated the value of the Ogata score based on an LST, which comprises CD34, in the diagnostic workup of patients with peripheral cytopenia. Of note, an LST containing CD34 has recently become commercially available (Beckman Coulter ClearLLab).
Altogether, the sensitivity of the Ogata score was rather poor, especially in low-grade MDS patients (55%). These results are comparable to earlier published studies where variable, but low sensitivities (44–71%) were found in MDS patients without an excess of blasts [Citation6,Citation7,Citation11]. In the group of high-grade MDS patients, we found a higher sensitivity (80%) suggesting that the detection of BM dysplasia with MFC is increased with progression of disease, as proposed in earlier studies [Citation11–13]. However, the Ogata score did not have an important additional value in this high-grade category as the morphological analysis was suggestive of MDS in all samples.
The specificity (92%) of the Ogata score was high, in concordance with earlier published studies (89–98%) [Citation6,Citation7,Citation11]. Recently a new scoring system including a new parameter (granulocyte/CD34 cell CD33 ratio) was proposed by Ogata et al [Citation14]. The revised FCM mini-panel is valuable as it results in a slightly higher sensitivity (around 50%) and specificity (more than 95%) in diagnosing low-grade MDS compared to the original score, despite the fact that only 3 parameters are measured. However, the little gain in performance is opposed to the fact that the additional parameter, CD33, is not included in the LST and therefore needs to be analyzed in a separate panel, implicating a higher cost and loss of simplicity.
When considering the microscopic evaluation of all samples, insignificant dysplasia was found in 19 cases. In this group, a true positive Ogata score was found in 4 of the 6 MDS cases and a true negative score in 13 of the 13 non-MDS cases, thereby correctly diagnosing 4 additional MDS cases when compared to morphological evaluation alone. These data demonstrate the added value of MFC to microscopy. Furthermore, the calculation and interpretation of the Ogata score based on our LST with CD34 was easy and cost-efficient in terms of workload and consumption of reagents.
By using the LST with CD34 to calculate the Ogata score, we encounter the guideline proposed by Porwit et al. to use a mini-panel based on the Ogata score for screening purposes in the diagnostic work-up of MDS [Citation15]. However, the rather low NPV and PPV form a considerable limitation of this mini-panel. Hence, for BM samples from patients where the diagnosis of MDS is strongly suspected based on clinical data, more comprehensive panels including erythroid lineage maturation analysis are recommended [Citation15–17].
In conclusion, besides screening for clonal lymphocytes, plasma cells and blasts, an LST supplemented with CD34 allows the calculation of the Ogata score by using a single flow cytometric tube as an adjuvant tool in the diagnostic workup of cytopenic patients suspected of MDS.
Acknowledgements
The authors report no conflict of interest.
Disclosure statement
No potential conflict of interest was reported by the author.
Related Research Data
References
- Della Porta MG, Lanza F, Del Vecchio L. Flow Cytometry immunophenotyping for the evaluation of bone marrow dysplasia. Cytometry Part B. 2011;80B:201–211. doi: 10.1002/cyto.b.20607
- Rajab A, Porwit A. Screening bone marrow samples for abnormal lymphoid populations and myelodysplasia-related features with one 10-color 14-antibody screening tube. Cytometry Part B. 2015;88:253–260. doi: 10.1002/cyto.b.21233
- Stetler-Stevenson M, Yuan M. Myelodysplastic syndromes: the role of flow cytometry in diagnosis and prognosis. Int J Lab Hematol. 2009;31:479–483. doi: 10.1111/j.1751-553X.2009.01176.x
- Truong F, Smith BR, Stachurski D, et al. The utility of flow cytometric immunophenotyping in cytopenic patients with a non-diagnostic bone marrow: A prospective study. Leuk Res. 2009;33:1039–1046. doi: 10.1016/j.leukres.2009.01.012
- Malcovati L, Hellström-Lindberg E, Bowen D, et al. Diagnosis and treatment of primary myelodysplastic syndromes in adults: recommendations from the European LeukemiaNet. Blood. 2013;122:2943–2964. doi: 10.1182/blood-2013-03-492884
- Ogata K, Della Porta MG, Malcovati L, et al. Diagnostic utility of flow cytometry in low-grade myelodysplastic syndromes: a prospective validation study. Haematologica. 2009;94:1066–1074. doi: 10.3324/haematol.2009.008532
- Della Porta MG, Picone C, Pascutto C, et al. Multicenter validation of a reproducible flow cytometric score for the diagnosis of low-grade myelodysplastic syndromes: results of a European LeukemiaNET study. Haematologica. 2012;97:1209–1217. doi: 10.3324/haematol.2011.048421
- van Dongen JJM, Lhermitte L, Böttcher S, et al. Euroflow antibody panels for standardized n-dimensional flow cytometric immunophenotyping of normal, reactive and malignant leukocytes. Leukemia. 2012;26:1908–1975. doi: 10.1038/leu.2012.120
- Swerdlow SH, Campo E, Harris NL, et al. WHO classification of tumours of haematopoietic and lymphoid tissues. Lyon: IARC Press; 2017.
- Kalina T, Flores-Montero J, van der Velden VH, et al. Euroflow standardization of flow cytometer instrument settings and immunophenotyping protocols. Leukemia. 2012;26:1986–2010. doi: 10.1038/leu.2012.122
- Bardet V, Wagner-Ballon O, Guy J, et al. Multicentric study underlining the interest of adding CD5, CD7 and CD56 expression assessment to the flow cytometric Ogata score in myelodysplastic syndromes and myelodysplastic/myeloproliferative neoplasms. Haematologica. 2015;100:472–478. doi: 10.3324/haematol.2014.112755
- Van de Loosdrecht AA, Westers TM, Westra AH, et al. Identification of distinct prognostic subgroups in low- and intermediate-1-risk myelodysplastic syndromes by flow cytometry. Blood. 2008;111:1067–1077. doi: 10.1182/blood-2007-07-098764
- Wells DA, Benesch M, Loken MR, et al. Myeloid and monocytic dyspoiesis as determined by flow cytometric scoring in myelodysplastic syndrome correlates with the IPSS and with outcome after hematopoietic stem cell transplantation. Blood. 2003;102:394–403. doi: 10.1182/blood-2002-09-2768
- Ogata K, Sei K, Saft L, et al. Revising flow cytometric mini-panel for diagnosing low-grade myelodysplastic syndromes: introducing a parameter quantifying CD33 expression on CD34+ cells. Leuk Res. 2018;71:75–81. doi: 10.1016/j.leukres.2018.07.009
- Porwit A, van de Loosdrecht A, Bettelheim P, et al. Revisiting guidelines for integration of flow cytometry results in the WHO classification of myelodysplastic syndromes proposal from the international/European LeukemiaNet working group for flow Cytometry in MDS. Leukemia. 2014;28:1793–1798. doi: 10.1038/leu.2014.191
- Westers T, Cremers E, Oelschlaegel U, et al. Immunophenotypic analysis of erythroid dysplasia in myelodysplastic syndromes. A report from the IMDSFlow working group. Haematologica. 2017;102:308–319. doi: 10.3324/haematol.2016.147835
- Cremers E, Westers T, Alhan C, et al. Implementation of erythroid lineage analysis by flow cytometry in diagnostic models for myelodysplastic syndromes. Haematologica. 2017;102:320–326. doi: 10.3324/haematol.2016.147843
Appendices
Appendix 1. Example of Ogata score calculation
The calculation of the Ogata score for the sample shown in was performed as follows (based on the statistics computed by the FACSDiva software, Becton Dickinson):