
ABSTRACT
Objectives: This study aimed to estimate the prevalence of liver fibrosis and assess the risk factors for developing significant liver fibrosis in patients with Thalassemia Major (TM).
Methods: All patients with TM over the age of 10 years were included in the study.
Results: A total of 94 eligible patients underwent 2-D SWE. The median age was 26.7 years. The median of the average 5-year serum ferritin (5yrSF) and liver iron concentration (LIC) assessed by MRI T2* were 1326 µg/L and 6.7 mg/g dw, respectively. Hepatitis C and hepatitis B core antibodies were positive in 38% and 1% of the patients respectively. The proportion of patients with significant fibrosis was 60%. Male gender increased the risk of significant fibrosis (Odds ratio of 0.4; p = .0373). Additionally, the 5yrSF (p = .00661), the LIC (p = .0225) and the lowest LIC of the previous 5 years (p = .0211) were significant. In the multivariable logistic regression model, only 5yrSF (p = .0035) and gender (p = .00984) remained significant.
Conclusions: The risk of liver fibrosis is associated with iron overload and gender in patients with TM.
Introduction
Beta Thalassemia Major (TM) is a hereditary anemia characterized by absent or decreased production of beta-globin chains and is associated with considerable morbidity and mortality [Citation1–4]. The prevalence of beta thalassemia trait in Oman is 2% [Citation5]. Adult patients with TM represent a population with a high prevalence of hepatitis C due to transfusions of HCV infected blood units prior to the introduction of HCV screening. In addition, iron overload is another major morbidity mainly due to long-term transfusion therapy, ineffective erythropoiesis and increased iron absorption [Citation4,Citation6].
Liver biopsy is a cornerstone in the evaluation of patients with liver diseases. However, it is an invasive procedure with a number of limitations [Citation7]. These include potential morbidity and mortality, as well as susceptibility to inter-observer variability and sampling error. In addition, repeat biopsies are not well-tolerated and therefore not suitable for monitoring disease progression. According to international guidelines, fibrosis staging should be initially assessed using non-invasive measures including serum markers and elastography [Citation8]. Shear Wave elastography (SWE) is an imaging technique which quantifies tissue stiffness by measuring the speed of the shear waves in tissue [Citation9]. It is becoming an attractive technology for assessment of liver fibrosis as it is readily available, non-invasive, accurate, low cost, reproducible, and suitable for use in a variety of clinical settings. There are limited data about the role of Transient Elastography (TE) in the assessment of liver fibrosis in patients with TM and no data on the utility of the 2-D SWE imaging technique in such cases [Citation10–13]. Therefore, the present study aimed to stage liver fibrosis in patients with TM using the 2-D SWE imaging technique in staging hepatic fibrosis and evaluating risk factors associated with significant fibrosis.
Methods
This is a single-center, cross-sectional study (carried out over a period of nine months) of adolescent and adult patients (age ≥ 10 years) with TM, who were regularly followed by the Hematology Department of Sultan Qaboos University Hospital, Muscat, Oman. 94 patients were enrolled in the study. The study was conducted according to the guidelines of the Helsinki declaration and approved by the Ethics Committee of our institution. Patients with clinical evidence of liver cirrhosis were excluded.
The patients’ characteristics, epidemiological data and biochemical test results were retrieved from the hospital electronic charts. The 2-D SWE imaging (GE LOGIQ E9 XDclear 2.0; GE Healthcare, Milwaukee, WI, USA) was performed on all patients in a non-fasting state as previously described [Citation14] and liver ultrasound was done at the same time. All the exams were performed by a single operator and the scans were interpreted by a single radiologist. In addition to SF at time of the study, we also calculated the average SF for each patient over the preceding 5 years (5yrSF) on the basis that liver fibrosis takes time to develop and therefore a longer term SF may be more useful. There were a minimum of 6 serum ferritin readings per patient per calendar year. Patients all undergo cardiac and liver T2* Magnetic Resonance Imaging (MRI) routinely as the standard of care at our center. MRI T2* results were from studies conducted ±3months with respect to the date of the 2-D SWE imaging. We also identified the highest and lowest LIC that had been found for each individual patient in the previous 5 years. Routine biochemical tests are performed on alternate months and data was retrieved from the hospital information system. The beta thalassemia mutations had previously been identified using Amplification Refractory Mutation System (ARMS)-hot start-polymerase chain reaction (PCR) technique [Citation15]. We used the E median measurement from the 2-D SWE to classify the degree of fibrosis; the E median cut off levels for F0, F1, F2, F3 and F4 were ≤ 7.1, >7.1–7.8, >7.8–8.0, >8.0–11.5 and >11.5 KPA, respectively [Citation16]. We classified F2 and higher as significant fibrosis [Citation16,Citation17] (expressed as Liver Stiffness Measure [LSM] and used interchangeably) and all associations were tested with this outcome.
Statistical analysis
Continuous variables were presented as means or medians as appropriate. Categorical variables were presented as frequencies. Univariable logistic regression was used to assess the impact of gender, age, 5yrSF, LIC and lowest LIC in the prior five years. Factors with p-value of <.05 were then tested in a multivariable logistic regression model. The 5yrSF, LIC and the lowest LIC are expected to be collinear; we, therefore, chose the 5yrSF for the multivariable model. Additionally, among all iron overload measurements, this is the one readily available in most thalassemia centers. All descriptive and analytical statistics were performed using the R program version 3.1.2. [Citation18].
Results
Baseline characteristics
A total of 94 patients with TM were enrolled in this study with a mean age of 26.7 years (IQR: 22.4–30.1). Males constituted 42 patients of the cohort. The commonest genotype was homozygous IVS 1-5 G > C (39 patients) followed by homozygous codon 44 -C (19 patients). Twenty-six patients had only positive serology for HCV and 9 had HCV viremia. One third (31 patients) had been splenectomised. The median SF, LIC and Cardiac T2* at the time of 2-D SWE for the whole cohort were 1420 μg/L (IQR: 752–2920), 6.7 g/g dw (IQR: 3.5–16.1), and 33 milliseconds (IQR: 18–40), respectively. The median ALT, AST, total bilirubin and albumin were 30 U/L (IQR: 18–65), 30 U/L (IQR: 18–47), 22 μmol/L (IQR: 14–33) and 46 g/L (IQR: 43–48), respectively. Sixty-three patients (65%) had evidence of steatosis as assessed by ultrasound. Further details of the baseline characteristics are shown in and .
Table 1. Baseline clinical characteristics (n = 94).
Table 2. Baseline laboratory characteristics (n = 94).
Liver fibrosis and assessment of predictors
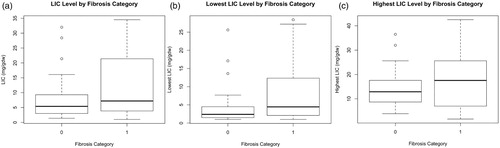
Ninety-four patients underwent 2-D SWE. The proportions of patients having F0, F1, F2, F3 and F4 were 26% (24 patients), 15% (14), 4% (4), 42% (40) and 13% (12), respectively. Sixty percent of patients (56) were classified as having significant LSM (F2 and higher). Within the male group, 71% had significant LSM on 2-D SWE, compared to 50% of the female group with a statistically significant difference (female to male Odds Ratio [OR] 0.4; p = .0373). The median SF at time of the 2-D SWE was 1168 μg/L in patients with no significant LSM and 1933 μg/L in those with LSM with a statistically significant difference (p = .0008149; ). The median 5yrSF was 1122 μg/L in patients with no significant LSM and 2051 μg/L in patients with significant LSM with a statistically significant difference (p = .00661; ). The LIC was higher in patients with significant LSM (median LIC of 7.2 g/g dw) than in patients without significant LSM (median LIC 5.4 g/g dw) and this difference was also statistically significant (p = .0225; ). Furthermore, the lowest LIC in the preceding 5 years predicted a lower risk of fibrosis with a median of 2.4 g/g dw in patients without significant LSM compared to 4.5 g/g dw in patients with significant LSM (p = .0211; ). The difference in the highest LIC in the preceding five years between the groups with and without significant LSM was not significant (p = .0932; ). There was no association between significant LSM and age (p = .656), genotype (p = .665), HCV seropositivity (p = .318), cardiac T2* (p = .207) or diabetes (p = .128). In the multivariable logistic regression model using the 5yrSF and gender to predict the risk of significant LSM, both 5yrSF (p = .0035) and gender (p = .00984) remain statistically significant.
Figure 1. Serum ferritin in patients without and with significant fibrosis.
Notes: The figure illustrates the median and interquartile range for the serum ferritin at the time of ultrasound (A) and the average serum ferritin of the preceding 5 years (B) in patients without (Category 0) and with significant fibrosis (Category 1).
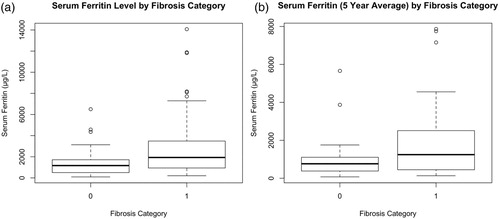
Figure 2. Liver iron concentration in patients without and with significant fibrosis.
Notes: The figure illustrates the median and interquartile range for the Liver Iron Concentration (LIC) at the time of ultrasound measurement (A), and both the lowest (B) and the highest (C) LIC in the preceding 5 years in patients without (Category 0) and with significant fibrosis (Category 1).
2-D Shear wave elastography
In this study, there were no liver biopsies available to correlate and validate the 2D-SWE. The increased homogenous echogenicity on abdominal Ultrasound consistent with steatosis correlated with the 2-D SWE. Patients with steatosis on abnormal Ultrasound (US) of the liver had a higher probability of having significant LSM on the 2D-SWE (OR 2.5; p = .01825) consistent with a concurrent validity. We assessed the impact of BMI on the precision of the 2-D SWE using the variability in measurements of E1 to E10 (assessed using the standard deviation of the E1-10 measurements). The Spearman’s correlation coefficient of the BMI with the distribution variability was very low (r = 0.19). This suggests that the BMI does not affect the precision of the 2D-SWE estimates.
Discussion
Transient elastography has been used for many years to evaluate and measure liver fibrosis. However, shear wave elastography has been developed relatively recently. A review comparing different elastography methods found that 2-D SWE is generally superior to TE for milder fibrosis stages and comparable to TE for identifying liver cirrhosis, although only few studies are available [Citation19,Citation20]. To the best of our knowledge, there are no published studies using 2-D SWE in patients with TM. Patients included in this study are representative of TM patients from the whole country. The thalassemia center at SQUH is the largest and the oldest in Oman, opening in 1991 when almost all patients with TM being treated in other hospitals were transferred to SQUH. Until 1998, all newly diagnosed patients were also treated at SQUH.
In our studied population, the proportion of patients with significant fibrosis was relatively high at 60%. Although many of our patients had been previously infected with HCV, evidenced by the high rate of positive serology (30%), we did not find a correlation between HCV seropositivity and significant LSM. Elaify et al. [Citation21] identified a very high number of TM patients with both fibrosis (35%) and cirrhosis (24%), despite studying a relatively young population and found a positive correlation with HCV seropositivity. In contrast to this, two Italian studies [Citation11,Citation22] found that 33.6% and 35% of their TM patients to have significant fibrosis and neither found a correlation with the HCV seropositivity. However, both of the Italian studies had older patients than in our study and had relatively high numbers of HCV RNA positive patients. The contrasting results of these studies suggest that the correlation in the Egyptian population was due to the combination of HCV viremia and the heavier iron load in that cohort (LIC of 12 vs. 5.91 and 4.58 g/g dw in the Italian studies) [Citation11,Citation21,Citation22].
There have been conflicting results regarding the relationship of LSM and LIC. Three important studies [Citation10,Citation11,Citation22] found no correlation between LSM and LIC, whereas our study found a large and significant difference in LIC between patients with and without significant LSM. Supporting our result, a recent study [Citation23] found that fibrosis measured by TE significantly improved as LIC improved after 4 years of chelation therapy. However, in this study, in a subset of HCV RNA positive patients on anti HCV treatment, there was no correlation with LIC despite the improvement in LSM. Maira et al. [Citation23] postulated that this could be due to the increased transfusion requirements during HCV treatment. It is interesting to note that in the three studies in which no correlation was found, the percentage of HCV RNA positive patients ranged between 35% and 49% [Citation10,Citation11,Citation22]. In our study, only 9.6% of patients had HCV RNA viremia at the time of study, a relatively low proportion. In another study by Sinakos et al. [Citation24] where no patients had HCV viremia, a correlation between LSM and LIC was also found. This suggests that HCV status has a role to play in the contradictory LSM results as also suggested by Sinakos et al. The role could be through a positive synergistic interaction where HCV viremia increases the impact of the LIC on the risk of development of fibrosis. The other possible explanation of a positive correlation of LSM and LIC in our study, compared to some other studies, is that we used a more sensitive method of elastography, 2-D SWE, while the other studies used TE. The contribution of this factor is unlikely to be large in that we also found a positive correlation between the 5yrSF and the LSM, suggesting it is the iron interacting with the HCV viremia that leads to liver fibrosis.
In our study, age did not impact the risk of significant liver fibrosis development. Our patients are relatively young and the older patients in our cohort started chelation relatively late. In a model where chelation is not included (assuming a negative correlation), the impact of age may have been neutralized. In addition, our unit used combined chelation (deferiprone and deferroxamine) therapy in most patients over the age of 6 years from 2000 to 2009, and many have continued on this regimen with excellent results [Citation25]; this may also have had an impact as has been suggested by a recent report [Citation23]. In addition, some studies that showed a correlation of fibrosis with age included a large number of patients who were HCV RNA positive consistent with our previous hypothesis that it is the presence of the HCV viremia that positively interacts with iron leading to more fibrosis rather than the age of the individual [Citation10,Citation11].
In our study, we confirmed the finding of increased risk of liver fibrosis in males when compared to females in patients with TM as described by Prati et al. [Citation3]. A similar risk has been found in HCV related liver disease [Citation26]. This consistency suggests that the male gender is an independent factor for liver fibrosis. In our multivariable model, the gender association was independent of the iron overload estimated by the average of serum ferritin over 5 years. This suggests that males are more likely to have fibrosis even when they have similar ferritin levels to their female counterparts. The impact of gender is also found in other outcomes in patients with TM. Marsella et al. [Citation27] have shown that females with TM survive longer than males, despite having similar cardiac and liver iron based on MRI T2*. It has been theorized that females tolerate iron toxicity better as they have increased tolerance to chronic oxidative stress [Citation27,Citation28]. This may explain the increased risk of liver fibrosis in males independent of liver iron.
Close to two-thirds of our patients were found to have steatosis on ultrasound of the liver. Causes of steatosis include alcohol, obesity and diabetes. Alcohol is not widely used by our population and the median BMI was only 22. Another possible explanation is the high prevalence of diabetes or pre-diabetes in our cohort. Nearly a third of our patients were either pre-diabetic or diabetic. Additionally, the standard US of the liver may misclassify fibrosis as steatosis as both look white on US [Citation29]. The steatosis itself is unlikely to be a major contributor to the high rate of fibrosis seen in our cohort. A recent study by Poynard et al. has shown that steatosis has a low impact on fibrosis when measured using 2-D SWE [Citation30].
Our study has a number of limitations. The major limitation is the lack of a previous validation of the 2-D SWE in patients with TM. Ideally, these 2-D SWE measurements should have been correlated with the fibrosis grade obtained from liver biopsies. This is needed to establish the optimal cut off for significant fibrosis. However, with the introduction of MRI assessment of liver iron, this is not now a common routine practice. In an attempt to validate this, we tried to correlate the presence of significant LSM with the degree of LIC (LIC predicted significant LSM in our study suggesting validity). In addition, the echogenicity of the liver on the US was also associated with high LSM measurements (suggesting validity). Finally, the measurement of fibrosis is unlikely to be affected by etiology as it is the result of iron overload with or without viral hepatitis. Although the total sample size remains small, it is, nevertheless, one of the largest in this field. The 2-D SWE measurement was introduced recently in our center and hence patients who were lost to follow up or who had died could not undergo this measurement. This may introduce some selection bias in the assessment of the impact of baseline predictors. Despite the limitations, our study is one of the largest in looking into the impact of iron and other factors on the risk of liver fibrosis using 2-D SWE and the first in TM. The follow up in our cohort is long and the patients’ information on the available factors are taken from a prospectively collected database. The study was able to confirm the concurrent validity of using the 2-D SWE in patients with TM.
In conclusion, the risk of liver fibrosis is associated with iron overload and gender in patients with TM. There is no additional independent impact of the genotype, age, HCV seropositivity, cardiac T2* and diabetes. Male gender increases the risk of liver fibrosis independent from iron overload. Larger studies are needed to confirm these results and to elucidate the synergistic positive interaction between HCV viremia and the risk of liver fibrosis.
Acknowledgments
The authors thank all patients with thalassemia for agreeing to participate in this study and all the nurses of the daycare unit at Sultan Qaboos University Hospital for their support to conduct this study. MK performed the analysis and drafted the manuscript; SD and SB designed the study, collected the data and edited the manuscript; HD analyzed the abdominal ultrasound and edited the manuscript; AA collected the data and edited the manuscript; MH and SR consented the patients, collected the data and edited the manuscript. UA performed the 2D-SWE.
Disclosure statement
No potential conflict of interest was reported by the authors.
ORCID
Murtadha Al Khabori http://orcid.org/0000-0002-2937-8838
Related Research Data
References
- Borgna-Pignatti C, Rugolotto S, De Stefano P, et al. Survival and complications in patients with thalassemia major treated with transfusion and deferoxamine. Haematologica. 2004;89:1187–1193.
- Rund D, Rachmilewitz E. Β-thalassemia. N Engl J Med. 2005;353:1135–1146.
- Prati D, Maggioni M, Milani S, et al. Clinical and histological characterization of liver disease in patients with transfusion-dependent beta-thalassemia. A multicenter study of 117 cases. Haematologica 2004;89:1179–1186.
- Cohen AR. Thalassemia. Hematology 2004;2004:14–34.
- Al-Riyami AA, Suleiman AJ, Afifi M, et al. A community-based study of common hereditary blood disorders in Oman. East Mediterr Health J. 2001;7:1004–1011.
- Cunningham MJ, Macklin EA, Neufeld EJ, et al. Complications of beta-thalassemia major in North America. Blood. 2004;104:34–39.
- Friedman SL. Liver fibrosis – from bench to bedside. J Hepatol. 2003;38:38–53.
- EASL recommendations on treatment of hepatitis C 2016. J Hepatol. 2017;66:153–194.
- Sarvazyan AP, Rudenko OV, Swanson SD, et al. Shear wave elasticity imaging: a new ultrasonic technology of medical diagnostics. Ultrasound Med Biol. 1998;24:1419–1435.
- Di Marco V, Bronte F, Cabibi D, et al. Noninvasive assessment of liver fibrosis in thalassaemia major patients by transient elastography (TE) – lack of interference by iron deposition. Br J Haematol. 2010;148:476–479.
- Ferraioli G, Lissandrin R, Tinelli C, et al. Liver stiffness assessed by transient elastography in patients with β thalassaemia major. Ann Hepatol. 2016;15:410–417.
- Mirault T, Lucidarme D, Turlin B, et al. Non-invasive assessment of liver fibrosis by transient elastography in post transfusional iron overload. Eur J Haematol. 2008;80:337–340.
- Hamidieh AA, Shazad B, Ostovaneh MR, et al. Noninvasive measurement of liver fibrosis using transient elastography in pediatric patients with major thalassemia who are candidates for hematopoietic stem cell transplantation. Biol Blood Marrow Transplant. 2014;20:1912–1917.
- Song P, Macdonald M, Behler R, et al. Two-dimensional shear-wave elastography on conventional ultrasound scanners with time-aligned sequential tracking (TAST) and comb-push ultrasound shear elastography (CUSE). IEEE Trans Ultrason Ferroelectr Freq Control. 2015;62:290–302.
- Daar S, Hussein HM, Merghoub T, et al. Spectrum of beta-thalassemia mutations in Oman. Ann N Y Acad Sci. 1998;850:404–406.
- Sporea I, Bota S, Gradinaru-Taşcău O, et al. Which are the cut-off values of 2d-shear wave elastography (2d-swe) liver stiffness measurements predicting different stages of liver fibrosis, considering transient elastography (TE) as the reference method? Eur J Radiol. 2014;83:e118–e122.
- Intraobserver and interobserver variations in liver biopsy interpretation in patients with chronic hepatitis c. The French metavir cooperative study group. Hepatology. 1994;20:15–20.
- Team RC. R – a language and environment for statistical computing. Vienna: Rfoundation for statistical computing; 2006. ISBN3-900051-07-0; 2014. Available from: http://www.R-project.org
- Friedrich-Rust M, Lupsor M, de Knegt R, et al. Point shear wave elastography by acoustic radiation force impulse quantification in comparison to transient elastography for the noninvasive assessment of liver fibrosis in chronic hepatitis c: a prospective international multicenter study. Ultraschall Med. 2015;36:239–247.
- Ferraioli G, Parekh P, Levitov AB, et al. Shear wave elastography for evaluation of liver fibrosis. J Ultrasound Med. 2014;33:197–203.
- Elalfy MS, Esmat G, Matter RM, et al. Liver fibrosis in young Egyptian beta-thalassemia major patients: relation to hepatitis c virus and compliance with chelation. Ann Hepatol. 2013;12:54–61.
- Fraquelli M, Cassinerio E, Roghi A, et al. Transient elastography in the assessment of liver fibrosis in adult thalassemia patients. Am J Hematol. 2010;85:564–568.
- Maira D, Cassinerio E, Marcon A, et al. Progression of liver fibrosis can be controlled by adequate chelation in transfusion-dependent thalassemia (TDT). Ann Hematol. 2017;96:1931–1936.
- Sinakos E, Perifanis V, Vlachaki E, et al. Is liver stiffness really unrelated to liver iron concentration? Br J Haematol. 2010;150:247–248.
- Daar S, Pathare AV. Combined therapy with desferrioxamine and deferiprone in beta thalassemia major patients with transfusional iron overload. Ann Hematol. 2006;85:315–319.
- Rigamonti C, Andorno S, Maduli E, et al. Gender and liver fibrosis in chronic hepatitis: the role of iron status. Aliment Pharmacol Ther. 2005;21:1445–1451.
- Marsella M, Borgna-Pignatti C, Meloni A, et al. Cardiac iron and cardiac disease in males and females with transfusion-dependent thalassemia major: a t2* magnetic resonance imaging study. Haematologica. 2011;96:515–520.
- Proteggente AR, England TG, Rehman A, et al. Gender differences in steady-state levels of oxidative damage to DNA in healthy individuals. Free Radic Res. 2002;36:157–162.
- Karanjia RN, Crossey MM, Cox IJ, et al. Hepatic steatosis and fibrosis: non-invasive assessment. World J Gastroenterol. 2016;22:9880–9897.
- Poynard T, Pham T, Perazzo H, et al. Real-time shear wave versus transient elastography for predicting fibrosis: applicability, and impact of inflammation and steatosis. A non-invasive comparison. PLoS One. 2016;11:e0163276.