
Abstract
While animal housing conditions are highly controlled and standardized between different laboratories, there are still many subtle differences that unavoidably influence the host organisms and, consequently, interlaboratory reproducibility. Here, we investigated the physiological and immunological consequences between two light/dark cycle (LDC) lengths (14-h/10-h vs. 12-h/12-h LDC) and two commonly used forms of drinking water (acidified drinking water (AW) versus normal tap water (NW)) in single-housed (SH) mice. Our results indicate that SH mice bred under a 12-h/12-h LDC and NW at the supplier’s facility showed increased basal morning plasma corticosterone (CORT) levels even 4 weeks after arrival at our animal facility employing a 14-h/10-h LDC and AW. This effect was even more pronounced two weeks after arrival and had abated after 8 weeks. In agreement, increased plasma adrenocorticotropic hormone (ACTH), adrenal in vitro ACTH sensitivity, as well as relative and absolute adrenal weight normalized during this 8-week exposure to the novel and unfamiliar 14-h/10-h LDC and AW. Employment of a 12-h/12-h LDC in our facility completely abrogated the CORT-elevating effects of the 14-h/10-h LDC, despite these animals drinking AW. When both the water and light conditions were matched to those at the supplier’s facility, we observed a further reduction in adrenal weight, increased thymus weight, and decreased pro-inflammatory cytokine secretion of isolated and anti-CD3/28-stimulated mesenteric lymph node cells. In summary, our results indicate that prolonged alteration of both the light phase and drinking water represent severe and long-lasting stressors for laboratory rodents. These findings are of general interest for all scientists obtaining their experimental animals from conventional suppliers.
Introduction
Absence of experimental reproducibility between different laboratories poses a prominent biomedical research problem (Freedman et al., Citation2015). Therefore, substantial effort has been made to elucidate potential environmental factors that might influence the outcome of animal experiments. Two important, but controllable, factors that have been revealed to affect rodent behavior are experimenter sex and odor. Mice tested by male experimenters showed significantly lower baseline pain sensitivity in the hot-water tail withdrawal test, compared to mice tested by female experimenters. Interestingly, this effect could be replicated by simply using T-shirts worn by male or female experimenters, indicating that the experimenter’s odor plays a substantial role in mediating this effect. Consistently, experimenter sex also affected anxiety-related behavior during open-field testing (Sorge et al., Citation2014). Lack of interlaboratory reproducibility has also been reported for other well-known anxiety tests, such as the light-induced startle response (Walker et al., Citation2003). Given the reproducibility problems of such standardized behavioral tests, it is not surprising that these issues also impact complex animal models of chronic stress. The chronic mild stress (CMS) paradigm, which has been considered a reliable animal model for the induction of depressive-like behavior over many years, recently failed to induce comparable effects throughout different laboratories (Willner, Citation1997). In addition, while the repeated social defeat (SD) paradigm has produced social deficits, sometimes interpreted as depressive-like behavior, in C57BL/6 mice in different laboratories (Avgustinovich et al., Citation2005; Berton et al., Citation2006; Martinez et al., Citation1998), other groups (Razzoli et al., Citation2011; Savignac et al., Citation2011) were only able to reproduce these results in BALB/c mice; a mouse strain known to be highly stress susceptible (Palumbo et al., Citation2009). In the past few years, our group experienced difficulties in reproducing previously robust experimental data following a move from Regensburg to Ulm University (both Germany). In detail, physiological, immunological and behavioral differences that we consistently detected between chronically-stressed CSC (chronic subordinate colony housing) mice and respective nonstressed single-housed control mice over a decade in Regensburg were not reproducible in the Ulm facilities (own unpublished data). This suggested that the reproducibility of well-known CSC effects was compromised due to differences in environmental conditions since the experimental animals came from the same supplier.
Besides the above-mentioned effects of the experimenter, the general lack of experimental reproducibility is often attributable to differences in environmental housing conditions (Chesler et al., Citation2002; Crabbe et al., Citation1999). Although highly controlled and standardized, there are still many subtle differences in animal housing conditions between laboratories that unavoidably influence the host organisms and, consequently, interlaboratory reproducibility. For example, light is a highly important zeitgeber for various circadian rhythms (Ikeda et al., Citation2000) and it is well known that changing an entrained light/dark cycle (LDC) can severely affect the physiology and behavior of laboratory animals (Avgustinovich et al., Citation1997; Bach et al., Citation2010; Suer et al., Citation1998; Van der Meer et al., Citation2004). Although there have been a few rodent studies investigating the effect of changes in the light/dark phase length on reproduction (Darrow and Goldman, Citation1985; Prendergast et al., Citation2000), the vast majority of the behavioral, endocrine and immunological studies performed to date have simply investigated the consequence of shifting the light or dark phase back and forward, but keeping the light/dark phase lengths constant (Avgustinovich et al., Citation1997; Sudo & Miki, Citation1995; Suer et al., Citation1998). Another important factor to consider is the quality of drinking water provided for the animals. Whereas most animal facilities provide conventional tap water for their rodents, some provide acidified drinking water (AW; pH of 2.4) to prevent expansion of unwanted pathogens. Given the well-known interaction between the brain and the gut microbiota (Cryan & Dinan, Citation2012), it is plausible that AW, besides resulting in an enormous drop in the diversity of the intestinal microflora (Sofi et al., Citation2014), would also change the physiology and the behavior of treated animals. As AW further protects against bacteria-mediated disruption of the intestinal epithelial barrier function (Wu et al., Citation2006), AW treatment is likely to compromise many animal models of colitis, which often depend on bacterial translocation (Reber et al., Citation2011).
Given that standard housing conditions differed between Regensburg (12-h/12-h LDC, NW) and Ulm (14-h/10-h LDC, AW), this study aimed to investigate the effects of these two environmental factors on the physiology and the immune system in SH mice (Regensburg: SHR mice; Ulm: SHU mice). Pre- and postnatal differences during animal breeding can be excluded as contributing factors, as SH mice used in both facilities were purchased from the same animal supplier (Charles River, Sulzfeld, Germany).
Methods
Animals
Male C57BL/6N mice (Charles River, Sulzfeld, Germany) were used as experimental mice and delivered at 5–6 weeks of age (weighing 19–22 g). Afterwards all mice were individually housed in standard polycarbonate mouse cages (16 × 22 × 14 cm) for the rest of the experiment and kept under the following environmental conditions:
Animal set 1 (Regensburg): 12-h/12-h LDC, lights on at 06:00 a.m., 22 °C, 60% humidity, animals had free access to NW and standard mouse diet.
Animal set 2.1 and 2.2 (Ulm): 14-h/10-h LDC, lights on at 05:00 a.m., 22 °C, 60% humidity, animals had free access to AW (pH of 2.4; acidification by supplementation of hydrochloric acid to drinking water) and standard mouse diet.
Animal set 3 (Ulm): 12-h/12-h LDC, lights on at 06:00 a.m., 22 °C, 60% humidity, animals had free access to AW (pH of 2.4; acidification by supplementation of hydrochloric acid to drinking water) and standard mouse diet.
Animal set 4 (Ulm): 12-h/12-h LDC, lights on at 06:00 a.m., 22 °C, 60% humidity, animals had free access to NW and standard mouse diet.
At the end of each experiment, SHU and SHR mice were killed starting at 07:00 a.m. Of note, standard mouse diet was obtained from the same provider (Cat. No. V1535-000; SNIFF, Soest, Germany). All experimental protocols were approved by the Committee on Animal Health and Care of the local government and performed according to the international guidelines on the ethical use of animals. All efforts were made to minimize the number of animals used and their suffering.
Experimental procedures
Comparison of plasma corticosterone (CORT) between SH mice in Regensburg and Ulm
Experimental mice were obtained from Charles River (Sulzfeld, Germany, 12-h/12-h LDC) before either single housed for 16 days (n = 4) and 27 days (n = 8; these data have been already published in the Journal “Frontiers in Psychiatry” (Langgartner et al., Citation2015); usage of this data is in accordance with the journal) at Regensburg University (12-h/12-h LDC, Animal set 1) or 15/16 days (n = 7) and 27/28 days (n = 8) at Ulm University (14-h/10-h LDC, Animal set 2.1). For the assessment of plasma CORT levels, mice were euthanized by decapitation in the morning of days 15/16 (early phase (E)) or day 27/28 (middle phase (M)) in Ulm and Regensburg, respectively.
Comparison of physiological parameters between SH mice housed in a 14-h/10-h LDC (Ulm) for various durations
Experimental mice were obtained from Charles River (Sulzfeld, Germany, 12-h/12-h LDC) before either single housed for 16 days (n = 7; early phase (E), Animal set 2.1), 27/28 days (n = 8; middle phase (M), Animal set 2.1) or 56/57 days (n = 8; late phase (L), Animal set 2.2) at Ulm University (14-h/10-h LDC). For the assessment of body and adrenal weight, plasma adrenocorticotropic hormone (ACTH) and CORT concentrations and adrenal in vitro ACTH sensitivity, mice were euthanized by decapitation in the morning of respective days.
Comparison of plasma CORT between SH mice in Regensburg (12-h/12-h LDC) and Ulm (12-h/12-h LDC)
Experimental mice (Animal set 3) were obtained from Charles River (Sulzfeld, Germany, 12-h/12-h LDC) before either single housed for 15/16 days (n = 7; early phase (E)) or 27/28 days (n = 16; middle phase (M)) at Ulm University (12-h/12-h LDC). For the assessment of plasma CORT, mice were euthanized by decapitation in the morning of respective days. Plasma CORT levels were compared to respective SH mice from Regensburg (12-h/12-h LDC) (Animal set 1).
Comparison of physiological parameters between SH mice in Ulm (12-h/12-h LDC) watered with either NW or AW
Experimental mice (Animal set 4) were obtained from Charles River (Sulzfeld, Germany, 12-h/12-h LDC, NW) and single housed for 27/28 days with access to NW (n = 15) at Ulm University (12-h/12-h LDC). For the assessment of body, adrenal and thymus weight, plasma CORT concentrations, number of isolated mesenteric lymph node cells, in vitro cytokine secretion from isolated mesenteric lymph node cells and histological damage score of the colon mice were euthanized by decapitation in the morning of day 27/28. Afterwards, SH mice of Animal set 4 were compared for all readouts with SH mice from Animal set 3 (Ulm University, 12-h/12-h LDC, AW).
Assessment of body, thymus and adrenal weight
All animals were weighed before decapitation. After decapitation, adrenal glands were removed, pruned of fat, weighed and stored in ice-cold Dulbecco’s modified Eagle’s medium (DMEM/F-12, Life Technologies, Inc, Grand Island, NY; supplemented with 0.1% bovine serum albumin (BSA; Biomol, Hamburg, Germany)), until used for in vitro ACTH stimulation. Thymus was removed and stored in ice-cold phosphate-buffered saline (PBS; Life Technologies, Inc, Grand Island, NY) until all animals were killed. Subsequently, thymus glands were pruned of fat and weighed separately.
Trunk blood sampling
Within 3 min after removing the cage from the animal room, mice were rapidly euthanized by decapitation following brief CO2 exposure. Trunk blood was collected in ethylenediaminetetraacetic acid (EDTA)-coated tubes (Sarstedt, Nuembrecht, Germany) and stored on ice until centrifugation. Tubes were centrifuged at 4 °C (5000 g, 10 min). Plasma samples were stored at −20 °C until further analysis.
Enzyme-linked immunosorbent assay (ELISA) for plasma CORT and ACTH
Plasma samples were analyzed using a commercially available ELISA for CORT (analytical sensitivity: <0.564 ng/ml, intra-assay and inter-assay coefficients of variation ≤6.35%; IBL International, Hamburg, Germany) and ACTH (analytical sensitivity: <0.22 pg/ml, intra-assay and inter-assay coefficients of variation ≤7.1%; IBL International, Hamburg, Germany).
In vitro ACTH stimulation of adrenal explants
Adrenal in vitro ACTH stimulation was performed as described previously (Uschold-Schmidt et al., Citation2012). Briefly, after pruning adrenals of fat and weighing, adrenals were stored in ice-cold DMEM (DMEM/F-12, Life Technologies, Inc., Grand Island, NY) supplemented with 0.1% BSA, until further treatment. Adrenal glands were then cut into two halves (with each containing a cortical and medullary part), weighed again and preincubated in 200 μl DMEM/F-12 for 4 h (37 °C, 95% O2, 5% CO2). Afterwards, culture medium was replaced and each half of one adrenal gland was incubated with either medium containing saline (basal) or medium containing ACTH (100 nM) for 6 h (37 °C, 95% O2, 5% CO2). After 6 h of stimulation, supernatants were carefully removed and stored at −20 °C until further analysis. Samples were analyzed using a commercially available ELISA for CORT (analytical sensitivity: <0.564 ng/ml, intra-assay and inter-assay coefficients of variation ≤6.35%; IBL International, Hamburg, Germany). CORT concentrations were calculated in relation to the respective weight of each adrenal explant.
Isolation and incubation of mesenteric lymph node cells and measurement of interferon-γ (IFN-γ) secretion
To assess effects of AW on IFN-γ secretion from anti-CD3/CD28-stimulated mesenteric lymph node cells, mesenteric lymph nodes were removed and stored in ice-cold Roswell Park Memorial Institute Medium (RPMI-1640; Sigma-Aldrich Corp., St. Louis, MO) until all animals were killed. Mesenteric lymph node cells were isolated and stimulated as previously described (Reber et al., Citation2007). Briefly, lymph node cells from each animal were isolated individually, and counted manually. After isolation, 2 × 10⁵ cells per well were incubated over 24 h (37 °C, 95% O2, 5% CO2) in anti-CD3-antibody-coated wells (Thermo Fisher Scientific, Waltham, MA; concentration: 2.5 μg/ml) in the presence of costimulatory anti-CD28-antibody (eBioscience, San Diego, CA; concentration: 1 μg/ml). Subsequently, supernatants were removed and stored at −20 °C until further analysis. IFN-γ levels were measured by a commercially available ELISA (Mouse IFN-γ ELISA MAX Deluce Set, Biolegend, San Diego, CA).
Determination of the histological damage score of the colon
To determine effects of AW on the histological damage in colonic tissue, colon was removed after decapitation and cleaned. Histological damage score was assessed as described before (Reber et al., Citation2007). Briefly, 1 cm of the distal part of the colon was cut longitudinally and fixed in 4% formalin over 48 h. Fixed tissue was then embedded in paraffin and cut longitudinally. Three 3 μm hematoxylin–eosin stained sections, taken at 100 μm distance, were evaluated by histological scoring performed by an investigator blind to treatment. The histological score of each mouse represents the mean of the three sections. Histological damage score ranges from 0 to 8 and represents the sum of the epithelium score (0: normal morphology; 1: loss of goblet cells; 2: loss of goblet cells in large areas; 3: loss of crypts; 4: loss of crypts in large areas) and infiltration score (0: no infiltration; 1: infiltrate around crypt bases; 2: infiltrate reaching to lamina muscularis mucosae; 3: extensive infiltration reaching the lamina muscularis mucosae and thickening of the mucosa with abundant edema; 4: infiltration of the lamina submucosa).
Statistics
For statistical comparisons, the software package IBM SPSS statistics version 22.0 (Armonk, NY) was used. Kolmogorov–Smirnov test using Lilliefors′ correction was employed to test normal distribution of all acquired data sets. Outliers in normally distributed data sets were identified using Grubb’s test and excluded from further analysis. Normally distributed data sets were subsequently analyzed using parametric statistics, that is, parametric Student’s t-test (one factor, two independent samples; readout: plasma CORT in Animal set 1 vs. Animal set 2.1; absolute adrenal weight, in vitro IFN-γ secretion, body weight and number of viable mesenteric lymph node cells in Animal set 3 vs. Animal set 4), one-way analysis of variance (ANOVA; one factor, more than two independent samples; readouts: body weight, relative adrenal weight in Animal sets 2.1. and 2.2.), two-way ANOVA (two factors, two or more independent samples; readout: adrenal in vitro ACTH responsiveness of adrenal explants in Animal sets 2.1. and 2.2). Non-normally distributed data sets were analyzed using nonparametric statistics, that is, Mann–Whitney U-test (one factor, two independent samples; readouts: plasma CORT in Animal set 1 vs. Animal set 3, absolute thymus weight, plasma CORT, histological damage score in Animal set 3 vs. Animal set 4), Kruskal–Wallis ANOVA (one factor, more than two independent samples; readouts: Plasma CORT and ACTH concentrations, plasma CORT/ACTH ratio, absolute adrenal weight in Animal sets 2.1. and 2.2). All tests comparing more than two samples were followed, when a significant main effect was found, by post hoc analysis using Bonferroni pairwise comparison. Normally distributed data are presented as bars (mean + SEM). Non-normally distributed data are presented as box plots. Solid line represents the median, dashed line represents the mean for each data set. Lower box indicates 25th, upper box indicates 75th percentile. If n > 8 per group, 10th (lower error bar), and 90th percentile (upper error bar) as well as possible outliers beyond the percentiles (indicated by closed circles) are shown. The level of significance was set at p < .05.
Results
Exposing mice to a LDC different to their entrained one long lastingly alters plasma CORT levels
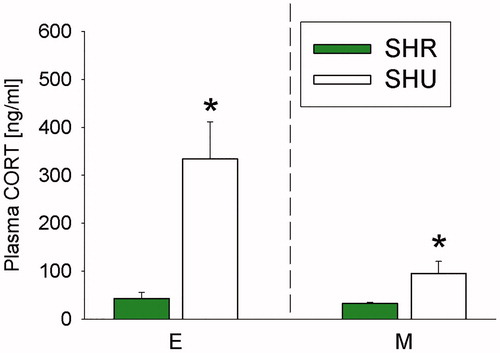
Student’s t-test revealed that basal morning plasma CORT concentrations in SHU mice (raised under a 12-h/12-h LDC at the animal supplier (Charles River, Sulzfeld, Germany) and housed under a 14-h/10-h LDC after delivery), were more than double as high as in respective SHR mice (raised under a 12-h/12-h light LDC at Charles River and housed under a 12-h/12-h LDC after delivery) when sacrificed during middle phase after arrival (p= .042; , right panel). This difference was even more pronounced when sacrificing the animals during early phase after arrival (p= .010; , left panel).
Figure 1. Effects of exposing mice, initially bred in a 12-h/12-h light/dark cycle (LDC), to either a 12 h/12 h (Regensburg) or 14 h/10 h (Ulm) LDC on plasma corticosterone (CORT) concentrations. Compared to single-housed (SH) mice housed in a 12-h/12-h LDC after arrival at Regensburg University (SHR = green bars), SH mice housed in a 14-h/10-h LDC after arrival at Ulm University (SHU = white bars) showed increased plasma CORT levels during the early (day 15/16; E) and middle (day 27/28; M) phases after arrival. Of note, SHU and SHR mice were all delivered from Charles River (Sulzfeld, Germany), where they were raised in a 12-h/12-h LDC. SHR (n = 4–8); SHU (n = 7–8). Data represent mean + SEM. *p < .05 versus respective SHR group.
Exposing mice to a LDC different to their entrained one substantially increases plasma ACTH, adrenal in vitro basal activity and ACTH responsiveness
Basal morning plasma CORT concentrations in SHU mice (raised under a 12-h/12-h LDC at Charles River and housed under a 14-h/10-h LDC after delivery) were dependent on factor time (H(2) = 13.832; p= .001 Kruskal–Wallis H-test; ). Post hoc analysis revealed that plasma CORT concentrations were significantly lower during the middle (p = 0.049) and late phase (p= .001), compared to early phase after arrival.
Figure 2. Effects of exposing mice, initially bred in a 12-h/12-h light/dark cycle (LDC), to a 14-h/10-h LDC at Ulm University on physiological parameters over time. Compared to the early phase after arrival (day 15/16; E), animals housed in a 14-h/10-h LDC after arrival at Ulm University showed (A) significantly decreased plasma corticosterone (CORT) levels during middle (day 27/28; M) and late (day 57/58; L) phase after arrival; (B) decreased plasma adrenocorticotropic hormone (ACTH) levels during middle (day 27/28; M) and late (day 57/58; L) phase after arrival; (C) decreased plasma CORT/ACTH ratio during late (day 57/58; L) phase after arrival; (D) a decreased basal (by trend; day 57/58; L) and ACTH (100 nM)-induced (day 27/28, M; day 57/58, L) in vitro adrenal CORT response. E (n = 7); M (n = 8), L (n = 8). Parametric data represent mean + SEM. Nonparametric data are presented as box-plot diagrams. Solid line represents the median, dashed line represents the mean for each data set. Lower box indicates 25th, upper box indicates 75th percentile. (*) p = .078 versus respective E group; *p< .05 versus respective E group; **p < .01 versus respective E group; ***p < .001 versus respective E group; #p < .05 versus respective basal group; ###p < .001 versus respective basal group.
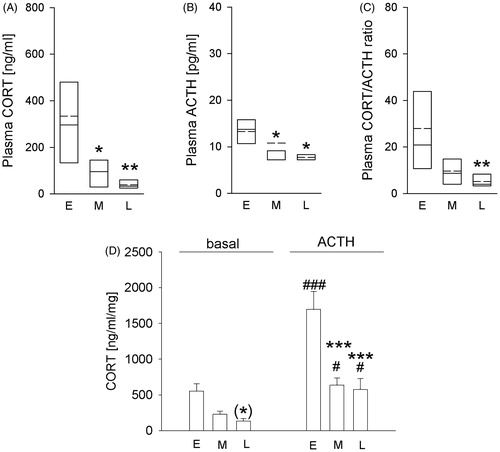
Basal morning plasma ACTH concentrations in SHU mice were dependent on factor time (H(2) = 8.815; p= .012 Kruskal–Wallis H-test; ), with post hoc analysis revealing lower plasma ACTH concentrations during middle (p = .046) and late (p = .018) compared to the early phase after arrival.
In line, plasma CORT/ACTH ratio in SHU mice during late phase (p = .003) after arrival was lower than during early phase (factor time: H(2) = 10.605; p = .005 Kruskal–Wallis H-test; ).
Two-way ANOVA (factor: time and treatment) revealed that in vitro adrenal CORT secretion was dependent on factor time (F2,39= 21.002; p < .001), treatment (F1,39= 40.074; p< .001), as well as on the interaction between both factors (F2,39 =5.052; p = .011; ). Post hoc analysis revealed that adrenal in vitro CORT secretion was increased after ACTH stimulation, compared to respective basal values during all phases (early phase: p< .001; middle phase: p = .025; late phase: p = .02) tested. In addition, basal CORT secretion during late phase was by trend decreased compared to early phase (p = .078) after arrival at Ulm and ACTH-stimulated CORT secretion was significantly decreased during the middle (p < .001) and late (p< .001) compared to early phase.
Exposing mice to a LDC different to their entrained one substantially increases relative and absolute adrenal weight
Body weight was dependent on factor time (F2,20 =80.660; p < .001; one-way ANOVA; ), with body weight during middle (p < .001) and late (p < .001) phase after arrival being higher than during early phase. Body weight during late phase was further elevated compared to middle phase (p< .001).
Figure 3. Effects of exposing mice, initially bred in a 12-h/12-h light/dark cycle (LDC), to a 14-h/10-h LDC at Ulm University on body and, relative and absolute adrenal weight over time. Compared to the early phase after arrival (day 15/16; E), animals housed in a 14-h/10-h LDC after arrival at Ulm University showed (A) increased body weight at the middle (day 27/28; M) and late (day 57/58; L) phase. Furthermore, at the late phase (L) animals showed increased body weight, compared to the middle (M) phase. (B) decreased relative adrenal weight at the middle (day 27/28; M) and late (day 57/58; L) phase. Furthermore, at the late-phase (L) animals showed decreased relative adrenal weight, compared to the middle (M) phase. (C) decreased absolute adrenal weight at the late (day 57/58; L) phase, compared to the early (day 15/16; E) phase and middle (day 27/28; M) phase after their arrival at Ulm. E (n = 7); M (n = 8), L (n = 8). Parametric data represent mean + SEM. Nonparametric data are presented as box-plot diagrams. Solid line represents the median, dashed line represents the mean for each data set. Lower box indicates 25th, upper box indicates 75th percentile. **p < .01 versus respective E group; ***p < .001 versus respective E group; ++p < .01 versus respective M group; +++p < .001 versus respective M group.
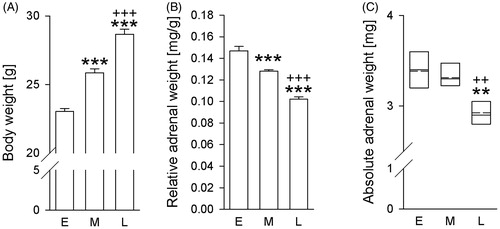
Relative adrenal weight was dependent on the factor time (F2,20=73.232; p < .001; one-way ANOVA; ), with relative adrenal weight during middle (p < .001) and late (p < .001) phase being lower than during early phase after arrival at Ulm University. Relative adrenal weight during late phase was further lower than during middle phase (p< .001).
Absolute adrenal weight was dependent on the factor time (H(2) = 12.625; p = .002 Kruskal–Wallis H-test; ), with post hoc analysis revealing lower absolute adrenal weight during the late compared to the early (p = .005) and the middle (p = .009) phase after arrival.
Employing a 12-h/12-h LDC at Ulm University normalized plasma CORT levels
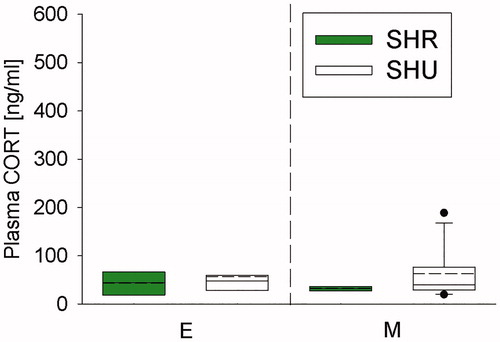
SHU mice showed comparable plasma CORT concentrations to respective SHR mice during early (E; , left panel) and middle (M; , right panel) phase after arrival at respective facilities.
Figure 4. Effects of exposing mice, initially bred in a 12-h/12-h light/dark cycle (LDC), to either a 12-h/12-h (Regensburg) or 12-h/12-h (Ulm) LDC on plasma corticosterone (CORT) concentrations. Compared to single-housed (SH) mice housed in a 12-h/12-h LDC at Regensburg University (SHR; green bars), SH mice housed in a 12-h/12-h LDC at Ulm University (SHU; white bars) did not differ in plasma CORT concentration during the early (day 15/16; E) and middle (day 27/28; M) phase after delivery from Charles River (Sulzfeld, Germany; 12 h/12 h LDC). SHR (n = 4-8); SHU (n = 7–16). Nonparametric data are presented as box-plot diagrams. Solid line represents the median, dashed line represents the mean for each data set. Lower box indicates 25th, upper box indicates 75th percentile. If n > 8 per group, 10th (lower error bar), and 90th percentile (upper error bar) as well as possible outliers beyond the percentiles (indicated by closed circles) are shown.
Acidified drinking water affects physiology and immunology of SHU mice
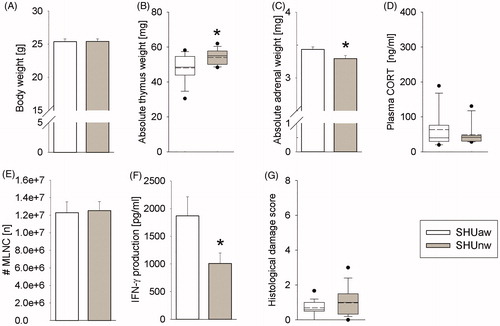
Despite a comparable body weight at the time point of killing () and plasma CORT concentrations (), absolute thymus weight was significantly increased (p = .017; ) and absolute adrenal weight was significantly decreased (p = .032; ) in SHUnw compared to SHUaw mice. Moreover, although exposure to AW did not affect the number of isolated mesenteric lymph node cells () and the histological damage score (), SHUnw mice showed a significantly decreased in vitro IFN-γ secretion from isolated and anti-CD3/CD28-stimulated mesenteric lymph node cells (p = .041; ) when compared to respective SHUaw mice.
Figure 5. Effects of the drinking water quality on physiological and immunological parameters in single-housed mice at Ulm University (SHU). Compared to single-housed (SH) mice receiving acidified (pH∼2.4) water (SHUaw; white bars) for 27/28 days, SH mice receiving normal tap water (SHUnw; gray bars) for 27/28 days showed (A) comparable body weight at the time point of killing (day 27/28), (B) increased absolute thymus weight, (C) decreased absolute adrenal weight, (D) unaffected plasma corticosterone (CORT), (E) unaffected numbers (#) of viable mesenteric lymph node cells (MLNC), (F) decreased interferon-γ (IFN-γ) secretion from isolated and anti-CD3/CD28-stimulated MLNC in vitro and (G) an unaffected histological damage score of the colon. SHUaw (n = 16); SHUnw (n = 15). Parametric data represent mean + SEM. Nonparametric data are presented as box-plot diagrams. Solid line represents the median, dashed line represents the mean for each data set. Lower box indicates 25th, upper box indicates 75th percentile. If n > 8 per group, 10th (lower error bar), and 90th percentile (upper error bar) as well as possible outliers beyond the percentiles (indicated by closed circles) are shown. *p < .05 versus SHUaw group.
Discussion
In the present study, we reveal that transferring male laboratory mice, bred and raised in a 12-h/12-h LDC and watered with NW, into an animal facility employing 14-h/10-h LDC and AW, poses a severe and long-lasting stressor for these animals, resulting in pronounced hypothalamus–pituitary–adrenal (HPA) axis activation for up to 8 weeks.
Ever since Hans Selye, who coined the term “stress” in the 1930s (Selye, Citation1936), exposure to stressors (in his words “nonspecific nocuous agents”) has been associated with a reliable activation of the HPA axis resulting in the release of glucocorticoids (GC) from the adrenal cortex. For this reason, elevated GC levels for decades have been considered to be the main mediators of adverse affective and somatic consequences of chronic stress (as in detailed reviewed in Heim et al., Citation2000; and Holsboer, Citation2001). In support, chronic CORT application to rodents via the drinking water has been shown to potently promote the development of affective (e.g. depression, impaired cognitive capacity) and somatic (e.g. metabolic) disorders (Donner et al., Citation2011; Karatsoreos et al., Citation2010; Osmanovic et al., Citation2010). Given this knowledge, we were extremely concerned about the fact that plasma CORT concentrations in SHU male mice on day 27/28 after delivery from the animal supplier (Charles River, Sulzfeld, Germany) were more than twice as high as in respective SHR mice. This effect was even more pronounced on day 15/16, but undetectable on day 57/58 after arrival, suggesting the presence of a profound environmental stressor present in our Ulm animal rooms, which required a long time to adapt to. Of note, our group used SH mice as nonstressed controls for mice exposed to the CSC paradigm, an established murine model for chronic psychosocial stress (Peters et al., Citation2012; Reber et al., Citation2007; Langgartner et al., Citation2015), for more than 10 years of stress research at Regensburg University before our laboratory moved to Ulm University. In addition to plasma CORT concentrations, increased absolute and relative adrenal weight, as well as plasma ACTH concentrations were only shown to normalize in SHU mice 57/58 days after arrival, supporting the idea of HPA axis habituation to an unknown environmental stressor. Moreover, an increased plasma CORT/ACTH ratio, as well as an increased basal and ACTH-induced adrenal in vitro CORT secretion, indicating an increased basal adrenal activity and a sensitized adrenal gland to ACTH, normalized over time in SHU mice. Notably, increased adrenal weight (Füchsl et al., Citation2013; Reber et al., Citation2007), elevated plasma ACTH levels (Füchsl et al., Citation2013), an increased CORT secretion under both basal (De Goeij et al., Citation1992) and acute stress (Uschold-Schmidt et al., Citation2012) conditions, despite unchanged ACTH levels, represent well-known consequences of chronic stress. As both, SHR and SHU mice, were derived from Charles River (Sulzfeld, Germany) and, thus, were bred, grown, weaned and delivered under identical conditions, pre- and postnatal factors can be ruled out as possible mediators of these striking differences in plasma CORT concentrations. However, light is a highly important zeitgeber for various circadian rhythms (Ikeda et al., Citation2000) and changes in the LDC severely affect physiological, as well as affective, parameters in rodents (Avgustinovich et al., Citation1997; Suer et al., Citation1998). Moreover, GC are key components of signaling pathways regulating systemic circadian rhythmicity (Dickmeis et al., Citation2007). Given that SHR mice were kept in a 12-h/12-h LDC, while in Ulm a 14-h/10-h LDC was applied, we hypothesized that the installation of a 12-h/12-h LDC in Ulm should prevent physiological differences between SHU and SHR mice. Consistent with this hypothesis, a 12-h/12-h LDC completely abolished the differences detected in plasma morning CORT between SHR and SHU mice 15/16 and 27/28 days after arrival. As mice at Charles River are housed in a 12-h/12-h LDC, these findings suggest that shifting mice into an unfamiliar LDC, whose dark (active) phase is 2 h shorter and whose light (passive) phase is 2 h longer than their entrained internal rhythm, poses a long-lasting stressor for these mice. This was not the case in Regensburg, where mice were immediately housed in their entrained 12-h/12-h LDC. Although it is well known that shifting the LDC back or forward, but keeping the overall phase lengths constant, poses a pronounced stressor for rodents (Avgustinovich et al., Citation1997; Suer et al., Citation1998), our findings suggest that the re-entraining of an individual to light/dark phases of different lengths is more stressful. Whereas each 1-h shift in LDC (keeping phase lengths constant) requires about one day to resynchronize all internal rhythms (Sudo & Miki, Citation1995), SHU mice showed increased plasma morning CORT concentrations for at least one month after being introduced into this unfamiliar 14-h/10-h LDC.
Although plasma CORT concentrations normalized after adjusting the LDC accordingly, we also investigated whether the quality of drinking water, another environmental factor that was different between Regensburg and Ulm, influenced the physiology and the immune system of SHU mice. As described above, mice in Regensburg as well as at Charles River received NW, mice kept in Ulm received AW (pH =2.4). Interestingly, although body weight and basal plasma CORT concentrations were comparable between SHUaw and SHUnw, the former showed lower absolute thymus weight and increased absolute adrenal weight; both representing well-known physiological consequences of chronic stress exposure (Bartlang et al., Citation2012; Reber et al., Citation2007; Langgartner et al., Citation2015). Given that previous studies revealed no effect of 21 weeks of AW on adrenal weight (Clausing & Gottschalk, Citation1989), our results suggest that experimental animals might adapt to this treatment over time. Moreover, in vitro IFN-γ secretion from isolated and anti-CD3/anti-CD28-stimulated mesenteric lymph node cells was higher in SHUaw compared to respective SHUnw mice – again representing a well-known pro-inflammatory stress effect (Reber et al., Citation2007, Citation2011). This is in line with recent studies, proposing that the pH of the drinking water directly affects T-helper cell 1 responses (Sofi et al., Citation2014). In contrast, the number of isolated mesenteric lymph node cells and the histological damage score in the colon were unaffected by the quality of the drinking water.
In summary, our data indicate that prolonging the light phase, from the phase duration experimental mice have been entrained to during breeding and upbringing, poses a chronic stressor, requiring at least 7–8 weeks to nullify. Moreover, we show that experimental animals should have access to normal tap water instead of acidified water, as this clearly reduces signs of chronic stress. Considering the well-known effects of chronic stress on central mechanisms like learning and memory (Sandi & Pinelo-Nava, Citation2007; Schwabe & Wolf, Citation2010; Shea et al., Citation2015), but also on metabolic (Tamashiro et al., Citation2011; Seematter et al., Citation2005) and immune factors (Langgartner et al., Citation2015; Pace et al., Citation2006; Danese et al., Citation2007), our results strongly emphasize the importance of adequate animal husbandry for experimental reproducibility; not only in stress, but also in other research domains. Our data reveal approaches that help to minimize stress load and suffering of individual experimental animals, which will consequently increase the reliability/reproducibility of experimental data and, thus reduce the overall number of animals required for experiments. Thus, these findings should be of general interest for any scientist working with laboratory animals.
Acknowledgements
The authors gratefully thank P. Hornischer and S. Faller (both from the Laboratory for Molecular Psychosomatics, Clinic for Psychosomatic Medicine and Psychotherapy, University Ulm, 89081 Ulm, Germany) for their technical assistance and help in performing the experiments. Furthermore, the authors are grateful to Prof. Dr. D.A. Slattery for his helpful comments regarding the manuscript. In addition, the authors would also like to thank Dr. Sybille Ott, Ekaterina Merkel and Susanna Hummel (all from the TFZ (Tierforschungszentrum), University Ulm, 89081 Ulm, Germany) for their help and expertise at the animal caretaking facility.
Disclosure statement
The authors report no conflicts of interest. The authors alone are responsible for the content and writing of this article.
References
- Avgustinovich DF, Gorbach OV, Kudryavtseva NN. (1997). Comparative analysis of anxiety-like behavior in partition and plus-maze tests after agonistic interactions in mice. Physiol Behav 61:37–43.
- Avgustinovich DF, Kovalenko IL, Kudryavtseva NN. (2005). A model of anxious depression: persistence of behavioral pathology. Neurosci Behav Physiol 35:917–24.
- Bach DR, Daunizeau J, Kuelzow N, Friston KJ, Dolan RJ. (2010). Dynamic causal modeling of spontaneous fluctuations in skin conductance. Psychophysiology 48(2):252–7.
- Bartlang MS, Neumann ID, Slattery DA, Uschold-Schmidt N, Kraus D, Helfrich-Forster C, Reber SO. (2012). Time matters: pathological effects of repeated psychosocial stress during the active, but not inactive, phase of male mice. J Endocrinol 231(3):209–21.
- Berton O, McClung CA, DiLeone RJ, Krishnan V, Renthal W, Russo SJ, Graham D, et al. (2006). Essential role of BDNF in the mesolimbic dopamine pathway in social defeat stress. Science 311:864–8.
- Chesler EJ, Wilson SG, Lariviere WR, Rodriguez-Zas SL, Mogil JS. (2002). Identification and ranking of genetic and laboratory environment factors influencing a behavioral trait, thermal nociception, via computational analysis of a large data archive. Neurosci Biobehav Rev 26:907–23.
- Clausing P, Gottschalk M. (1989). Effects of drinking water acidification, restriction of water supply and individual caging on parameters of toxicological studies in rats. Z Versuchstierkd 32:129–34.
- Crabbe JC, Wahlsten D, Dudek BC. (1999). Genetics of mouse behavior: interactions with laboratory environment. Science 284:1670–2.
- Cryan JF, Dinan TG. (2012). Mind-altering microorganisms: the impact of the gut microbiota on brain and behaviour. Nat Rev Neurosci 13:701–12.
- Danese A, Pariante CM, Caspi A, Taylor A, Poulton R. (2007). Childhood maltreatment predicts adult inflammation in a life-course study. Proc Natl Acad Sci USA 104:1319–24.
- Darrow JM, Goldman BD. (1985). Circadian regulation of pineal melatonin and reproduction in the Djungarian hamster. J Biol Rhythms 1:39–54.
- De Goeij DC, Dijkstra H, Tilders FJ. (1992). Chronic psychosocial stress enhances vasopressin, but not corticotropin-releasing factor, in the external zone of the median eminence of male rats: relationship to subordinate status. Endocrinology 131:847–53.
- Dickmeis T, Lahiri K, Nica G, Vallone D, Santoriello C, Neumann CJ, Hammerschmidt M, Foulkes NS. (2007). Glucocorticoids play a key role in circadian cell cycle rhythms. PLoS Biol 5:e78.
- Donner NC, Montoya CD, Lukkes JL, Lowry CA. (2011). Chronic non-invasive corticosterone administration abolishes the diurnal pattern of TPH2 expression. Psychoneuroendocrinology 37:645–61.
- Freedman LP, Cockburn IM, Simcoe TS. (2015). The economics of reproducibility in preclinical research. PLoS Biol 13:e1002165.
- Füchsl AM, Langgartner D, Reber SO. (2013). Mechanisms underlying the increased plasma ACTH levels in chronic psychosocially stressed male mice. PLoS One 8:e84161.
- Heim C, Ehlert U, Hellhammer DH. (2000). The potential role of hypocortisolism in the pathophysiology of stress-related bodily disorders. Psychoneuroendocrinology 25:1–35.
- Holsboer F. (2001). Stress, hypercortisolism and corticosteroid receptors in depression: implications for therapy. J Affect Disord 62:77–91.
- Ikeda M, Sagara M, Inoue S. (2000). Continuous exposure to dim illumination uncouples temporal patterns of sleep, body temperature, locomotion and drinking behavior in the rat. Neurosci Lett 279:185–9.
- Karatsoreos IN, Bhagat SM, Bowles NP, Weil ZM, Pfaff DW, McEwen BS. (2010). Endocrine and physiological changes in response to chronic corticosterone: a potential model of the metabolic syndrome in mouse. Endocrinology 151:2117–27.
- Langgartner D, Füchsl AM, Uschold-Schmidt N, Slattery DA, Reber SO. (2015). Chronic subordinate colony housing paradigm: a mouse model to characterize the consequences of insufficient glucocorticoid signaling. Front Psychiatry 6:18.
- Martinez M, Calvo-Torrent A, Pico-Alfonso MA. (1998). Social defeat and subordination as models of social stress in laboratory rodents: a review. Aggress Behav 24:241–56.
- Osmanovic J, Plaschke K, Salkovic-Petrisic M, Grunblatt E, Riederer P, Hoyer S. (2010). Chronic exogenous corticosterone administration generates an insulin-resistant brain state in rats. Stress 13:123–31.
- Pace TW, Mletzko TC, Alagbe O, Musselman DL, Nemeroff CB, Miller AH, Heim CM. (2006). Increased stress-induced inflammatory responses in male patients with major depression and increased early life stress. Am J Psychiatry 163:1630–3.
- Palumbo ML, Zorrilla Zubilete MA, Cremaschi GA, Genaro AM. (2009). Different effect of chronic stress on learning and memory in BALB/c and C57BL/6 inbred mice: involvement of hippocampal NO production and PKC activity. Stress 12:350–61.
- Peters S, Grunwald N, Rummele P, Endlicher E, Lechner A, Neumann ID, Obermeier F, Reber SO. (2012). Chronic psychosocial stress increases the risk for inflammation-related colon carcinogenesis in male mice. Stress 15:403–15.
- Prendergast BJ, Gorman MR, Zucker I. (2000). Establishment and persistence of photoperiodic memory in hamsters. Proc Natl Acad Sci USA 97:5586–91.
- Razzoli M, Carboni L, Andreoli M, Michielin F, Ballottari A, Arban R. (2011). Strain-specific outcomes of repeated social defeat and chronic fluoxetine treatment in the mouse. Pharmacol Biochem Behav 97:566–76.
- Reber SO, Birkeneder L, Veenema AH, Obermeier F, Falk W, Straub RH, Neumann ID. (2007). Adrenal insufficiency and colonic inflammation after a novel chronic psycho-social stress paradigm in mice: implications and mechanisms. Endocrinology 148:670–82.
- Reber SO, Peters S, Slattery DA, Hofmann C, Schölmerich J, Neumann ID, Obermeier F. (2011). Mucosal immunosuppression and epithelial barrier defects are key events in murine psychosocial stress-induced colitis. Brain Behav Immunity 25:1153–61.
- Sandi C, Pinelo-Nava MT. (2007). Stress and memory: behavioral effects and neurobiological mechanisms. Neural Plast 2007:78970.
- Savignac HM, Finger BC, Pizzo RC, O'Leary OF, Dinan TG, Cryan JF. (2011). Increased sensitivity to the effects of chronic social defeat stress in an innately anxious mouse strain. Neuroscience 192:524–36.
- Schwabe L, Wolf OT. (2010). Learning under stress impairs memory formation. Neurobiol Learn Mem 93:183–8.
- Seematter G, Binnert C, Tappy L. (2005). Stress and metabolism. Metab Syndr Relat Disord 3:8–13.
- Selye HA. (1936). Syndrome produced by diverse nocuous agents. Nature 138:32.
- Shea CJ, Carhuatanta KA, Wagner J, Bechmann N, Moore R, Herman JP, Jankord R. (2015). Variable impact of chronic stress on spatial learning and memory in BXD mice. Physiol Behav 150:69–77.
- Sofi MH, Gudi R, Karumuthil-Melethil S, Perez N, Johnson BM, Vasu C. (2014). pH of drinking water influences the composition of gut microbiome and type 1 diabetes incidence. Diabetes 63:632–44.
- Sorge RE, Martin LJ, Isbester KA, Sotocinal SG, Rosen S, Tuttle AH, Wieskopf JS, et al. (2014). Olfactory exposure to males, including men, causes stress and related analgesia in rodents. Nat Methods 11:629–32.
- Sudo A, Miki K. (1995). Circadian rhythm of catecholamine excretion in rats after phase shift of light-dark cycle. Ind Health 33:57–66.
- Suer C, Dolu N, Ozesmi C, Yilmaz A, Sahin O. (1998). Effect of reversed light-dark cycle on skin conductance in male rats. Percept Mot Skills 87:1267–74.
- Tamashiro KL, Sakai RR, Shively CA, Karatsoreos IN, Reagan LP. (2011). Chronic stress, metabolism, and metabolic syndrome. Stress 14:468–74.
- Uschold-Schmidt N, Nyuyki KD, Füchsl AM, Neumann ID, Reber SO. (2012). Chronic psychosocial stress results in sensitization of the HPA axis to acute heterotypic stressors despite a reduction of adrenal in vitro ACTH responsiveness. Psychoneuroendocrinology 37:1676–87.
- Van der Meer E, Van Loo PL, Baumans V. (2004). Short-term effects of a disturbed light-dark cycle and environmental enrichment on aggression and stress-related parameters in male mice. Lab Anim 38:376–83.
- Walker DL, Toufexis DJ, Davis M. (2003). Role of the bed nucleus of the stria terminalis versus the amygdala in fear, stress, and anxiety. Eur J Pharmacol 463:199–216.
- Willner P. (1997). Validity, reliability and utility of the chronic mild stress model of depression: a 10-year review and evaluation. Psychopharmacology (Berl) 134:319–29.
- Wu L, Kohler JE, Zaborina O, Akash G, Musch MW, Chang EB, Alverdy JC. (2006). Chronic acid water feeding protects mice against lethal gut-derived sepsis due to Pseudomonas aeruginosa. Curr Issues Intest Microbiol 7:19–28.