
Abstract
Brain acetylcholinesterase (AChE) variant AChER expression increases with acute stress, and this persists for an extended period, although the timing, strain and laterality differences, have not been explored previously. Acute stress transiently increases acetylcholine release, which in turn may increase activity of cholinesterases. Also the AChE gene contains a glucocorticoid response element (GRE), and stress-inducible AChE transcription and activity changes are linked to increased glucocorticoid levels. Corticotropin-releasing hormone knockout (CRH-KO) mice have basal glucocorticoid levels similar to wild type (WT) mice, but much lower levels during stress. Hence we hypothesized that CRH is important for the cholinesterase stress responses, including butyrylcholinesterase (BChE). We used immobilization stress, acute (30 or 120 min) and repeated (120 min daily × 7) in 48 male mice (24 WT and 24 CRH-KO) and determined AChER, AChE and BChE mRNA expression and AChE and BChE activities in left and right brain areas (as cholinergic signaling shows laterality). Immobilization decreased BChE mRNA expression (right amygdala, to 0.5, 0.3 and 0.4, × control respectively) and AChER mRNA expression (to 0.5, 0.4 and 0.4, × control respectively). AChE mRNA expression increased (1.3, 1.4 and 1.8-fold, respectively) in the left striatum (Str). The AChE activity increased in left Str (after 30 min, 1.2-fold), decreased in right parietal cortex with repeated stress (to 0.5 × control). BChE activity decreased after 30 min in the right CA3 region (to 0.4 × control) but increased (3.8-fold) after 120 min in the left CA3 region. The pattern of changes in CRH-KO differed from that in WT mice.
Introduction
Cholinesterases comprise acetylcholinesterase (AChE) and butyrylcholinesterase (BChE) (Karczmar, Citation2010). While AChE is considered as the main enzyme in cholinergic transmission, BChE is involved in detoxication of some drugs (eserine, cocaine), acetylcholine hydrolysis and fat metabolism, and can act as scavenger of polyproline-rich peptides (Lockridge, Citation2015). AChE exists as different splice variants (AChER, AChEH, AChET, i.e. read-through, both hydrophobic and tailed (Massoulie, Citation2002; Zimmermann, Citation2013). The read-through (AChER) splice variant of AChE is usually a rare variant, but has been shown to be inducible by stress (Kaufer et al., Citation1998). AChER is a soluble and monomeric (Massoulie, Citation2002) form of AChE that is formed by continuous transcription through intron I4. AChER modulates amyloid-beta pathology (Berson et al., Citation2008), and is increased in hematopoietic progenitors after stress (Deutsch et al., Citation2002), in liver cirrhosis (García-Ayllón et al., Citation2012), in cellular models of oxidative stress (Härtl et al., Citation2011), and in pathophysiological amyloid concentrations (Li et al., Citation2013).
Acute stress elicits a transient increase in the release of the neurotransmitter acetylcholine associated with a phase of enhanced neuronal excitability (Imperato et al., Citation1991). Inhibitors of AChE also promote enhanced electrical brain activity, presumably by increasing the halftime of acetylcholine at the synapse (Ennis & Shipley, Citation1992).
Kaufer et al. (Citation1998) performed experiments both in vitro (brain slices exposed to cholinesterase inhibitors) and in vivo (forced swimming test) with assays 10–90 min thereafter. After forced swimming for 10 min, the level of AChE mRNA was increased, while mRNAs for vesicular acetylcholine transporter (VAChT) and choline acetyltransferase (ChAT) were decreased. AChE activity in the neocortex and hippocampus (but not in the cerebellum) of mice exposed to a single stress session increased by two- to threefold within 50 min after stress and cortical activity remained significantly higher than that in control mice for over 80 h, and non-denaturing polyacrylamide gel electrophoresis revealed new, quickly migrating AChE form(s) in the brains of stressed mice. Taking these results into account, it is notable that the presence of cFos-binding sites was revealed in the promoters of key cholinergic genes, such as the genes encoding AChE (Ben Aziz-Aloya et al., Citation1993; Li et al., Citation1993), the acetylcholine synthesizing enzyme ChAT (Bausero et al., Citation1993) and VAChT (Cervini et al., Citation1995). The human AChE gene includes a glucocorticoid response element (GRE) about 17 kb upstream from the transcription initiation site (Meshorer et al., Citation2002). Moreover, corticosterone, anticholinesterases, and forced swimming (4 min/session, twice a day) each facilitated a rapid (minutes), yet long-lasting (weeks), shift from AChES to the normally rare AChER mRNA; it should be noted that these authors used the term AChES (synaptic) instead of AChET (tailed), which is widely used. In addition, corticosterone, anticholinesterases, and forced swimming promoted AChER mRNA translocation into neurites, and induced enzyme secretion. Four weeks after stress sessions (4 d of repeated stress), electrophysiological measurements in hippocampal slices displayed apparently normal evoked synaptic responses but extreme hypersensitivity to both anticholinesterases and atropine (Meshorer et al., Citation2002).
Hence overall, stress-related modulation of cholinergic mRNA expression acts to reduce available acetylcholine and depress cholinergic neurotransmission following stress.
However, other researchers (Perrier et al., Citation2005, Citation2006) were not able to reproduce the results of Kaufer et al. (Citation1998) and Meshorer et al. (Citation2002) in many respects, mainly concerning validation of the expression of AChER protein. However, they showed that single 30 min immobilization triggered 1 h later a threefold increase in cFos mRNA as well as a 3.7-fold increase of AChER mRNA in the brain and that soman intoxication caused a threefold increase in the striatum (Str).
The stress response is significantly affected by corticotropin-releasing hormone (CRH) release (Jacobson et al., Citation2000; Jeong et al., Citation2000). In corticotropin-releasing hormone knockout (CRH-KO) mice, glucocorticoid levels are not changed in basal conditions when compared to wild type (WT) mice, and remain almost unchanged in restraint stress while glucocorticoid secretion rapidly increases in WT mice (Jeong et al., Citation2000). In immobilization stress, the circulating levels of corticosterone in CRH-KO mice slightly increase, but to values that are 10 times lower than those in WT mice (Kvetnansky et al., Citation2006). This makes CRH-KO mice valuable as subjects for investigation of glucocorticoid effects during stress.
In order to analyze the stress effects in more detail, we have studied the changes in cholinesterase activity (AChE and BChE) and mRNA expression (AChE, BChE, AChER) in two mouse strains that differ in glucocorticoid stress levels. We used acute immobilization stress lasting 30 or 120 min or repeated stress 120 min stress daily for 7 d, and killed the mice 3 h after the end of the last stress session. We performed analysis separately in right and left hemisphere and in eight well-defined brain areas: frontal cortex (FC), and parietal cortex (PC), basal nucleus of Meynert (Nbm), ventral tegmental area (VTA), Str, amygdala (Amy), hippocampal dentate gyrus (dg) and CA3 region (CA3). Cholinergic signaling has been repeatedly shown to have laterality, i.e. cholinergic signaling differs between the right and left hemispheres (St. Peters et al., Citation2011), and mesolimbic-cholinergic interactions are stronger in right prefrontal regions as confirmed by acetylcholine determination (Parikh et al., Citation2013).
Thus, we have tested the hypothesis that acute or repeated stress is able to modulate activity of cholinesterases (AChE and BChE) and cholinesterase mRNA expression mainly via elevation of corticosterone levels. In order to test this hypothesis, we used CRH-KO mice that do not differ in basal levels of corticosterone from WT, but unlike WT mice are not able to increase corticosterone levels during stress.
Methods
Animals
CRH-KO mice were originally obtained from Harvard Medical School, Department of Endocrinology, Boston, USA and then bred in our animal facility. The WT line was a mixed 129SVJ/C57Bl6 line. Mice were maintained under controlled environmental conditions (12 h/12 h light/dark cycle, lights on at 06:00 h; environmental temperature 22 ± 1 °C). Food and water were available ad libitum. For the study, 48 males (body weight 20–25 g, 11–13 weeks old, 24 WT and 24 CRH-KO, three mice per cage) were used. The CRH-KO mice were obtained by mating of homozygous mice and the CRH−/− genotype was confirmed by DNA isolation from tail samples with subsequent PCR. Both WT and CRH-KO mice had the same genetic background and therefore no strain difference was possible. CRH-KO pregnant mice were given glucocorticoid in their drinking water (corticosterone 10 μg/ml) to enable the pups to survive (Venihaki & Majzoub, Citation1999). After delivery, corticosterone supplementation is not needed and therefore the KO mice were maintained under the same conditions as WT mice.
Mice were treated in accordance with European Union law, and the experimental protocol was approved by the Committees for the Protection of Experimental Animals of the 1st Medical Faculty, Charles University, Prague, and of the Institute of Experimental Endocrinology in Bratislava.
Immobilization stress protocol
Mice were exposed to immobilization stress in three groups (eight mice per group). The acute stress lasted 30 min, or 120 min; repeated stress was for 120 min applied every day for seven consecutive days. As controls, intact mice that were not immobilized were used (two groups of eight, WT and CRH-KO). Immobilization was performed by taping (with adhesive tape) all four legs, in the prone position, to a fixed board. The mice endured the stress procedure well as described elsewhere (Novakova et al., Citation2010). All mice survived without evident health problems the sevenfold exposure, but showed the expected weight loss after repeated stress. Mice were killed without anesthetic by decapitation 3 h after the immobilization was terminated (e.g. in acute stress after the first session). The immobilization started between 08:00 h and 09:00 h and the mice were killed at around the same time (12:00 h) in order to ensure similar levels of glucocorticoids. Brains were rapidly removed from the skull, frozen in dry ice and stored at −80 °C until use. The tissue from each mouse was used separately in each investigation.
Tissue
Samples of the FC, and PC cortex, Nbm, VTA, Str, Amy, hippocampal dg and CA3 were isolated using a punch method, isolating as much tissue as possible (Paxinos & Franklin, Citation2008). Briefly, after quick removal, the brains were immediately frozen on dry ice and cut into 300 μm thick serial coronal sections using a cryostat (Reichert-Jung) at −10 °C. The tissue was isolated under a dissection microscope by specialized metal punching needles. Tissue was divided into two portions, one for activity assays and one for PCR, flash frozen in liquid nitrogen and stored at −80 °C until further analysis. In order to establish laterality effects, right and left hemisphere samples of their respective region were isolated by this method.
mRNA expression
RNA was isolated by RNABee (AMS Biotechnology (Europe), Ltd., Frankfurt am Main, Germany). Concentration and purity of RNA were determined spectrophotometrically (at 260 (A1) and 280 nm (A2), respectively). Samples with A1/A2 values between 1.7 and 1.95 were used for downstream procedures. Reverse transcription was performed using Ready-To-Go You-Prime First-Strand beads (GE Healthcare, Praha, Czech Republic) and pd(N)6 primer (GE Healthcare, Praha, Czech Republic). PCR for specific receptors was carried out afterward using the primers originally designed or obtained from the references given in . The reaction process is described in with all details.
Table 1. Primer sequences and protocols used in PCR reactions. The initial denaturation was performed at 95 °C for 3 min. The final polymerization lasting 10 min was performed at 72 °C in all cases.
PCR products were analyzed on 2% agarose gels and visualized using Gel-Red (Biotium, Hayward, CA). As a control, the housekeeper glyceraldehyde 3-phosphate dehydrogenase (GAPDH) was used. Intensity of the individual bands was evaluated by PCBase software. For semiquantitative evaluation, the values were normalized to the signal obtained with GAPDH. Variability of this assay was less than 14%; sensitivity of the assay was 10−3 A.U.
AChE and BChE activities
Activities of AChE and BChE were determined by Ellman’s colorimetric method (Ellman et al., Citation1961) modified for a 96-well microtiter plate reader (Farar et al., Citation2013). Briefly, the activity of AChE was assayed with 0.69 mM acetylthiocholine and 0.5 mM 5,5-dithiobis(2-nitrobenzoic acid) (DTNB) in 5 mM HEPES buffer pH 7.4 containing 10 mM MgCl2. The total assay volume was 200 μl. Tissue samples (10 μg) were preincubated first with DTNB to saturate free sulfhydryl groups and with tetra(monoisopropyl)pyrophosphortetramide (iso-OMPA) (final concentration 0.1 mM (Li et al., Citation2000)) to block BChE activity during 30 min. The activity was measured at 412 nm at different time points (0, 5, 10, 20 and 30 min). BChE activity was assayed as described for AChE except that butyrylthiocholine was used as substrate and AChE activity was blocked with 1,5-bis(4-allyldimethylammoniumphenyl) pentan-3-one dibromide (BW284C51) (final concentration 5 μM). Variability of this assay was less than 11%; sensitivity of assay was 50 pmol/min/mg protein.
Protein concentration
Protein concentration was determined by a BCA assay kit (Pierce, Waltham, MA). The amount of protein was identical for all brain regions.
Statistical analysis
The data were tested for normal distribution and then statistically analyzed. Statistical significance of differences between means was evaluated with one-way ANOVA with post hoc SNK (Student–Newman–Keuls) test. Values of p < .05 were considered to be significant.
Results
Both acute and repeated stress affected mRNA expression and activity of cholinesterases. In the following, only the structures in which significant changes were recorded are mentioned.
mRNA expression
Right hemisphere
Striatum. There was decrease in AChE mRNA expression after 120 min immobilization in CRH-KO mice (one-way ANOVA, [F(DFn = 3, DFd = 10) = 4.358; p = .033], where F = test criterion of ANOVA, DFn = degrees of freedom of groups, DFd = degrees of freedom of individual subjects, p=probability level). No difference was found in BChE and AChER mRNA expression. Individual graphs showing changes in respective brain area are in Supplementary Figures. In order to better illustrate in which area the mRNA expression decreased (or increased), we show changes that are expressed as multiple relative to control (). Thus, all values that are significantly higher than control (intact mice that were not immobilized) are above 1.0, those decreased are below 1.0. Insignificant values are not shown.
Figure 1. Relative changes in mRNA expression after stress in WT and CRH-KO mice expressed as ratio relative to unstressed control. Ordinate shows duration of immobilization, abscissa gives mRNA expression ratio relative to control (ctrl). Control mice (intact mice, time = 0) were not immobilized. If there is significant difference, then the respective increase/decrease is shown; if there is no difference, then the ratio is set to 1.0. Data are expressed as mean ± SEM. One-way ANOVA with SNK post hoc analysis (n = 4 in all groups). Abbreviations in inset key: STR: striatum; AMY: amygdala; CA3: CA3 hippocampal area; PCx: parietal cortex; WT: wild type mice; KO: CRH-KO mice; R: right hemisphere; L: left hemisphere; AChE: acetylcholinesterase; AChER: readthrough variant of acetylcholinesterase; BChE: butyrylcholinesterase. For individual changes expressed as measured values see Supplementary Figures 1–5.
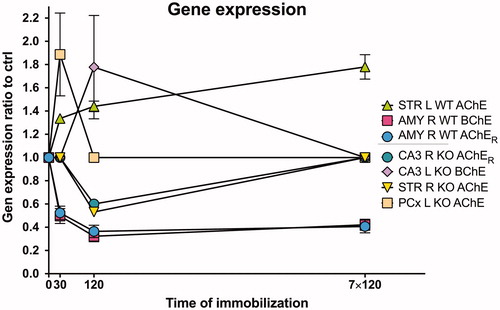
CA3 area. The splice AChE variant AChER mRNA expression () was decreased in CRH-KO mice when stressed for 120 min (one-way ANOVA, [F(3, 11) = 5.095; p = .019]).
Amygdala. AChER mRNA expression was decreased () in all WT stressed groups: after 30, 120 min and also after repeated stress exposure (one-way ANOVA, [F(3, 12) = 15.3; p = .0002]). BChE mRNA expression was also decreased in all stressed groups in WT mice (one-way ANOVA, [F(3, 11) = 14.4; p = .0004]).
Left hemisphere
Striatum. AChE mRNA expression increased () in WT gradually with the duration (and repetition) of stress: expression was increased after 30 or 120 min exposure, and the greatest increase was with repeated stress (120 min daily ×7) exposure (one-way ANOVA, [F(3, 5) = 16.81; p = .005]). In contrast, in CRH-KO mice, there was no change in AChE mRNA expression. No difference with stress was found in BChE and AChER mRNA expression in WT or CRH-KO mice.
CA3 area. BChE mRNA expression was increased () in CRH-KO mice when stressed for 120 min (one-way ANOVA, [F(3, 7) = 5.718; p = .027]).
Parietal cortex. AChE mRNA expression was increased () in CRH-KO mice after 30 min stress (one-way ANOVA, [F(3, 7) = 5.373; p = .031]).
Individual graphs showing mRNA expression changes in the following brain areas are in Supplementary Figures: Str (Supplementary Figure 1), CA3 area (Supplementary Figure 2), Amy (Supplementary Figure 3), PC (Supplementary Figure 4). No difference was found in the VTA (Supplementary Figure 5).
AChE activity
Right hemisphere
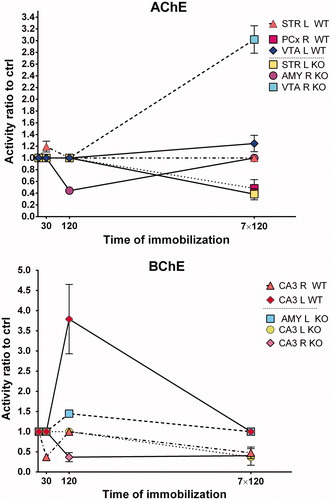
Stress decreased AChE activity in PCx (, on the top, changes are expressed as multiple relative to control) only if applied repeatedly (120 min daily ×7) in WT mice (one-way ANOVA, [F(3, 7) = 10.29; p = .006]). Also, there was decreased AChE activity in the Amy (one-way ANOVA, [F(3, 5) = 8.512; p = .02]) in CRH-KO mice stressed once for 120 min. In VTA, CRH-KO mice revealed increased AChE activity with repeated (120 min daily ×7) stress (one-way ANOVA, [F(3, 6) = 13.83; p = .004]).
Figure 2. Changes in acetylcholinesterase (AChE) and butyrylcholinesterase (BChE) activities in KO mice expressed as ratio relative to unstressed control (ctrl). Control mice (intact mice, time =0) were not immobilized. Ordinate shows duration of immobilization, abscissa gives mRNA expression ratio relative to control. If there is significant difference, then the respective increase/decrease is shown; if there is no difference, then the ratio is set to 1.0. Data are expressed as mean ± SEM. One-way ANOVA with SNK post hoc analysis (n = 4 in all groups). Abbreviations in inset key: STR: striatum; AMY: amygdala; CA3: CA3 hippocampal area; VTA: ventral tegmental area; PCx: parietal cortex; WT: wild type mice; KO: CRH-KO mice; R: right hemisphere; L: left hemisphere; AChE: acetylcholinesterase; BChE: butyrylcholinesterase. For individual changes expressed as measured values see Supplementary Figures 6–9.
Left hemisphere
Left striatum (STR) in stressed WT mice (, on the top) revealed a significant increase with acute 30 min exposure (one-way ANOVA, [F(3, 12) = 13.36; p = .0004]). Striatal AChE activity was decreased in CRH-KO mice with repeated stress (one-way ANOVA, [F(3, 9) = 12.41; p = .001]). WT mice had also increased AChE activity in the VTA with repeated stress (one-way ANOVA, [F(3, 10) = 4.217; p = .036]).
BChE activity
Right hemisphere
Butyrylcholinesterase activity (, bottom) was decreased in CA3 (one-way ANOVA, [F(3, 6) = 6.716; p = .024]) in WT mice with acute (30 min) stress and with repeated stress exposure (120 min daily ×7) while CRH-KO mice had decreased BChE activity after acute 120 min exposure and, similarly to WT mice, after repeated stress (one-way ANOVA, [F(3, 8) = 9.458; p = .005]) in CA3.
Left hemisphere
In WT mice, the CA3 (, bottom) in the left hemisphere showed increased BChE activity after acute 120 min stress exposure (one-way ANOVA, [F(3, 9) = 20.70; p = .0002]), while CRH-KO mice revealed decreased BChE activity with repeated (120 min daily × 7) stress exposure (one-way ANOVA, [F(3, 10) = 6.813; p = .009]). BChE activity was also increased in CRH-KO mice after acute 120 min exposure in Amy (one-way ANOVA, [F(3, 10) = 8.485; p = .004]).
Individual graphs showing changes in respective brain areas are shown in Supplementary Figures: right hemisphere AChE activity (Supplementary Figure 6); left hemisphere AChE activity (Supplementary Figure 7); right hemisphere BChE activity (Supplementary Figure 8); left hemisphere BChE activity (Supplementary Figure 9).
Discussion
We tested the hypothesis that acute stress is able to modulate activity of cholinesterases (AChE and BChE) and mRNA expression of these cholinesterases in the brain, and that these changes are mRNA expression mainly via elevation of corticosterone levels. To test the actions of glucocorticoid, we used CRH-KO mice that do not differ in basal levels of corticosterone from WT mice, but are not able to increase corticosterone levels during stress. Immobilization stress decreased BChE mRNA expression, and AChER mRNA expression in the right Amy. AChE mRNA expression was increased in the left Str. AChE activity was increased in left Str and decreased in right PC with repeated stress. BChE activity was decreased after 30 min in the right CA3, but increased after 120 min in the left CA3. The pattern of changes in CRH-KO mice differs from that in WT mice. Thus, we can confirm our hypotheses that cholinesterases are affected by stress and this is mediated, in part, by corticosterone. As a new finding, we described changes in brain BChE mRNA expression and activity during stress exposure.
The general effect of immobilization stress on cholinesterases mRNA expression and activity was mild. In the brain regions with statistically significant changes, decreases rather than increases were observed. Moreover, these changes were region-, genotype- and stress duration-specific and revealed strong laterality. mRNA expression changes revealed a different pattern from the changes in enzyme activity. In is necessary to mention that measurements of transcript levels do not necessarily reflect “gene expression”, but rather balance between transcription and degradation of the quantified transcript.
Previous papers have studied changes in neocortex, hippocampus and cerebellum. We performed more detail analysis (more time points) taking laterality into consideration as well. We have analyzed the changes in the FC, and PC, Nbm, VTA, Str, Amy, hippocampal dg and CA3 separately in the left and right brain. This attitude showed time- and region-specific changes in AChE and BChE mRNA expression and activity. Moreover, absence of glucocorticoids during stress significantly changed the AChE and BChE response to stress.
The results of Kaufer et al. (Citation1998) and Perrier et al. (Citation2005) are different. Although Perrier et al. (Citation2005) found an increase in AChER mRNA after stress lasting 30 min and a 60 min interval to measurement, these authors were not able to repeat the findings concerning swimming stress (Kaufer et al., Citation1998; Meshorer et al., Citation2002).
Concerning terminology, the stress used by these groups was not immobilization as such, but restraint stress (in restraint cage or box), which is not as strong a stressor as immobilization (with limbs taped to surface) (see Buynitsky & Mostofsky, Citation2009 for details).
Here we used immobilization and analyzed the changes in mRNA expression and activity after the 3 h period following stress that has been shown to be peak of activity changes in the cortex (Kaufer et al., Citation1998). According to our data, there was no increase in AChE activity in cortex (frontal, parietal; WT mice), but there was slight (20% approximately) increase of AChE activity in left Str (). Similarly, no change in AChE mRNA expression and activity was found in hippocampal dg and CA3 area, but we did find changes in BChE activity in CA3 area – a new finding (all in WT mice).
Although in general our findings showed decreases in both mRNA expression and enzyme activity, there was one area in WT mice that revealed increases in both mRNA expression and activity – left Str ( and , AChE), and this increase was detectable in mRNA expression after every duration of stress, but activity was increased only after 30 min of stress. Interestingly, absence of CRH affected the mRNA expression not in the left Str but in the right Str. The absence of CRH (and thus only slight corticosterone increase during stress, as opposed to 10-fold increase of corticosterone secretion in WT mice) led to decrease in AChE mRNA expression.
In general, the AChE and BChE activities were similar to those reported elsewhere (Svedberg et al., Citation2003). Moreover, the AChE/BChE activity ratio is similar as in Li et al. (Citation2000); these authors measured the activity in units per gram and therefore it is not possible to compare the values directly.
AChE variants can be affected by various events. For example, there are reports about an increased N-terminally extended AChE-T variant that may cause lethality to cells expressing it, which might affect brain neurons under acute stress (Toiber et al., Citation2009), and changes in hippocampal microRNA-132 in stress (Shaltiel et al., Citation2013), and changes in AChER in Alzheimer’s patients (Berson et al., Citation2008). Moreover, epigenetic factors are able to affect the AChE promoter in a stress-related manner (Sailaja et al., Citation2012), which supports hypotheses that chromatin changes support long-term transcriptional memory in the hippocampus.
A new finding here is that BChE activity was affected by stress specifically in the CA3 (, bottom). In WT mice, for the right CA3, activity was decreased at 3 h after 30 min stress, but not at 3 h after 2 h stress, and decreased at 3 h after repeated stress (, bottom). In contrast, for the left CA3, there was no change after 30 min stress, and a large increase after 2 h stress, and no change after repeated stress. In CRH-KO mice, for the right CA3, there was no change after 30 min stress, a decrease after 120 min stress, and a decrease after repeated stress. For the left CA3, there was no change with 30 min or 2 h stress, and a decrease after repeated stress. Hence, the key effect of corticosterone is deduced to be on stimulating BChE activity selectively in the left CA3 after 120 min stress, as without corticosterone (due to the CRH-KO) BChE activity in the left CA3 was unchanged. The functional significance of the left-right differences and the role of corticosterone remain to be explored.
As mentioned before, the AChE gene contains a GRE. Concerning BChE, coded by one gene only and without alternatively spliced forms (Lockridge, Citation2015), there is no GRE according to our search of available data. Importantly, the AChE gene, in addition to a GRE, contains also a CRE (Choi et al., Citation2001). This is important as cAMP is increased due to adrenoceptor activation that is the result of hugely elevated catecholamine (epinephrine) levels during initial stress phases. The cAMP-dependent pathway has adverse effects on AChE expression (activation in birds and repression in mammals) (Choi et al., Citation2001). Thus, this finding can be the reason for decreased AChE mRNA expression and/or activity in our study.
Although there are several papers describing stress effects on AChE activity (Das et al., Citation2000; Fatranska et al., Citation1989; Gabriel & Soliman, Citation1983; Romero-Vecchione et al., Citation1987; Sunanda & Raju, Citation2000) and also those cited above, the results are still confusing. Some data describe activity decrease and some indicate increase in AChE activity after stress. No firm conclusion can be made, but it is plausible that the response of cholinesterases to stress is complex, comprising interactions between different brain regions, and is laterally specific. Nonetheless, the data about the role (although limited) of BChE in the stress response described here are novel. The laterality of changes is not surprising. Cholinergic signaling is different in the right and left hemispheres, e.g. the density of choline transporter differs (Apparsundaram et al., Citation2005), as well as muscarinic receptor-evoked inositol phosphate signaling (Pediconi & Barrantes, Citation1993). Thus, our results accord with previous observations. In summary, we can conclude that stress changes mRNA expression of mRNAs for cholinesterases and their activity, that these changes are region- and stress duration-specific, and show strong laterality. Moreover, the ability to increase corticosterone levels during stress (abolished by CRH-KO) contributes to the pattern of changes, especially in CA3.
Acknowledgements
Supported by grant GAUK480613 from Grant Agency of Charles University and by The Ministry of Education, Youth and Sports – Institutional Support for Longterm Development of Research Organizations – Charles University, 1st Faculty of Medicine, PRVOUK P38 – Biological Aspects of the Investigation of Human Movement.
Disclosure statement
The authors declare no conflict of interest.
Additional information
Funding
References
- Apparsundaram S, Martinez V, Parikh V, Kozak R, Sarter M. (2005). Increased capacity and density of choline transporters situated in synaptic membranes of the right medial prefrontal cortex of attentional task-performing rats. J Neurosci 25:3851–6.
- Bausero P, Schmitt M, Toussaint JL, Simoni P, Geoffroy V, Queuche D, Duclaud S, et al. (1993). Identification and analysis of the human choline acetyltransferase gene promoter. Neuroreport 4:287–90.
- Ben Aziz-Aloya R, Sternfeld M, Soreq H. (1993). Promoter elements and alternative splicing in the human ACHE gene. Prog Brain Res 98:147–53.
- Berson A, Knobloch M, Hanan M, Diamant S, Sharoni M, Schuppli D, Geyer BC, et al. (2008). Changes in readthrough acetylcholinesterase expression modulate amyloid-beta pathology. Brain 131:109–19.
- Buynitsky T, Mostofsky DI. (2009). Restraint stress in biobehavioral research: recent developments. Neurosci Biobehav Rev 33:1089–98.
- Cervini R, Houhou L, Pradat P-FO, Béjanin S, Mallet J, Berrard S. (1995). Specific vesicular acetylcholine transporter promoters lie within the first intron of the rat choline acetyltransferase gene. J Biol Chem 270:24654–7.
- Choi RCY, Siow NL, Zhu SQ, Wan DCC, Wong YH, Tsim KWK. (2001). The cyclic AMP-mediated expression of acetylcholinesterase in myotubes shows contrasting activation and repression between avian and mammalian enzymes. Mol Cell Neurosci 288:81–5.
- Das A, Kapoor K, Sayeepriyadarshini AT, Dikshit M, Palit G, Nath C. (2000). Immobilization stress-induced changes in brain acetylcholinesterase activity and cognitive function in mice. Pharmacol Res 42:213–17.
- Deutsch VR, Pick M, Perry C, Grisaru D, Hemo Y, Golan-Hadari D, Grant A, et al. (2002). The stress-associated acetylcholinesterase variant AChE-R is expressed in human CD34(+) hematopoietic progenitors and its C-terminal peptide ARP promotes their proliferation. Exp Hematol 30:1153–61.
- Ellman GL, Courtney KD, Andres V, Jr., Feather-Stone RM. (1961). A new and rapid colorimetric determination of acetylcholinesterase activity. Biochem Pharmacol 7:88–95.
- Ennis M, Shipley MT. (1992). Tonic activation of locus coeruleus neurons by systemic or intracoerulear microinjection of an irreversible acetylcholinesterase inhibitor: increased discharge rate and induction of c-fos. Exp Neurol 118:164–77.
- Farar V, Hrabovska A, Krejci E, Myslivecek J. (2013). Developmental adaptation of central nervous system to extremely high acetylcholine levels. PLoS One 8:e68265.
- Fatranska M, Kiss A, Oprsalova Z, Kvetnansky R. (1989). Acetylcholinesterase and choline acetyltransferase activity in some hypothalamic nuclei under immobilization stress in rats. Endocrinol Exp 23:3–10.
- Gabriel NN, Soliman KF. (1983). Effect of stress on the acetylcholinesterase activity of the hypothalamus–pituitary–adrenal axis in the rat. Horm Res 17:43–8.
- García-Ayllón M-S, Millán C, Serra-Basante C, Bataller R, Sáez-Valero J. (2012). Readthrough acetylcholinesterase is increased in human liver cirrhosis. PLoS One 7:e44598.
- Härtl R, Gleinich A, Zimmermann M. (2011). Dramatic increase in readthrough acetylcholinesterase in a cellular model of oxidative stress. J Neurochem 116:1088–96.
- Imperato A, Puglisi-Allegra S, Casolini P, Angelucci L. (1991). Changes in brain dopamine and acetylcholine release during and following stress are independent of the pituitary-adrenocortical axis. Brain Res 538:111–17.
- Jacobson L, Muglia LJ, Weninger SC, Pacak K, Majzoub JA. (2000). CRH deficiency impairs but does not block pituitary–adrenal responses to diverse stressors. Neuroendocrinology 71:79–87.
- Jeong KH, Jacobson L, Pacak K, Widmaier EP, Goldstein DS, Majzoub JA. (2000). Impaired basal and restraint-induced epinephrine secretion in corticotropin-releasing hormone-deficient mice. Endocrinology 141:1142–50.
- Karczmar AG. (2010). Cholinesterases (ChEs) and the cholinergic system in ontogenesis and phylogenesis, and non-classical roles of cholinesterases – a review. Chem Biol Interact 187:34–43.
- Kaufer D, Friedman A, Seidman S, Soreq H. (1998). Acute stress facilitates long-lasting changes in cholinergic gene expression. Nature 393:373–7.
- Kawashima K, Yoshikawa K, Fujii YX, Moriwaki Y, Misawa H. (2007). Expression and function of genes encoding cholinergic components in murine immune cells. Life Sci 80:2314–19.
- Kvetnansky R, Kubovcakova L, Tillinger A, Micutkova L, Krizanova O, Sabban EL. (2006). Gene expression of phenylethanolamine N-methyltransferase in corticotropin-releasing hormone knockout mice during stress exposure. Cell Mol Neurobiol 26:735–54.
- Li B, Stribley JA, Ticu A, Xie W, Schopfer LM, Hammond P, Brimijoin S, et al. (2000). Abundant tissue butyrylcholinesterase and its possible function in the acetylcholinesterase knockout mouse. J Neurochem 75:1320–31.
- Li G, Klein J, Zimmermann M. (2013). Pathophysiological amyloid concentrations induce sustained upregulation of readthrough acetylcholinesterase mediating anti-apoptotic effects. Neuroscience 240:349–60.
- Li Y, Camp S, Rachinsky TL, Bongiorno C, Taylor P. (1993). Promoter elements and transcriptional control of the mouse acetylcholinesterase gene. J Biol Chem 268:3563–72.
- Lockridge O. (2015). Review of human butyrylcholinesterase structure, function, genetic variants, history of use in the clinic, and potential therapeutic uses. Pharmacol Ther 148:34–46.
- Massoulie J. (2002). The origin of the molecular diversity and functional anchoring of cholinesterases. Neurosignals 11:130–43.
- Meshorer E, Erb C, Gazit R, Pavlovsky L, Kaufer D, Friedman A, Glick D, et al. (2002). Alternative splicing and neuritic mRNA translocation under long-term neuronal hypersensitivity. Science 295:508–12.
- Novakova M, Kvetnansky R, Myslivecek J. (2010). Sexual dimorphism in stress-induced changes in adrenergic and muscarinic receptor densities in the lung of wild type and corticotropin-releasing hormone-knockout mice. Stress 13:22–35.
- Parikh V, St Peters M, Blakely RD, Sarter M. (2013). The presynaptic choline transporter imposes limits on sustained cortical acetylcholine release and attention. J Neurosci 33:2326–37.
- Paxinos G, Franklin KBJ. (2008). The mouse brain in stereotaxic coordinates. New York: Elsevier Academic Press.
- Pediconi MF, Barrantes FJ. (1993). Phospholipid metabolism under muscarinic cholinergic stimulation exhibits brain asymmetry. Neurochem Res 18:559–64.
- Perrier N, Salani M, Falasca C, Bon S, Augusti-Tocco G, Massoulié J. (2006). Readthrough acetylcholinesterase expression remains minor after stress or exposure to inhibitors. J Mol Neurosci 30:75–6.
- Perrier NA, Salani M, Falasca C, Bon S, Augusti-Tocco G, Massoulié J. (2005). The readthrough variant of acetylcholinesterase remains very minor after heat shock, organophosphate inhibition and stress, in cell culture and in vivo. J Neurochem 94:629–38.
- Romero-Vecchione E, Fatranska M, Kvetnansky R. (1987). Acetylcholinesterase activity in several hypothalamic and brain stem nuclei after acute and chronic immobilization stress in rats. Endocrinol Exp 21:159–65.
- Sailaja BS, Cohen-Carmon D, Zimmerman G, Soreq H, Meshorer E. (2012). Stress-induced epigenetic transcriptional memory of acetylcholinesterase by HDAC4. Proc Natl Acad Sci USA 109:E3687–95.
- Shaltiel G, Hanan M, Wolf Y, Barbash S, Kovalev E, Shoham S, Soreq H. (2013). Hippocampal microRNA-132 mediates stress-inducible cognitive deficits through its acetylcholinesterase target. Brain Struct Funct 218:59–72.
- St. Peters M, Cherian AK, Bradshaw M, Sarter M. (2011). Sustained attention in mice: expanding the translational utility of the SAT by incorporating the Michigan Controlled Access Response Port (MICARP). Behav Brain Res 225:574–83.
- Sunanda Rao BS, Raju TR. (2000). Restraint stress-induced alterations in the levels of biogenic amines, amino acids, and AChE activity in the hippocampus. Neurochem Res 25:1547–52.
- Svedberg MM, Svensson A-L, Bednar I, Nordberg A. (2003). Neuronal nicotinic and muscarinic receptor subtypes at different ages of transgenic mice overexpressing human acetylcholinesterase. Neurosci Lett 340:148–52.
- Toiber D, Greenberg DS, Soreq H. (2009). Pro-apoptotic protein–protein interactions of the extended N-AChE terminus. J Neural Transm (Vienna) 116:1435–42.
- Venihaki M, Majzoub JA. (1999). Animal models of CRH deficiency. Front Neuroendocrinol 20:122–45.
- Zarghooni S, Wunsch J, Bodenbenner M, Bruggmann D, Grando SA, Schwantes U, Wess J, et al. (2007). Expression of muscarinic and nicotinic acetylcholine receptors in the mouse urothelium. Life Sci 80:2308–13.
- Zimmermann M. (2013). Neuronal AChE splice variants and their non-hydrolytic functions: redefining a target of AChE inhibitors? Br J Pharmacol 170:953–67.