
Abstract
The study of autonomic nervous system changes associated with generalized social phobia (GSP) disorder has increased in recent years, showing contradictory results. The present study aimed to evaluate how young people with GSP reacted before, during, and after exposure to the Trier Stress Social Test (TSST), focusing on their autonomic changes (heart rate variability (HRV) and salivary alpha-amylase (sAA)) compared to a control group (non-GSP). Some psychological variables were also considered. Sex was specifically studied as a possible modulator of autonomic fluctuations and psychological state. Eighty young people were randomly distributed into two counterbalanced situations: stress condition (N = 18 and 21 for GSP and non-GSP, respectively) and control condition (N = 21 and 20 for GSP and non-GSP, respectively), where cardiovascular variables were continuously recorded. Psychological questionnaires about mood and perceived stress were filled out, and five saliva samples were collected to analyze sAA. GSP participants showed higher values on low- and high-frequency ratios (HR domains), compared to non-GSP people, during exposure to the TSST, but no differences were observed after the stressor. Furthermore, the two groups did not differ in sAA. Importantly, positive affect in GSP participants was modulated by sex. The present study suggests that the balance between high- and low-frequency domains of HRV is a key cardiovascular marker reflecting the stress response of GSP people, as well the importance of sex in positive affect when facing a stressful situation.
Introduction
The study of Social Phobia (SP), recently re-named social anxiety disorder (SAD) in the DSM-V (American Psychiatric Association, Citation2013), has increased in recent years. According to the DSM-V, the person with this disorder suffers significant distress or impairment that interferes with his or her ordinary routine in social settings, at work or school, or during other everyday activities. This state is disproportionately experienced in individuals with Generalized Social Phobia (GSP). GSP is considered a subtype of SP with a higher stress response – and less explored by research – than in people with SP, given that the social fears of GSP subjects span a broad range of social situations (APA, Citation2000).
Cardiovascular responses of GSP sufferers have been studied less than other anxiety disorders such as panic attack (Friedman, Citation2007). Generally, anxiety diseases have been characterized by maladaptive responses to both stressful and non-threatening situations, reflected in cardiac problems (Pitting et al. 2013). In GSP studies, no differences in Heart Rate (HR) or Heart Rate Variability (HRV) are found between GSP and healthy people exposed to a stressor, possibly because people with GSP showed higher baseline cardiac values, which suggests a restricted capacity of the Autonomous Nervous System (ANS) to react to stress (Grossman et al., Citation2001; Klumbies et al., Citation2014; Krämer et al., Citation2012). However, these results should be interpreted with caution and need new support, given that they were based on very different sample ages and diverse methods.
In recent years, the salivary alpha amylase (sAA) enzyme has been widely used as an indicator of ANS activity. Pioneering studies reported that sAA secretion was controlled by the sympathetic nervous system (SNS) (Bosch et al., Citation2002, Citation2011; Nater et al., Citation2005), but more recent studies have indicated that it is also controlled by the parasympathetic nervous system (PNS) (Bosch, Citation2014; Ditzen et al., Citation2014). However, studies investigating sAA, stress response, and GSP disorder are scarce. In fact, to our knowledge, only one study reported no significant differences between patients with non-specified SP and healthy adults when exposed to the TSST (Klumbies et al., Citation2014); in addition, no differences between sAA responses of SP children and healthy children were found after TSST-C exposure in the Krämer et al. (Citation2012) study.
Overall, the main goal of the present study was to clarify how different autonomic indicators, such as HR, HRV parameters, and sAA concentrations, of individuals with GSP change in response to a stressful event. Specifically, we aimed to explore the ANS reaction (and the psychological response) of young people with GSP-related-symptoms exposed to a social stress situation. To achieve this purpose, young people distributed into two sub-samples (GSP and non-GSP) participated in one of the two different conditions (stress or control), following a between-subject design. In addition, the influence of sex was considered because previous findings had shown higher ANS responses and elevated negative mood levels in socially phobic women compared to men (Grossman et al., Citation2001; Murthy et al. Citation2014). Based on the hypothesis of the limited ANS capacity of GSP people in responding to stressful situations, found in previous studies (Grossman et al., Citation2001; Klumbies et al., Citation2014; Krämer et al., Citation2012), we expected higher cardiac and sAA baseline values in the young GSP group in both the stress and control conditions, compared to the non-GSP group. Thus, it would be possible to observe similar autonomic responses in both GSP and non-GSP people exposed to a stress condition. In addition, we predicted higher psychological responses to the stressor in women compared to men, based on previous results (Kelly et al., Citation2008; Tomova et al., Citation2014). Finally, we expected higher negative mood and state anxiety levels in GSP women than GSP men, in line with the Grossman et al. (Citation2001) results.
Method
Participants
The final sample in the present study was composed of eighty participants (40 women and 40 men) whose ages ranged from 18 to 25 years (mean age: 19.487, SD = 1.862). All of them were recruited from Psychology (60%) and Computer Engineering (40%) courses, and they received class credit for their participation.
The 80 subjects were selected from a broader pool of 675volunteers who filled out the Social Phobia and Anxiety Inventory (SPAI; Turner & Beidel, Citation1989). This test has shown good internal consistency coefficients (Cronbach’s alpha = .96 for the subscale of SP) and high test–retest reliability (.89) in young Spanish adults and college students (Olivares et al., Citation1999). From this pool, subjects were included in the GSP group if they obtained a score >97 on the Social Phobia Scale, and in the non-anxious group (NA) if their score was <50. Additionally, subjects included in the GSP group participated in an individual clinical interview with a clinician who was blind to the previous classification. All participants included in the GSP group met all the clinical criteria for GSP using the Anxiety Disorders interview Schedule (DSM-IV-TR). From the initial pool of 675 potential participants, only 96 subjects were selected to perform this experiment, based on their SPAI score and clinical interview.
Next, subjects were asked by exclusion criteria as: displayed a history of alcohol or other drug abuse; had cardiovascular, endocrine, neurological or psychiatric diseases; had visual or hearing problems; had experienced a stressful life event during the past year; were using any medication directly related to emotional or cognitive function, or one that was able to influence hormonal levels, such as glucocorticoids, oral contraceptives, beta-blockers, antidepressants, benzodiazepines, asthma medication, thyroid therapies, and psychotropic substances. Vitamins, sporadic use of painkillers, and natural therapies were allowed. None of the participants were habitual smokers (more than 10 cigarettes a week). After the exclusion criteria, 16 subjects from 96 were excluded, leaving a final sample of 80 participants who were distributed into two groups: the GSP group (N = 39; 20 women and 19 men) included subjects who had >97 on the SPAI and were diagnosed in the Interview, and the non-GSP group (N = 41; 20 women and 21 men) contained people who obtained <50 score on the SPAI. At this point, subjects from both groups were randomly selected for two possible situations: stress condition (N = 18 to GSP and N = 21 to non-GSP) and control condition (N = 21 to GSP and N = 20 to non-GSP).
Participants were contacted by telephone and asked to come to the Faculty of Psychology on two consecutive days. This paper refers only to results obtained on the second day of this experiment. Before each session, they were instructed to drink only water, not smoke, eat or take any stimulants, such as coffee, cola, caffeine, tea or chocolate, two hours prior to the session, and not brush their teeth at least one hour before each session. The study was conducted in accordance with the Declaration of Helsinki, and the Ethics Research Committee of the University of Murcia approved the protocol and conduct. All the participants received verbal and written information about this study and signed an informed consent prior to their inclusion.
Procedure
This study employed a between-subject design with two completely randomized and counterbalanced conditions: a stress and a control conditions (). The experimental session was carried out at the Psychobiology Laboratory between 3 and 6 pm. Upon arrival at the laboratory, weight and height were measured, and the experimenter checked whether the participant had followed the instructions given previously.
Figure 1. Timeline of both stress (S) and control (C) conditions. HR and HRV = habituation, introduction, preparation, Speech (S)/Reading (C), Arithmetic (S)/Counting (C) and recovery phases. sAA = −10, −5, 0, +10, and +45 min. Psychological assessments = habituation phase and the end of recovery phase.
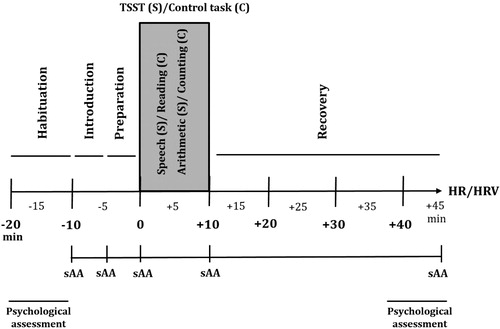
Stress condition
The experimental protocol started with a habituation phase of 10 min, during which participants remained seated. In this phase, baseline measures were collected for HR, HRV and sAA. Moreover, participants filled out the PANAS and STAI-E questionnaires. After this habituation period, participants were informed about the Trier Social Stress Test (TSST) in front of an audience in the same room where the task took place. In this study, a modified version of the original TSST was used (Kirschbaum et al., Citation1993), as the committee composed of only two experimenters, and the preparation phase (5 min) was performed in the same room as the TSST. The rest of the procedure was similar to the traditional TSST. As soon as the task was completed, participants returned to the first room, and they had a 35 min recovery phase while they answered the STAI-S and PANAS questionnaires. Then, the HR and HRV recorders were turned off, and the last salivary sample was collected.
Control condition
The control session was planned to be similar to the TSST session without being stressful for the participants, as in previous studies (Espín et al., Citation2013; Hidalgo et al., Citation2012). It was performed in the same room as the TSST, but all stress-producing elements (video camera, tape recorder, committee and microphone) were removed. The control condition was designed based on Dickerson & Kemeny (Citation2004). Thus, participants had to read a short part of a book with neutral content in the preparation phase. Next, participants read a fragment of a book for 5 minutes (Reading task) and did an arithmetic task that consisted of counting for 5 minutes (Counting task). Both tasks were performed aloud. Collection times and the questionnaires used were identical for both conditions.
Measures
Cardiovascular measures
HR and HRV were measured using a Polar©RS800cx watch (Polar CIC, USA). This device comprises a chest belt placed on the solar plexus and a Polar watch. After eliminating the artifacts, the HR means were computed using the software Kubios Analyses (Biomedical Signal Analysis Group, University of Kuopio, Finland). HR was recorded in real-time and expressed as beats per minute (bpm). Among the HRV measures, we took special interest in the time domain referred to the root mean square of R–R intervals (RMSSD) and the LF/HF frequency balance, which involves low- and high-frequency domains. Accuracy levels were 1 millisecond for RMSSD and 1 ms2 for the LF/HF balance, respectively, according to the Task Force of The European Society of Cardiology (Citation1996). Each heartbeat is transmitted and stored in the flash memory of the watch. HR and HRV were monitored continuously during the entire session, and periods related to changes in participants’ positions, i.e., sitting/standing, or walking, were removed. For main analyses, periods corresponding to session phases were selected, and so HR and HRV were considered every 5-min within each phase (habituation, introduction, preparation, speech, arithmetic and recovery).
Salivary alpha-amylase (sAA)
Saliva was collected using Salivettes (Sarstedt, Rommelsforf, Germany). Participants were instructed to introduce the cotton swab into their mouths for exactly 1 min, not chew the cotton, and move the swab around in a circular pattern to collect saliva from all the salivary glands, as recommended by other authors (Bosch et al., Citation2011; Rohleder & Nater, Citation2009). We obtained 5 saliva samples: t − 10, t − 5, t0, t + 10, and t + 45 min, with reference to the start of the stressor. Samples were frozen at −20 °C until the assay took place. The sAA concentrations were measured by an enzyme kinetic method using the commercial sAA assay kit form Salimetrics (USA). The analyses were carried out in the Social Cognitive Neuroscience Laboratory (University of Valencia, Spain). Assay sensitivity was 0.4 U/mL. For each subject, all the samples were analyzed in duplicate and in the same trial. The inter- and intra-assay variation coefficients were all below 10%.
Questionnaires and scales
PANAS (Positive and Negative Affect Schedule; Watson et al., Citation1988) was used to evaluate the mood. PANAS is a psychometric tool consisting of two subscales that quantify Positive Affect (PA) and Negative Affect (NA). Participants responded using a 5-point Likert scale ranging from 1 (not at all) to 5 (extremely). The Spanish version of the scale had a Cronbach’s alpha ranging from .87 to .89 for PA, and from .89 to .91 for NA.
State Anxiety Inventory (STAI form S; Spielberger, 2010) was employed. It is composed of 20 items rated on a 4-point Likert scale. The Spanish version of the scale had a Cronbach’s alpha ranging from .90 to .93 (Seisdedos, Citation1988).
Statistical analysis and data management
Normal distribution and homogeneity of variance of data were verified by the Shapiro–Wilk and Kolmogorov–Smirnov tests, except for the sAA data, which were log-transformed prior to continuing with the statistical procedures.
Differences (age and BMI) between GSP and non-GSP groups were tested using independent samples t-tests. The same tests were carried out to analyze baseline measures of sAA and cardiovascular measures with regard to group and condition factors.
Regarding HR, HRV and sAA, ANOVAs for repeated measures with Time as within-subjects factor and Group (GSP, non-GSP), Sex (women, men), and Condition (stress, control) as the between-subjects factors were carried out. Time values for sAA were employed (−10, −5, 0, +10, and +45 min), whereas for the cardiac variables, the experimental phases were used (habituation, introduction, preparation, speech, arithmetic and recovery).
Psychological measures (anxiety, negative and positive mood) were analyzed by ANOVAs for repeated measures, considering Group, Sex, and Condition as the between-subjects factors and Time (pre and post-task) as within-subject factor.
Furthermore, the area under the curve with respect to the ground (AUCg) and to the increase (AUCi) were calculated, using the trapezoid formula specified in Pruessner et al. (Citation2003), for the sAA levels. Univariate ANOVAs were computed to compare baseline data of physiological indices, i.e., HR, RMSSD, LF/HF ratio and sAA concentrations for both groups.
All results were corrected by the Greenhouse–Geisser procedure when appropriate. Post hoc comparisons were performed using the Bonferroni adjustments for multiple comparisons. Level of significance was taken as <.05. We used SPSS 19.0 (Chicago, IL) to perform the statistical analyses. For interpretation of the figures, the values represent mean absolute scores, and not log-transformed values.
Results
There were no significant differences between the GSP and non-GSP groups on age (p > .05) or BMI values (p > .05). However, significant differences were observed in BMI in relation to Sex (p = .016), with higher values in men than women ().
Table 1. Means and standard deviations (in parentheses) of the anthropometric data for all subgroups.
Heart rate (HR)
Regarding HR, significant effects of Group [F (1, 72) = 7.41, p < .01, ηp2 = 0.10] and the Time × Condition interaction [F (1, 72) = 9.44, p < .01, η2p = 0.12]. In addition, there were significant differences in HR between all periods in the stress condition (for all p < .05), except between Speech and Arithmetic (p > .05), whereas no differences between periods were found in the control session (for all p > .05). Focusing on baseline data (), higher HR levels in GSP, compared to non-GSP, were observed at the beginning of the experimental session (p < .01). Group × Condition interaction (p > .05) was not significant, as reflected in . GSP subjects showed higher HR compared to non-GSP subjects across all periods and conditions. No other factors or interactions were significant (for all p > .05).
Figure 2. Heart rate (HR) values (A), root mean square of R–R intervals (RMSSD) (B), low frequency/high frequency ratio (LF/HF ratio) values (C) and salivary alpha-amylase concentrations (sAA) (D) for GSP (N = 39) and non-GSP people (N = 41) when exposed to both stress and control conditions. The repeated measures ANOVA showed a significant Group × Condition interaction in the LF/HF ratio. Specifically, higher LF/HF levels were found in GSP people compared to non-GSP values in the stress condition (**p < .01), whereas no significant differences were observed in the control condition (p > .05). No other significant Group × Condition interactions were found (all p > .05). Depicted values are means, and error bars represent the SEM.
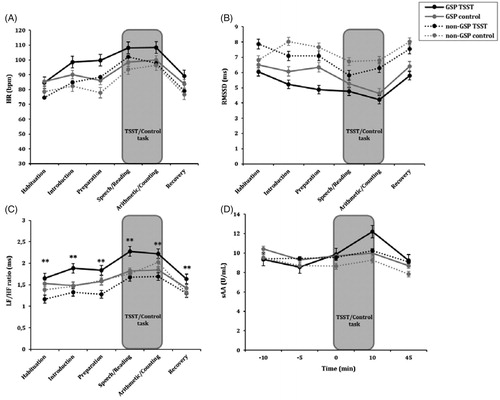
Table 2. Means and standard deviations (in parentheses) for baseline values of heart rate (HR) (beats-per-minute), root mean square of R–R intervals (RMSSD) (milliseconds), low-frequency/high-frequency ratio (LF/HF) (milliseconds) and salivary alpha amylase concentrations (sAA) (U/mL), for GSP and non-GSP groups.
Heart rate variability (HRV)
RMSSD data showed significant effects of Group [F (1, 72) = 11.85, p < .001, η2p = 0.14] and Time [F (1,72) = 12.10, p < .001, η2p = 0.14]. GSP subjects presented lower RMSDD levels than non-GSP participants in both sessions, i.e., stress and control. This significant difference between the two groups was specifically observed in the baseline data for RMSSD (p < .01) (). In addition, lower RMSDD levels were observed during the TSST (speech and arithmetic tasks), compared with the RMSDD data for the rest of the periods (all p < .05), but no differences were found between the two TSST tasks (p > .05). As shows, the Group × Condition interaction was not significant (p > .05). No other factors were significant (all p > .05).
Regarding the LF/HF balance, significant effects of Time [F (1,72) = 21.43, p < .001, η2p = 0.23] and the Group × Condition [F (1,72) = 4.72, p < .05, η2p = 0.06] and Sex × Condition [F (1,72) = 5.72, p < .05, η2p = .07] interactions were observed. GSP subjects showed higher levels of LF/HF balance than non-GSP subjects in the stress condition (p < .01), whereas no differences were observed between the two groups in the control condition (p > .05) (). On the other hand, women in the stress condition had higher levels of LF/HF than women in the control condition (p > .05). No significant differences were reported for men (for all p > .05). Other factors and interactions were not significant (p > .05). Exploring baseline markers, significant effects of Group were observed, as GSP showed higher LF/HF than non-GSP (p < .05) at the beginning of both the stressful and control conditions ().
Salivary alpha-amylase (sAA)
Time [F (1,72) = 11.92, p < .001, η2p = 0.14] and the Time × Condition interaction [F (1,72) = 4.83, p = .002, η2p = 0.06] were significant for sAA. In the stress condition, there were significant differences between the −10 and +10 (p < .001), −5 and +10 (p < .001), 0 and +10 (p < .01) and +10 and +45 (p < .001) samples, with the rest of the comparisons not being significant (p > .05). In the control condition, the −10 and +45 difference was significant (p < .001), as was the +10 and +45 difference (p < .05). However, the interaction between the Group and Condition factors was not significant for sAA levels (p > .05) ().
A significant effect of Condition was found on AUCg of sAA [F (1,76) = 304.16, p < .05, η2p= 1.00]; higher AUCg was observed in the stress condition compared to the control condition for all participants. Results of AUCi reported no significant differences (for all p > .05). In the case of baseline sAA, no significant effect of Group was found (both p > .05) ().
State anxiety
Group [F (1,72) = 6.20, p < .05, η2p = 0.08], Sex [F (1,72) = 7.02, p < .01, η2p = 0.089], Condition [F (1,72) = 28.30, p < .001, η2p = 0.28], Time [F (1,72) = 50.30, p < .001, η2p = 0.41] and the Time × Condition interaction [F (1,72) = 40.98, p < .001, η2p = 0.363] showed significant effects on state anxiety. With respect of individual effects, GSP group showed higher state anxiety than the non-GSP group; moreover, women maintained higher state anxiety than men throughout the session. Participants showed more state anxiety after the TSST than before it (p < .001), whereas no pre–post differences were reported in the control condition (p > .05). In addition, although no significant pre-task differences were found (p > .05), participants in the stress condition reported higher state anxiety than participants in the control condition after the tasks (p < .001).
Negative mood
Group [F (1,72) = 8.77, p < .01, η2p = 0.11], Time [F (1,72) = 28.79, p < .001, η2p = 0.29], Condition [F (1,72) = 19.77, p < .01, η2p = 0.22] and Sex [F (1,72) = 8.45, p < .05, η2p = 0.11] factors were significant. Furthermore, the Time × Sex [F (1,72) = 6.11, p < .05, η2p = 0.08] and Time × Condition [F (1,72) = 31.88, p < .001, η2p = 0.31] interactions were significant. As a single effect, negative mood levels of GSP participants were higher than the levels reported by non-GSP participants during the experimental session. The significant Time × Sex interaction indicated that women showed greater negative mood than men after the tasks (TSST and control) (p < .01), whereas no pre-task differences were found (p > .05). In addition, the effect of the Time × Condition interaction was based on greater negative mood expressed by participants after the TSST than before it (p < .001), whereas no time differences were observed in the control situation (p > .05). Negative mood after the TSST was higher than negative mood after the control task (p < .001). No differences in pre-task levels were found between both conditions (p > .05).
Positive mood
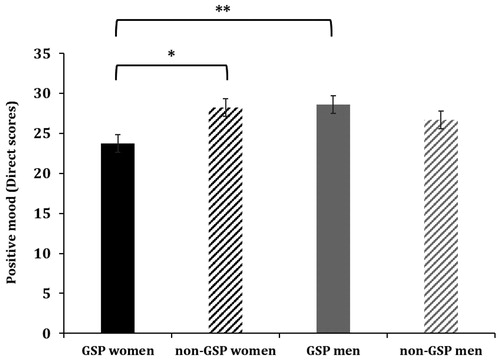
Time [F (1,72) = 17.98, p < .001, η2p = 0.20] and Condition [F (1,72) = 4.46, p < .05, η2p = 0.06] showed significant effects on positive mood. Higher positive mood was found before the tasks than after. Moreover, participants in the stress condition had lower positive mood than participants in the control condition. In addition, the Group × Sex interaction [F (1,72) = 6.55, p < .01, η2p = 0.08] showed significant effects. Women in the GSP group showed less positive mood than women in the non-GSP group (p < .05), and compared to men in the GSP group (p < .01) (). No significant differences were observed between non-GSP women and non-GSP men neither between GSP men and non-GSP women (for both p > .05).
Figure 3. Positive mood levels for GSP women (N = 20), GSP men (N = 19), non-GSP women (N = 20) and non-GSP men (N = 21). Specifically, women in the GSP group had lower positive mood than non-GSP women (*p < .05) and lower than men with GSP disorder (**p < .01). Comparisons between non-GSP women and non-GSP men were not significant, or between GSP and non-GSP men (both p > .05). Depicted values are means, and error bars represent the SEM.
Discussion
The main goal of this study was to investigate the autonomic reaction of young people with GSP-related symptoms facing a stressful task like the TSST. In addition, the psychological state of the GSP subjects before and after exposure to the stressor was evaluated, considering the possible modulating role of sex. To achieve these aims, young people were exposed to one of the two different conditions, creating four experimental groups: GSP group exposed to stress condition, GSP group in control condition, non-GSP in stress condition, and non-GSP in control condition.
No differences were found in HR or RMSDD between GSP and non-GSP groups when exposed to the stress condition. GSP people showed higher HR and lower RMSSD baseline levels at the beginning of both conditions. Our results support the hypotheses and previous findings reported in the literature. Specifically, Grossman et al. (Citation2001) did not find differences in several cardiovascular parameters (involving the time domain, such as HR, respiration rate, tidal volume, Systolic Blood Pressure (SBP), and Diastolic Blood Pressure (DBP) and in the frequency domain, R–R interval) between GSP and non-GSP subjects, due to higher cardiac baseline markers. Krämer et al. (Citation2012) found chronically higher HR in SP children compared to a healthy sample. In addition, Klumbies et al. (Citation2014) reported no differences in RMSSD when SP patients (subtype not specified) and control subjects were compared, also reporting higher baseline data for this HRV index. Taken together, these results suggest that people with a GSP diagnosis usually show the absence of cardiac response to stressful situations, due to possible ANS hyperactivity, which is reflected by higher baseline HR and lower RMSDD levels in both control and threatening situations.
However, it is worth noting that we observed a greater LF/HF ratio in the GSP group compared to the non-GSP group during TSST performance, although baseline ratio levels of GSP were higher than those of non-GSP at the beginning. This result gives us new data about ANS functioning in people with GSP. On the one hand, it implies that subjects with a GSP diagnosis may have high LF dominance over HF, representing a hyper arousal peak of sympathetic activity (not present in non-GSP subjects) when socially stressful situations are being experienced. It is well-known that the ratio of HRV frequency domains involves both ANS tracks, i.e., the sympathetic and parasympathetic systems (Reyes Del Paso et al., Citation2013), making it a more complex and integrated measure of this system than HR and RMSDD measures. On the one hand, the High Frequency (HF) spectrum (0.18–0.4 Hz) index is related to vagal activity, which involves regular patterns of HR fluctuations that are linked to the breathing cycle and modulated by the parasympathetic nervous system (Thayer & Lane, Citation2000). Complementarily, the Low Frequency (LF) spectrum (0.04–0.15 Hz) index has been interpreted as a sign of hyper arousal, appearing to be mediated by both the vagus and cardiac sympathetic nerves (Porges, Citation2007). Thus, positive ratio values (as occurred in the present study) imply that the SNS was more active that the PNS only when GSP people were exposed to the TSST, even though PNS activity and the balance between the two ANS branches always exist. Furthermore, the concurrence between ratio differences related to the GSP and non-GSP groups after TSST and higher baseline ratio levels in the stress condition seem to contradict studies that support the idea of a hyperactive ANS associated with GSP disorder. However, these studies were limited to a few HR and HRV parameters and did not include the LF/HF ratio; thus, there were no data about this measure until now. Together, these novel findings about ANS operation in GSP people can be summarized in two conclusions. First, higher HR and lower RMSSD levels in people with GSP disorder are also generalized to control situations, inhibiting their ANS reaction to threatening and arousing tasks such as the TSST, compared to safe contexts. Second, the LF/HF ratio appears to be the most sensitive parameter to evaluate the ANS of GSP people in stressful situations. For this reason, the LF/HF ratio should be studied further in relation to GSP disorder and employing another kind of stressor (e.g., academic examinations) and other sample age groups (e.g., adolescent with GSP).
Additionally, sAA levels showed differences due to the TSST (the stress condition had higher sAA levels than the control condition), as found in other studies on the sAA response to different stressors (Bosch, Citation2014; Willemsen et al., Citation2002). This conclusion implies that sAA is a valid biomarker to detect the stress response in healthy people (Bosch et al., Citation1996; Chatterton et al., Citation1996; Gyergyay et al., Citation2015; Nagy et al., Citation2015). We found similar sAA levels in both groups, i.e., GSP and non-GSP. These results agree with previous studies that reported no significant differences in sAA after the TSST when comparing non-specified SP and non-SP people (Klumbies et al., Citation2014; van Veen et al., Citation2008), or when sAA levels of SP and healthy children performing the TSST-C were compared (Krämer et al., Citation2012). Moreover, there were no differences in sAA baseline data, allowing us to conclude that sAA markers of GSP people remain stable and similar to healthy people’s levels, ruling out an sAA alteration associated with GSP disorder, at least in psychosocial stress situations, and consequently its possible use as a marker of this disorder.
Importantly, sex modulated positive mood reported by GSP people before and after any task. Specifically, GSP women showed lower positive affect compared to GSP men and non-GSP women, whereas no sex differences were observed in the non-GSP sample. Grossman et al. (Citation2001) evaluated the physiological and psychological state of GSP and SP older people before, during, and after a stressor. They observed greater anxiety, embarrassment, hostility, and total somatic complaints in socially phobic women compared to socially phobic men and control women. However, positive mood was not measured, and age played a crucial role in their results. To the best of our knowledge, this is the first study to find that sex acts as a modulator of positive feeling reported specifically by GSP participants. This result is important in clinical contexts, particularly for the diagnosis and treatment of GSP people, given that this knowledge could be a useful tool to successfully make the GSP diagnosis. Regarding the influence of sex on negative psychological state, we found significant sex differences in anxiety and negative mood, regardless of the group factor (GSP and non-GSP). On the whole, stressed women obtained higher state anxiety and negative mood than men, which is a result previously reported (Kelly et al., Citation2008; Kirschbaum et al., Citation1999; Roza et al., Citation2014; Tomova et al., Citation2014). This result suggests that changes in negative mood and anxiety in response to stress depend on sex but are nonspecific to the GSP disorder. Future research should investigate why the interaction between positive mood and sex is linked to GSP symptoms, and why the relation between negative psychological variables and sex is more generalized to other anxiety disorders, as previously reported (Bekker & Van Mens-Verhulst, Citation2007; Gater et al., Citation1998).
In our research, we analyzed psychological and ANS responses of young university students, thus obtaining data from an age range hardly studied in this specific literature. Further studies should focus on adolescents because the ‘onset age’ of the first symptoms of GSP disorder is around 15.5 years old (Burke & Stephens, Citation1999; Burstein et al., Citation2011; Faravelli et al., Citation2000). In addition, we should be aware that the GSP sample was clinically sub-diagnosed because their GSP diagnosis was made by our clinical experts just before participating in this experiment, without having been treated (clinically or pharmacologically), unlike other samples included in previous studies. Therefore, this must be taken in account when interpreting our results.
Conclusions
The present study found two relevant results related to the LF/HF ratio and sex modulation of positive mood. First, we found that this ratio was the most sensitive cardiac parameter to reflect the ANS reaction of GSP people when facing the TSST, compared to a non-GSP sample, even though the baseline ratio levels of the GSP group were higher at the beginning of this condition. Moreover, positive mood was modulated by sex specifically in the GSP group, whereas other sex differences in both negative mood and anxiety did not appear specifically related to this disorder.
Acknowledgements
This work was supported by the grants PSI2010-21343, PSI2013-46889, and PROMETEOII2015-20. The authors wish to thank Ms. Cindy DePoy for the revision of the English text.
Disclosure statement
The authors report no conflicts of interest. The authors alone are responsible for the content and writing of the paper.
Additional information
Funding
References
- American Psychiatric Association. (2013). Diagnostic and statistical manual of mental disorders. 5th ed. Washington (DC): American Psychiatric Association.
- American Psychiatric Association. (2000). Diagnostic and statistical manual of mental disorders. 4th revision ed. Washington (DC): American Psychiatric Association. p 553–7.
- Bekker MH, Van Mens-Verhulst J. (2007). Anxiety disorders: sex differences in prevalence, degree, and background, but gender-neutral treatment. Gend Med 31:178–93.
- Bosch JA. (2014). The use of saliva markers in psychobiology: mechanisms and methods. Monogr Oral Sci 24:99–108.
- Bosch JA, Brand HS, Ligtenberg TJ, Bermond B, Hoogstraten J, Nieuw Amerongen AV. (1996). Psychological stress as a determinant of protein levels and salivary-induced aggregation of Streptococcus gordonii in human whole saliva. Psychosomatic Med 58:374–82.
- Bosch JA, Ring C, De Geus EJ, Veerman EC, Amerongen AV. (2002). Stress and secretory immunity. Int Rev Neurobiol 52:213–53.
- Bosch JA, Veerman EC, De Geus EJ, Proctor GB. (2011). α-Amylase as a reliable and convenient measure of sympathetic activity: don’t start salivating just yet. Psychoneuroendocrinology 36:449–53.
- Burke RS, Stephens RS. (1999). Social anxiety and drinking in college students: a social cognitive theory analysis. Clinic Psychol Rev 19:513–30.
- Burstein M, He JP, Kattan G, Albano AM, Avenevoli S, Merikangas KR. (2011). Social phobia and subtypes in the National Comorbidity Survey–Adolescent Supplement: prevalence, correlates, and comorbidity. J Am Acad Child Adolesc Psychiatry 50:870–80.
- Chatterton RT, Vogelsong KM, Lu YC, Ellman AB, Hudgens GA. (1996). Salivary alpha-amylase as a measure of endogenous adrenergic activity. Clin Physiol 16:433–48.
- Dickerson SS, Kemeny ME. (2004). Acute stressors and cortisol responses: a theoretical integration and synthesis of laboratory research. Psychol Bull 130:355–91.
- Ditzen B, Ehlert U, Nater UM. (2014). Associations between salivary alpha-amylase and catecholamines–a multilevel modeling approach. Biol Psychol 103:15–18.
- Espin L, Almela M, Hidalgo V, et al. (2013). Acute pre-learning stress and declarative memory: impact of sex, cortisol response and menstrual cycle phase. Hormone Behav 63:759–65.
- Faravelli C, Zucchi T, Viviani B, Salmoria R, Perone A, Paionni A, Scarpato A, et al. (2000). Epidemiology of social phobia: a clinical approach. Eur Psychiatry 15:17–24.
- Friedman BH. (2007). An autonomic flexibility-neurovisceral integration model of anxiety and cardiac vagal tone. Biol Psychol 74:185–99.
- Gater R, Tansella M, Korten A, Tiemens BG, Mavreas VG, Olatawura MO. (1998). Sex differences in the prevalence and detection of depressive and anxiety disorders in general health care settings: report from the World Health Organization Collaborative Study on Psychological Problems in General Health Care. Arch Gen Psychiatry 55:405–13.
- Gyergyay R, Kovács B, Nagy E, Mártha K, Bica C, Székely M. (2015). Salivary alpha-amylase as a biomarker of dental fear and anxiety in children. Int J of Med Dent 5:77–81.
- Grossman P, Wilhelm FH, Kawachi I, Sparrow D. (2001). Gender differences in psychophysiological responses to speech stress among older social phobics: congruence and incongruence between self-evaluative and cardiovascular reactions. Psychosomatic Med 63:765–77.
- Hidalgo V, Villada C, Almela M, Espín L, Gómez-Amor J, Salvador A. (2012). Enhancing effects of acute psychosocial stress on priming of non-declarative memory in healthy young adults. Stress 15:329–38.
- Kelly MM, Tyrka AR, Anderson GM, Price LH, Carpenter LL. (2008). Sex differences in emotional and physiological responses to the Trier Social Stress Test. J Behav Ther Exp Psychiatry 39:87–98.
- Kirschbaum C, Kudielka BM, Gaab J, Schommer NC, Hellhammer DH. (1999). Impact of gender, menstrual cycle phase, and oral contraceptives on the activity of the hypothalamus-pituitary-adrenal axis. Psychosom Med 61:154–62.
- Kirschbaum C, Pirke KM, Hellhammer DH. (1993). The ‘Trier Social Stress Test’–a tool for investigating psychobiological stress responses in a laboratory setting. Neuropsychobiology 28:76–81.
- Krämer M, Seefeldt WL, Heinrichs N, Tuschen-Caffier B, Schmitz J, Wolf OT, Blechert J. (2012). Subjective, autonomic, and endocrine reactivity during social stress in children with social phobia. J Abnormal Child Psychol 40:95–104.
- Klumbies E, Braeuer D, Hoyer J, Kirschbaum C. (2014). The reaction to social stress in social phobia: discordance between physiological and subjective parameters. PLoS One 9:1–12.
- Nagy T, Van Lien R, Willemsen G, Proctor G, Efting M, Fülöp M, Bárdos G, et al. (2015). A fluid response: alpha-amylase reactions to acute laboratory stress are related to sample timing and saliva flow rate. Biol Psychol 109:111–19.
- Nater UM, Rohleder N, Gaab J, Berger S, Jud A, Kirschbaum C, Ehlert U. (2005). Human salivary alpha-amylase reactivity in a psychosocial stress paradigm. Int J Psychophysiol 55:333–42.
- Murthy VL, Naya M, Taqueti VR, Foster CR, Gaber M, Hainer J, Dorbala S, et al. (2014). Effects of gender on coronary microvascular dysfunction and cardiac outcomes. Circulation 113:1–22.
- Olivares J, García-López LJ, Hidalgo MD, Turner SM, Beidel DC. (1999). The Social Phobia and Anxiety Inventory: reliability and validity in an adolescent Spanish population. J Psychopathol Behav Assessment 21:67–78.
- Pittig A, Arch JJ, Lam CW, Craske MG. (2013). Heart rate and heart rate variability in panic, social anxiety, obsessive–compulsive, and generalized anxiety disorders at baseline and in response to relaxation and hyperventilation. Int J Psychophysiol 87:19–27.
- Porges SW. (2007). The polyvagal perspective. Biol Psychol 74:116–43.
- Pruessner JC, Kirschbaum C, Meinlschmid G, Hellhammer DH. (2003). Two formulas for computation of the area under the curve represent measures of total hormone concentration versus time-dependent change. Psychoneuroendocrinology 28:916–31.
- Reyes Del Paso GA, Langewitz W, Mulder LJ, Roon A, Duschek S. (2013). The utility of low frequency heart rate variability as an index of sympathetic cardiac tone: a review with emphasis on a reanalysis of previous studies. Psychophysiology 50:477–87.
- Rohleder N, Nater UM. (2009). Determinants of salivary α-amylase in humans and methodological considerations. Psychoneuroendocrinology 34:469–85.
- Roza SJ, Hofstra MB, Van Der Ende J, Verhulst FC. (2014). Stable prediction of mood and anxiety disorders based on behavioral and emotional problems in childhood: a 14-year follow-up during childhood, adolescence, and young adulthood. Am J Psychiatr 160:2116–21.
- Seisdedos N. (1988). Adaptación española del STAI, cuestionario de ansiedad estado-rasgo [spanish adaptation of the STAI, state-trait anxiety inventory]. Madrid: TEA Ediciones.
- Spielberger CD. (2010). State‐Trait anxiety inventory. New York: John Wiley & Sons, Ltd.
- Task Force of the European Society of Cardiology. (1996). Heart rate variability standards of measurement, physiological interpretation, and clinical use. Eur Heart J 17:354–81.
- Thayer JF, Lane RD. (2000). A model of neurovisceral integration in emotion regulation and dysregulation. J Affect Disord 61:201–16.
- Tomova L, Von Dawans B, Heinrichs M, Silani G, Lamm C. (2014). Is stress affecting our ability to tune into others? Evidence for gender differences in the effects of stress on self-other distinction. Psychoneuroendocrinology 43:95–104.
- Turner SM, Beidel DC. (1989). Social phobia: Clinical syndrome, diagnosis, and comorbidity. Clinic Psychol Rev 9:3–18.
- Van Veen JF, Van Vliet IM, DeRijk RH, Van Pelt J, Mertens B, Zitman FG. (2008). Elevated alpha-amylase but not cortisol in generalized social anxiety disorder. Psychoneuroendocrinology 33:1313–21.
- Watson D, Clark LA, Tellegen A. (1988). Development and validation of brief measures of positive and negative affect: the PANAS scales. J Personal Soc Psychol 54:1063.
- Willemsen GH, Carroll D, Ring C, Drayson M. (2002). Cellular and mucosal immune reactions to mental and cold stress: associations with gender and cardiovascular reactivity. Psychophysiology 39:222–8.