
Abstract
Anhedonia is a core symptom of social defeat stress (SDS)-induced depression associated with the reward system. We previously reported that decreased membrane-bound AMPA-GluR1 in the reward system is associated with lipopolysaccharide-induced anhedonia-like symptoms. Since group I metabotropic glutamate receptor (mGluR) activation reduces the surface density of GluR1, we examined whether group I mGluR-dependent decrease in membrane-bound GluR1 in the reward system is involved in SDS-induced anhedonia-like symptoms. Mice exposed to SDS for 4 consecutive days had markedly decreased membrane-bound GluR1 and GluR2 in the prefrontal cortex (PFC) and membrane-bound GluR1 in the ventral midbrain (VM) along with lower sucrose preference (SP). Intra-PFC injection of the group I mGluR agonist (S)-3,5-dihydroxyphenylglycine (DHPG; 100 μmol) demonstrated decrease in membrane-bound GluR1 and GluR2 in the PFC 2 and 24 h and membrane-bound GluR1 in the VM 24 h after injection. Moreover, intra-PFC injection of DHPG decreased SP only in the second 24-h (24–48 h) period. Conversely, intra-VM injection of DHPG decreased SP in both the first and second 24-h period and decreased membrane-bound GluR1 in the VM 2 and 24 h after injection. Pre-treatment with the mGluR1 antagonist JNJ16259685 (30 mg/kg, subcutaneous) prevented SDS-decreased SP and membrane-bound GluR1 in the VM. The mGluR5 antagonist 2-methyl-6-(phenylethynyl)pyridine (MPEP; 10 mg/kg, subcutaneous) prevented SDS-induced decrease in membrane-bound GluR1 and GluR2 in the PFC, whereas MPEP did not affect SDS-induced decrease in SP and membrane-bound GluR1 in the VM. These results suggest that mGluR1-mediated decrease in membrane-bound GluR1 in VM is involved in SDS-induced anhedonia-like symptoms.
Introduction
Various features of major depression (MD) reflect the dysregulation of the stress response (Gold & Chrousos, Citation2002). Indeed, epidemiological studies have revealed a strong correlation between stressful events and depressive episodes (Caspi et al., Citation2003). In society, victims of bullying in school or workplace suffer from depression, anxiety, and other behavioral symptoms (Bjorkqvist, Citation2001). Mice exposed to social defeat stress (SDS) have been used as an alternative animal model for studying human depression caused by bullying. Decreased sucrose preference, an anhedonia-like symptom, and increased anxiety were observed in mice following SDS for 2–4 consecutive days (Crawford, Rahman, & Beck, Citation2013), whereas behavioral despair was not observed in mice following SDS for 6 consecutive days (Kinsey, Bailey, Sheridan, Padgett, & Avitsur, Citation2007). Therefore, the neural mechanism of SDS-induced anhedonia may be independent of that of behavioral despair and is not well understood.
Stress-induced anhedonia-like symptoms have been suggested to be caused by alterations in the reward system (Nestler & Carlezon, Citation2006). However, the mechanism by which dopaminergic neurons in the ventral tegmental area (VTA) contribute to SDS-induced anhedonia-like symptoms remains controversial. Stress has been suggested to decrease the firing rate of dopaminergic neurons projecting to the PFC, whereas neurons projecting to the nucleus accumbens (NAc) exhibit increased firing rate after stress in mice (Chaudhury et al., Citation2013). A recent microdialysis study revealed that the stress-induced increase in cocaine-seeking behavior in mice could be associated with escalated dopaminergic responses in the NAc shell (Han et al., Citation2015). On the other hand, an optogenetic study revealed that the stimulation of VTA dopaminergic neurons can reverse the stress-induced decrease in sucrose preference in mice (Tye et al., Citation2013). Therefore, it is important to examine these discrepancies to understand the role of the reward system in stress-induced anhedonia-like symptoms.
Stressors may alter the dynamic balance between increases and decreases in synaptic connectivity (Kim & Yoon, Citation1998). The PFC network, composed of the PFC and its associated brain regions, amygdala, hippocampus, and VTA, is important for regulating the stress responses in either animal models (Audet, Jacobson-Pick, Wann, & Anisman, Citation2011) or MD (Arnsten, Citation2009). We previously reported that lipopolysaccharides (LPS) can induce both anhedonia-like symptoms and behavioral despair and are associated with decrease in membrane-bound AMPA-GluR1 in the PFC and VTA, thus indicating the possibility that the decreased synaptic efficacy in the PFC or VTA is involved in depressive-like symptoms (Sekio & Seki, Citation2014). Long-term synaptic depression (LTD) in the reward system can be caused by the activation of group 1 metabotropic glutamate receptor (mGluR) (Luscher & Huber, Citation2010). However, the relationship between SDS and mGluR-dependent LTD is unclear. Interestingly, SDS in mice increase drug self-administration (Han et al., Citation2015), but decrease sucrose preference (Iniguez et al., Citation2014), indicating that the neurochemical changes are different between SDS and drug abuse.
Therefore, we examined whether decreased membrane-bound AMPA-GluR1 protein level in the reward system can be induced by SDS. Moreover, we investigated whether mGluR activation contributes to SDS-induced anhedonia-like symptoms.
Materials and methods
Chemicals and antibodies
A potent and selective mGluR5 antagonist, 2-methyl-6-(phenylethynyl)pyridine (MPEP) hydrochloride (#131-15471), was purchased from Wako Pure Chemical Industries, Ltd. (Tokyo, Japan) and was dissolved in a vehicle consisting of .9% w/v NaCl (saline). A noncompetitive antagonist of mGluR-1, JNJ 16259685 (sc-202670), was purchased from Santa Cruz Biotechnology, Inc. (Dallas, TX) and was dissolved in a vehicle consisting of 10% hydroxypropyl-β-cyclodextrin acidified with tartaric acid. The selective group I mGluR agonist (R,S)-3,5-dihydroxyphenylglycine (DHPG), rabbit monoclonal anti-GluR1 antibody for western blot (ab32436, 1:1000) (Plaza-Zabala et al., Citation2013), and rabbit monoclonal anti-GluR2 antibody for western blot (ab52932, 1:1000) (Gascon et al., Citation2014) were purchased from Abcam (Cambridge, UK). The rabbit polyclonal antibody against Na,K-ATPase (#3010 S, 1:1000 for western blot) and the rabbit monoclonal antibody against β-actin (D6A8) (#8457, 1:1000 for western blot) were purchased from Cell Signaling Technology (Danvers, MA).
Ethics statement, animal care, and drug administration
This study was approved by the Animal Care Committee of Ohu University (No. 2015-45 and 2016-29). All animal procedures were performed in accordance with the guidelines of the Animal Care Committee of Ohu University. Special care was taken to reduce animal distress and to use the minimum number of animals needed for all studies. The CD1 mice for SDS experiments (male; 7 weeks old) and for social isolation (SI; male; 3 weeks old), and other mice for guide cannula implantation (male; 6 weeks old) were supplied by Charles River Laboratories Japan, Inc. (Yokohama, Japan). All mice were housed at 25 ± 2 °C on a 12-h light (08:00–20:00)/12-h dark (20:00–08:00) cycle with ad libitum access to food and water. Mice were housed in cages under normal conditions (five mice per cage) and handled individually every day for the 7 days before behavioral tests. The mice that were selected to have a guide cannula implanted into the skull were handled individually once daily for the 3 days before surgery, and then twice daily during the 4 days after anesthesia recovery to the date of behavioral tests.
Repeated SDS
The “resident-intruder” paradigm was performed to mimic social defeat. Since long-term social isolated (SI) mice exhibit the territorial aggressive behavior against the nonresident mouse, we used SI mice as resident mice. Group-housed mice were used as intruder mice to introduce as a social defeat model. The mice were 8 weeks old when the resident-intruder paradigm was performed and had been housed individually for 4 weeks in our facility (social isolation was performed when the mice were 4 weeks old). The male intruder mice for SDS were 8 weeks old (the same age as the resident SI mice). The home cage of resident SI mice (SI mouse cage) was used to induce SDS with the food/water bin removed and the light on at 40 lux illumination. Unfamiliar group-housed intruder mice for SDS were housed in groups of five mice and were placed with SI mouse in the SI mouse cage to induce SDS between 10:00 and 12:00. SI mice were then removed from the SI mouse cage after 10 min of SDS, and intruder SDS mice were kept in the SI mouse cage for another 50 min. This pattern of SDS exposure was repeated for 4 consecutive days. The behavior of the mice was digitally videotaped. During each cycle, signs representing aggression, such as an initial pattern of exploratory activity around the intruder SDS mouse followed by rearing and tail rattling, accompanied by wrestling and/or a violent biting attack, were observed to ensure defeat of the intruder SDS mouse. If a resident mouse did not initiate an attack within 5–10 min or was attacked by any of the intruder mice, another resident mouse was used. At the end of the 60-min period, the intruder SDS mouse was returned to its home cage, and the resident mouse was returned to the SI mouse cage and left undisturbed until the following day when the protocol was repeated. Different resident mice were used on each day during the 4 consecutive days of SDS.
Measurement of locomotor activity
All locomotor activity tests were carried out and analyzed by investigators who were blinded to the group assignments. The tests were performed during the light phase (12:00–14:00) of the light-dark cycle. Locomotor activity was measured for 5 min by placing a mouse in the center of an acrylic plastic open-field box arena (W: 294 mm × D: 294 mm × H: 297 mm) illuminated with a light bulb (40 lux). The floor of the test box was divided into four squares. The bottom and four inner walls of the box were covered by nonreflective paper. Each mouse was habituated to the arena of the test box for 5 min (24 h prior to the test). Mice were placed in the center of the open field and recorded using a digital video camera in the absence of an investigator. Activity was scored as a line crossing when a mouse removed all four paws from one square and entered another. Data were analyzed and scored by another investigator blinded to the allocated group.
Sucrose preference test
Different groups of mice were used for the sucrose preference tests from mice which were subjected to the locomotor activity test, because the unfamiliar test box for the open field test may affect the sucrose preference test. All sucrose preference tests were carried out and analyzed by investigators who were blinded to the group assignments. Sucrose preference was evaluated using a two-bottle free-choice paradigm. The tested SI mice and group-housed mice (8 weeks old) were previously habituated in a test cage for sucrose preference; the mice were individually housed for 24 h with access to two identical drinking bottles that contained either 5% sucrose solution or normal sterilized distilled water before the test. To avoid any side bias during the test, the locations of the two drinking bottles were switched 12 h after the start of the test. To evaluate the extent of anhedonia-like symptoms, we expressed the sucrose preference of the mice as the percentage of 5% sucrose water intake relative to total water intake in 24 h. In the experiment of DHPG- or artificial cerebrospinal fluid (aCSF)-injected mice (see described below), different groups of animals were used in the sucrose preference test in the first 24-h (0–24 h) and the second 24-h (24–48 h) period after DHPG or aCSF injection. Data were analyzed and scored by another investigator blinded to the allocated group.
Guide cannula implantation and local drug administration
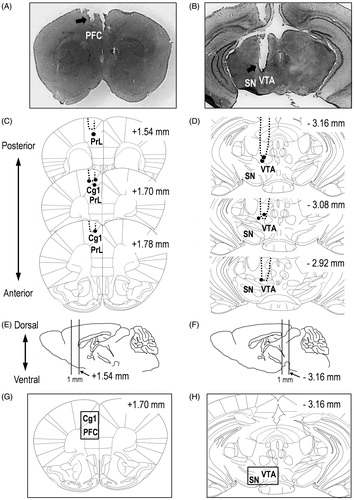
Male mice (7 weeks old) were anesthetized with a mixture of medetomidine hydrochloride and butorphanol tartrate (.3 mg/kg and 5 mg/kg, respectively; Wako Pure Chemical Industries, Ltd., Tokyo, Japan) and midazolam (4 mg/kg, Sandoz, Ltd., Yamagata, Japan), and they were placed in a stereotactic frame. Three holes in the skull were made using a dentist drill. One hole was used for placement of a steel guide cannula (AG-4 or 8; I.D. = .4 mm; O.D. = .5 mm; Eicom, Kyoto, Japan), and the other two holes were made to anchor the stabilizing screws. For unilaterally aCSF or DHPG injection, the stereotaxic coordinates (in mm), according to the Paxinos mouse brain atlas (Paxinos & Franklin, Citation2007), were as follows: for intra-PFC injection (.25 mm dorsal side of the pre-limbic cortex (PrL) containing the cingulate cortex (Cg1), a compositions of the PFC, anteroposterior (AP): +1.70, lateral (L): −.5, depth (DV): −1.0; for intra-ventral midbrain (VM) injection (.25 mm dorsal side of the VTA, a center of the VM in the present study), AP: −3.08, L: −.6, DV: −4.1. Coordinates refer to the bregma and the dura surface ()). The cannula was held in position by dental cement (GC Unifast II; GC Dental Products Corp., Tokyo, Japan) attached to the stabilizing screw. The dummy cannula (AD-4 or 8; Eicom, Kyoto, Japan) was inserted into the guide cannula and fixed with cap nuts (AC-1; Eicom, Kyoto, Japan) until behavioral experiments. After waking from anesthesia, each mouse was caged individually until drug-induced behavioral assessment. Guide cannula-implanted mice were handled individually once daily for 4 days prior to surgery, and then twice daily during the 6 days after anesthesia recovery until behavioral tests were performed. The drug was dissolved in aCSF (150 mM NaCl, 3 mM KCl, 1.4 mM CaCl2, .8 mM MgCl2, and 1.0 mM Na2HPO4). For the PFC and VM, .5 μL of the drug solution was infused (1 μL/min) using an Eicom cannula swivel unit (SSU-20; Eicom, Kyoto, Japan) attached to an injector and a 25-μL Hamilton syringe. A dialysis probe was used for drug infusion, and the tip (the dialysis membrane part, A-I-4-02 or A-I-8-02, O.D. = .35 mm, Eicom, Kyoto, Japan) was cut. A polytetrafluoroethylene coiling tube (CT-20; Eicom, Kyoto, Japan) was used to infuse aCSF or 100 μmol of DHPG, and the mouse was allowed to move freely during drug infusion in the home cage. After drug injection, the injection probe was maintained in place for at least 5 min to prevent the drug from leaking out of the guide cannula. The drug was infused 30 min prior to behavioral tests. The probe was removed 5 min after drug injection, and each mouse was kept in the home cage until behavioral tests.
Figure 1. (A, B) Photomicrograph of placement of the guide cannula in the PFC (A) and VM (B) of Mayer's hematoxylin-stained tissue sections. (C, D) Schematic drawing of the histological reconstruction of coronal sections from the PFC (A), containing the prelimbic cortex (PrL) and cingulate cortex (Cg1) and VM (B). Black dots indicate the approximate guide cannula placement. The numbers on the right upper side of the drawings indicate the distance (in mm) anterior (+) and posterior (−) to the bregma. (E, F) Drawings of the mouse sagittal sections. (G, H) The numbers under the drawings indicate the location of the right side of the two lines harvested for western blotting. Each square on the drawings of the coronal sections (in accordance with E and F) indicates the location of the tissue harvested for western blotting.
Verification of guide cannula placement
Histological verification of cannula placements in the PFC and VM for drug microinjection following the experiments was performed using ice-cold .1 M PBS for 15 min, followed by filtered 4% paraformaldehyde (PFA) in ice-cold .1 M PBS for 15 min. The brains were removed and further post-fixed in filtered 4% PFA for at least 24 h, followed by 30% sucrose at 4 °C for at least 48 h. Then, 40-μm-thick sections were cut from the frozen brain block using a cryostat at −15 °C (Leica CM1100; Leica Biosystems, Nussloch, Germany) and mounted on poly-l-lysine-coated glass slides (#S7441; Matsunami Glass Ind., Ltd., Osaka, Japan). The sections were incubated with Mayer's Hematoxylin Solution (#131-09665; Wako Pure Chemical Industries, Ltd., Tokyo, Japan) for 5 min at room temperature (25 ± 2 °C) after washing with PBS for 5 min. Then, the hematoxylin stained sections were washed with 50 °C water for 5 min. Images were obtained with Digital Microscope 8-LED USB Digital Microscope Endoscope Magnifier Camera (FB-CMXW02; Koolertron, Shenzhen, China) and captured with Micro Capture Pro (Celestron, LLC., Torrance, CA). Probe placements were verified by adapting the Paxinos mouse brain atlas (Paxinos G, 2007) for the PFC and VM ( for PFC; for VM). Mice with misplaced cannula were excluded from statistical analysis.
Tissue harvesting and plasma membrane extraction
Another group of animals was used for western blot analysis to avoid the effect of an unfamiliar environment on locomotor activity test or sucrose intake. Male SDS and its control mice (8 weeks old) were euthanized to prepare samples from the PFC and VM for western blotting. Brain samples from SDS mice were obtained 2 h after the final SDS, and the samples from DHPG-treated mice were obtained 2 and 24 h after DHPG injection. Approximately 1-mm-thick coronal sections containing the regions of the drug-injection which were adapted from the Paxinos mouse brain atlas were cut (Paxinos & Franklin, Citation2007) ( for PFC; for VM). The method for extraction of the plasma membrane fraction was performed as described previously (Ohtake, Saito, Eto, & Seki, Citation2014; Sekio & Seki, Citation2014). The plasma membrane fraction of each sample of interest was extracted using a commercially available plasma membrane extraction kit (BioVision, Inc., Milpitas, CA). Phosphatase inhibitor (Roche Applied Science, Penzberg, Germany) and protease inhibitor (BioVision, Inc.) cocktails were added to the P1 buffers before the brain tissue was homogenized. Mouse cortical tissues were douncehomogenized in P1 buffer and centrifuged (700 × g for 10 min at 4 °C) to yield the post-nuclear supernatant fraction. Post-nuclear supernatant was centrifuged at 10,000 × g for 30 min at 4 °C to yield the cytosolic supernatant and the total cellular membrane fraction in the pellet, including a mix of the plasma membrane and cellular organelle membranes. To separate the plasma membrane fraction from the cellular organelle membranes, the total cellular membrane fraction was resuspended with upper phase solution (supplied in the kit) and then mixed with the lower phase solution (supplied in the kit). After incubating the mixture on ice for 5 min, it was centrifuged at 1000 × g for 5 min, and the upper phase solution was removed and placed on ice. To maximize the yield, the lower phase solution was mixed with the upper phase solution again and centrifuged at 1000 × g for 5 min. This step was repeated three times and the upper phase solution from each step were combined. The combined upper phase solutions were diluted with 5 volumes of water and centrifuged at 14,000 × g for 10 min at 4 °C. The pellet was collected as the plasma membrane protein. To extract the plasma membrane fraction, a commercial plasma membrane extraction kit was used. To demonstrate the quality of each fraction prepared from homogenates which were derived from the plasma membrane extraction kit, samples of the fractions were subjected to immunoblot analysis of plasma membrane and cytosolic protein markers. The fidelity of these fractions was validated by the near absence of the plasma membrane proteins (Na+/K+ ATPase) in the cytosolic fraction and the absence of the cytosolic protein (β actin) in the plasma membrane fraction. To confirm whether the post-synaptic proteins were collected with the plasma membrane fraction, the existence of post-synaptic density protein-95 (PSD-95) in the plasma membrane fraction and the near absence of PSD-95 in the cytosolic fractions were verified by immunoblotting with anti-PSD-95 antibody ().
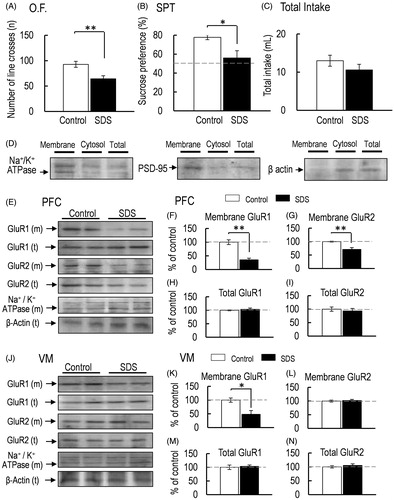
Figure 2. (A) Locomotor activity was measured 2 h after the final SDS exposure (O.F.: control, n = 5; SDS, n = 5). (B, C) Sucrose preference test (SPT: B) and total intake (C) (control, n = 5; SDS, n = 5). (D) Representative western blot of membrane and total GluR1 and GluR2 in the PFC 2 h after the final SDS exposure. (E–H) Representative graphs of the protein level of membrane GluR1 (E, control, n = 5; SDS, n = 5), membrane GluR2 (F, control, n = 5; SDS, n = 5), total GluR1 (G: control, n = 5; SDS, n = 5), and total GluR2 (H, control, n = 5; SDS, n = 5) in the PFC. (I) Representative western blot of membrane and total GluR1 and GluR2 in the VM 2 h after the final SDS exposure. (J–M) Representative graphs of the protein level of membrane GluR1 (J, control, n = 5; SDS, n = 5), membrane GluR2 (K, control, n = 5; SDS, n = 5), total GluR1 (L, control, n = 5; SDS, n = 5), and total GluR2 (M, control, n = 5; SDS, n = 5) in the VM. All data are presented as the mean ± SEM. **p < .01, *p < .05.
Western blotting
Western blot analysis was performed as described previously (Ohtake et al., Citation2014; Sekio & Seki, Citation2014). Briefly, protein extracts were mixed with a sample buffer containing 50 mM Tris-HCl (pH 7.6), 2% SDS, 10% glycerol, 10 mM dithiothreitol, and .2% bromophenol blue and boiled at 94 °C for 5 min. Each sample was assessed in duplicate, and the average value was calculated for each sample. The samples were separated by sodium dodecyl sulfate-polyacrylamide gel electrophoresis (SDS-PAGE) in 8–10% gels and transferred onto polyvinylidene fluoride (PVDF) membranes. The blots were detected (PerkinElmer, Inc., Waltham, MA) and visualized using the VersaDoc imaging system (Model 5000; BioRad, Hercules, CA). Protein bands were quantitatively analyzed using ImageJ software (Version 1.48a; Wayne Rasband (NIH), Bethesda, MD). Protein levels were normalized by the corresponding total Na+/K+ ATPase level for plasma membrane protein and β-actin levels for the total protein extract.
Statistical analysis
Comparisons with unpaired t-test were carried out (). One-way analysis of variance (ANOVA) was performed as appropriate (). After ANOVA, the Bonferroni correction for multiple testing was used to compare two independent groups. All statistical analyzes were performed using StatView (Version 5.0; SAS Institute Inc., San Francisco, CA). All data in the bars indicate the mean ± SEM. The levels of significance for all analyzes were set at p < .01 (**) or p < .05 (*). Cohen’s d (|d|) was used in unpaired t-tests, which corresponds to what are generally regarded as small, medium, large, and very large effects in mouse neurobehavioral genetic studies: small effect, |d| ≤ .5; medium/moderate effect, .5 < |d| < 1.0; large effect, 1.0 ≤ |d| < 1.5; very large effect, |d| ≥ 1.5 (Colquhoun, Citation2014). Partial eta-squared () effect sizes were calculated for one-way ANOVA and indicate the magnitude of observed effects. We used the following cutoffs for the
effect size coefficients: small effect,
≤ .03; medium/moderate effect, .03 <
< .10; large effect, .10 ≤
< .20; very large effect,
≥ .20 (Labots, Laarakker, Ohl, & van Lith, Citation2016).
Figure 3. (A) Representative western blot of membrane and total GluR1 and GluR2 in the PFC 2 and 24 h after intra-PFC injection of aCSF or DHPG. (B–E) Representative graphs of the protein level of membrane GluR1 (B, control, n = 5; DHPG 2 h, n = 5; DHPG 24 h, n = 5), membrane GluR2 (C, control, n = 5; DHPG 2 h, n = 5; DHPG 24 h, n = 5), total GluR1 (D, control, n = 5; DHPG 2 h, n = 5; DHPG 24 h, n = 5), and total GluR2 (E, control, n = 5; DHPG 2 h, n = 5; DHPG 24 h, n = 5) in the PFC. (F) Representative western blot of membrane and total GluR1 and GluR2 in the VM 2 and 24 h after intra-PFC injection of aCSF or DHPG. (G–J) Representative graphs of the protein level of membrane GluR1 (G, control, n = 5; DHPG 2 h, n = 5; DHPG 24 h, n = 5) and membrane GluR2 (H, control, n = 5; DHPG 2 h, n = 5; DHPG 24 h, n = 5), total GluR1 (I, control, n = 5; DHPG 2 h, n = 5; DHPG 24 h, n = 5), and total GluR2 (J, control, n = 5, DHPG 2 h, n = 5; DHPG 24 h, n = 5) in the VM. (K). Locomotor activity was measured 2 and 24 h after intra-PFC injection of aCSF or DHPG (O.F.: control, n = 6; DHPG 2 h, n = 10; DHPG 24 h, n = 5). (L, M) Sucrose preference test (SPT: L) and total intake (M) were measured 2 and 24 after intra-PFC injection of aCSF or DHPG for the first 24-h (0–24 h) and the second 24-h (24–48 h) period (control, n = 5; DHPG 24 h, n = 5). All data are presented as the mean ± SEM. **p < .01, *p < .05.
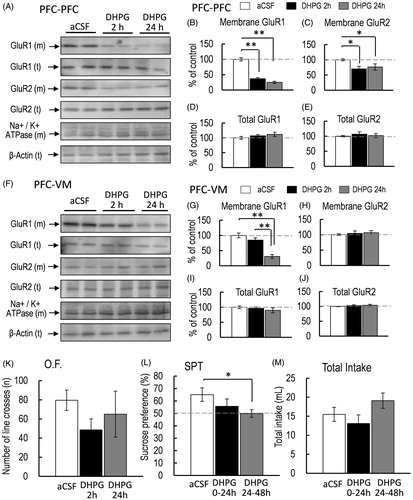
Figure 4. (A) Representative western blot of membrane and total GluR1 and GluR2 in the PFC 2 and 24 h after intra-VM injection of aCSF or DHPG. (B–E) Representative graphs of the protein level of membrane GluR1 (B, control, n = 5; DHPG 2 h, n = 5; DHPG 24 h, n = 5), membrane GluR2 (C, control, n = 5; DHPG 2 h, n = 5; DHPG 24 h, n = 5), total GluR1 (D, control, n = 5; DHPG 2 h, n = 5; DHPG 24 h, n = 5), and total GluR2 (E, control, n = 5; DHPG 2 h, n = 5; DHPG 24 h, n = 5) in the PFC. (F) Representative western blot of membrane and total GluR1 and GluR2 in the VM 2 and 24 h after intra-VM injection of aCSF or DHPG. (G–J) Representative graphs of the protein level of membrane GluR1 (G, control, n = 5; DHPG 2 h, n = 5; DHPG 24 h, n = 5), membrane GluR2 (H, control, n = 5; DHPG 2 h, n = 5; DHPG 24 h, n = 5), total GluR1 (I, control, n = 5; DHPG 2 h, n = 5; DHPG 24 h, n = 5), and total GluR2 (J, control, n = 5; DHPG 2 h, n = 5; DHPG 24 h, n = 5) in the VM. (K) Locomotor activity was measured 2 and 24 h after intra-VM injection of aCSF or DHPG (K, O.F.: control, n = 5; DHPG 2 h, n = 5; DHPG 24 h, n = 5). (L, M) Sucrose preference test (SPT: L) and total intake (M) were measured 2 and 24 h after intra-VM injection of aCSF or DHPG for the first 24-h (0–24 h) and the second 24-h (24–48 h) period (control, n = 6; DHPG 2 h, n = 8; DHPG 24 h, n = 6). All data are presented as the mean ± SEM. **p < .01, *p < .05.
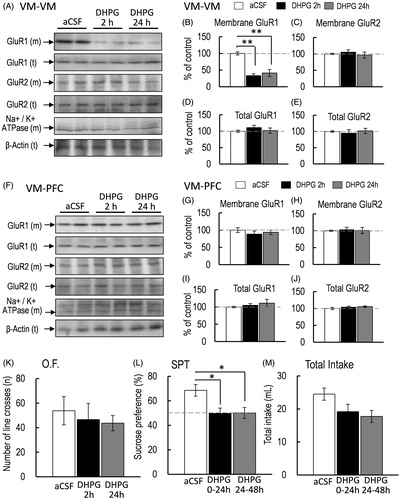
Figure 5. Effect of JNJ16259685 pretreatment on SDS mice. (A–C) The effects on the locomotor activity (A, O.F.: control-saline, n = 5; control-JNJ16259685, n = 5; SDS-saline, n = 5; SDS-JNJ16259685, n = 5), and sucrose preference test (SPT: B) and total intake (C) (control-saline, n = 5; control-JNJ16259685, n = 5; SDS-saline, n = 5; SDS-JNJ16259685, n = 5) of mice were measured for 24 h. (D, I) Representative western blot of membrane and total GluR1 and GluR2 in the PFC 2 h after the final SDS exposure. (E–H, J–M) Representative graphs of the protein level of membrane GluR1 (E, control-saline, n = 4, control-JNJ16259685, n = 4; J, control-saline, n = 5; SDS-saline, n = 5; SDS-JNJ16259685, n = 5), membrane GluR2 (F, control-saline, n = 4, control-JNJ16259685, n = 4; K, control-saline, n = 5; SDS-saline, n = 5; SDS-JNJ16259685, n = 5), total GluR1 (G, control-saline, n = 4, control-JNJ16259685, n = 4; L, control-saline, n = 5; SDS-saline, n = 5; SDS-JNJ16259685, n = 5) and total GluR2 (H, control-saline, n = 4, control-JNJ16259685, n = 4; M, control-saline, n = 5; SDS-saline, n = 5; SDS-JNJ16259685, n = 5) in the PFC. (N, S) Representative western blot of membrane and total GluR1 and GluR2 in the VM 2 h after the final SDS exposure. (O–R, T–W) Representative graphs of the protein level of membrane GluR1 (O, control-saline, n = 4, control-JNJ16259685, n = 4; T, control-saline, n = 5; SDS-saline, n = 5; SDS-JNJ16259685, n = 5), membrane GluR2 (P, control-saline, n = 4, control-JNJ16259685, n = 4; U, control-saline, n = 5; SDS-saline, n = 5; SDS-JNJ16259685, n = 5), total GluR1 (Q, control-saline, n = 4, control-JNJ16259685, n = 4; V, control-saline, n = 5; SDS-saline, n = 5; SDS-JNJ16259685, n = 5), and total GluR2 (R, control-saline, n = 4, control-JNJ16259685, n = 4; W, control-saline, n = 5; SDS-saline, n = 5; SDS-JNJ16259685, n = 5) in the VM. All data are presented as the mean ± SEM. **p < .01, *p < .05.
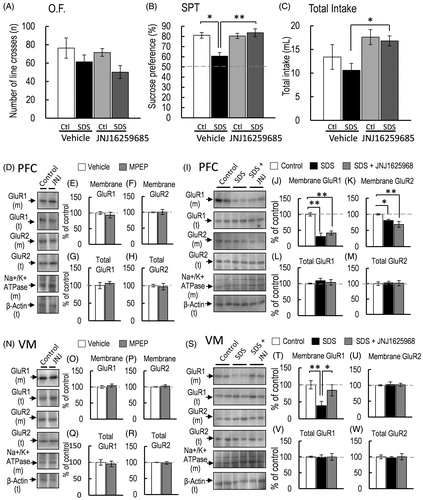
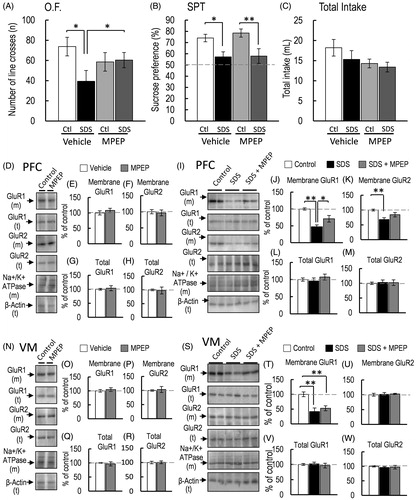
Figure 6. Effect of MPEP pretreatment on SDS mice. (A–C) The effects on the locomotor activity (A, O.F.: control-saline, n = 5; control-MPEP, n = 5; SDS-saline, n = 5; SDS-MPEP, n = 5), and sucrose preference test (SPT: B) and total intake (C) (control-saline, n = 5; control-MPEP, n = 5; SDS-saline, n = 5; SDS-MPEP, n = 5) of mice were measured for 24 h. (D) Representative western blot of membrane and total GluR1 and GluR2 in the PFC 2 h after the final SDS exposure. (E–H, J–M) Representative graphs of the protein level of membrane GluR1 (E, control-saline, n = 4, control-MPEP, n = 4; J, control-saline, n = 5; SDS-MPEP, n = 5; SDS-JNJ16259685, n = 5), membrane GluR2 (F, control-saline, n = 4, control-MPEP, n = 4; K, control-saline, n = 5; SDS-saline, n = 5; SDS-MPEP, n = 5), total GluR1 (G, control-saline, n = 4, control-MPEP, n = 4; L, control-saline, n = 5; SDS-saline, n = 5; SDS-MPEP, n = 5) and total GluR2 (H, control-saline, n = 4, control-MPEP, n = 4; M, control-saline, n = 5; SDS-saline, n = 5; SDS-MPEP, n = 5) in the PFC. (N, S) Representative western blot of membrane and total GluR1 and GluR2 in the VM 2 h after the final SDS exposure. (O–R, T–W) Representative graphs of the protein level of membrane GluR1 (O, control-saline, n = 4, control-MPEP, n = 4; T, control-saline, n = 5; SDS-saline, n = 5; SDS-MPEP, n = 5), membrane GluR2 (P, control-saline, n = 4, control-MPEP, n = 4; U, control-saline, n = 5; SDS-saline, n = 5; SDS-MPEP, n = 5), total GluR1 (Q, control-saline, n = 4, control-MPEP, n = 4; V, control-saline, n = 5; SDS-saline, n = 5; SDS-MPEP, n = 5), and total GluR2 (R, control-saline, n = 4, control-MPEP, n = 4; W, control-saline, n = 5; SDS-saline, n = 5; SDS-MPEP, n = 5) in the VM. All data are presented as the mean ± SEM. **p < .01, *p < .05.
Results
SDS-induced anhedonia-like symptoms and decrease in the protein level of membrane-bound AMPA receptor GluR1 subunit in the PFC and VM
Locomotor activity in mice was significantly decreased after 4 consecutive days of SDS [p = .009, d = 2.130; ]. Sucrose preference was also significantly decreased in SDS mice compared with nonSDS control mice [p = .026, d = .657; ]. On the other hand, total intake was similar between control and SDS mice [p = .278, d = 4.292; ]. Therefore, 4 consecutive days of SDS exposure elicited anhedonia-like symptoms in mice. In SDS mice, the protein level of membrane-bound AMPA-GluR1 subunit in the PFC and VM was also significantly decreased after 4 consecutive days of SDS [PFC, p < .001, d = 4.798; ; VM, p = .0301, d = 1.6640; ]. In addition, the protein level of the membrane-bound GluR2 subunit was also decreased in the PFC of SDS mice [p = .004, d = 2.517; ]. However, the protein level of the membrane-bound GluR2 subunit in the VM of SDS mice was similar to that in the VM of control mice [p = .477, d = −.471; ]. On the other hand, the total protein levels of GluR1 and GluR2 in either the PFC or VM were not affected by SDS [total GluR1 in PFC, p = .537, d = −.407; ; total GluR2 in PFC, p = .851, d = .122; ; total GluR1 in VM, p = .430, d = −.524; ; total GluR2 in VM, p = .594, d = −.350; ].
Effect of DHPG injection in the PFC on membrane-bound GluR1 protein level in the PFC and VM and sucrose preference
Although the decreased membrane-bound GluR1 subunit protein level in the PFC and VM in SDS mice was associated with anhedonia-like symptoms, it is unclear whether decreased membrane-bound GluR1 in the PFC and VM is critical for inducing anhedonia-like symptoms. Group I mGluR stimulation can cause the internalization of AMPA receptors, which can reduce the cell surface protein level of GluR1 in neurons (Gladding et al., Citation2009). Therefore, we injected the intra-PFC of awake mice with DHPG (.5 μL, 100 μmol). One-way ANOVA revealed that intra-PFC injection of DHPG significantly affected the protein level of membrane-bound GluR1 in the PFC [F(2, 12) = 39.244, p < .001, = .867; ]. Bonferroni post-hoc test indicated that membrane-bound GluR1 protein level in the PFC of DHPG-injected mice was significantly reduced 2 and 24 h after intra-PFC injection compared with that in the PFC of aCSF-injected control mice [aCSF vs. DHPG 2 h, p < .001; aCSF vs. DHPG 24 h, p < .001; ]. Interestingly, intra-PFC injection of DHPG also affected the protein level of membrane-bound GluR1 in the VM [F(2, 12) = 25.951, p < .001,
= .812; ]. Bonferroni post-hoc test revealed that the protein level of membrane-bound GluR1 in the VM was significantly decreased 24 h after intra-PFC injection of DHPG. However, membrane-bound GluR1 protein level in the VM of DHPG-injected mice 2 h after intra-PFC injection was not significantly different from that in the VM of aCSF-injected mice [aCSF vs. DHPG 2 h, p = .156; aCSF vs. DHPG 24 h, p < .001; ]. Moreover, membrane-bound GluR2 protein level in the PFC of mice with intra-PFC injection of DHPG was also significantly affected [F(2, 12) = 4.908, p = .027,
= .449; ]. Bonferroni post-hoc test revealed that membrane-bound GluR2 protein level in the PFC (2 and 24 h after intra-PFC injection of DHPG) was also significantly decreased [aCSF vs. DHPG 2 h, p = .014; aCSF vs. DHPG 24 h, p = .026; ]. However, the protein level of membrane-bound GluR2 in the VM was not affected [F(2, 12) = .183, p = .834,
= .029, ]. The total protein levels of GluR1 and GluR2 in the PFC and VM were not affected by intra-PFC injection of DHPG [total GluR1 in PFC, F(2, 12) = .656, p = .5368,
= .0985; ; total GluR2 in PFC, F(2, 12) = .280, p = .7606,
= .044; ; total GluR1 in VM, F(2, 12) = 1.399, p = .284,
= .189; ; total GluR2 in VM, F(2, 12) = .215, p = .809,
= .034; ]. Unlike SDS, locomotor activity was not affected 2 and 24 h after intra-PFC injection of DHPG [F(2, 13) = .768, p = .483,
= .105; ]. In addition, intra-PFC injection of DHPG did not significantly affect sucrose preference [F(2, 12) = 2.597, p = .112,
= .285; ]. However, Bonferroni post-hoc test revealed that sucrose preference was significantly reduced in mice with intra-PFC injection of DHPG during the second phase of 24–48 h [aCSF vs. DHPG 24 h, p = .040; ). In contrast, sucrose preference in the first phase of 0–24 h was not affected by intra-PFC injection of DHPG [aCSF vs. DHPG 2 h, p = .204, ], and DHPG did not affect total intake [F(2,12) = .685, p = .521,
= .095; ]. This anhedonia-like symptom was associated with the decrease in membrane-bound GluR1 protein level in the VM but not the PFC. When membrane-bound GluR1 protein level was significantly decreased in the PFC 2 h post-intra-PFC injection of DHPG, the hedonic-like response was not significantly affected. These results imply the possibility that the decrease in the protein level of membrane-bound GluR1 in the VM rather than the PFC is critical for exhibiting the anhedonia-like symptoms in mice.
Reduction of membrane-bound GluR1 protein level in the VM and sucrose preference by DHPG injection in the VM
Since anhedonia-like symptoms were observed when the protein level of membrane-bound GluR1 in the VM was decreased in mice with intra-PFC injection of DHPG, there is a possibility that this decrease in the protein level of membrane-bound GluR1 in the VM can cause anhedonia-like symptoms. Therefore, we investigated whether the local injection of DHPG into the VM of awake mice leads to anhedonia-like symptoms. One-way ANOVA revealed that intra-VM injection of DHPG significantly affected the protein level of membrane-bound GluR1 in the VM [F(2, 12) = 24.253, p < .001, =.801; ]. Bonferroni post-hoc test showed that the protein level of membrane-bound GluR1 in the VM was significantly reduced 2 and 24 h after intra-VM injection of DHPG [aCSF vs. DHPG 2 h, p < .001; aCSF vs. DHPG 24 h, p < .001; ]. However, the protein level of membrane-bound GluR2 in the VM was not affected 2 and 24 h after intra-VM injection of DHPG [F(2, 12) = .135, p = .874,
= .022; ]. The total protein levels of GluR1 and GluR2 in the VM were not affected by intra-VM injection of DHPG [total GluR1 in VM, F(2, 12) = 1.258, p = .3192,
= .173; ); total GluR2 in VM, F(2, 12) = .069, p = .9338,
= .011; ]. On the other hand, the protein levels of membrane-bound GluR1 and GluR2 in the PFC were not significantly affected by intra-VM injection of DHPG [membrane-bound GluR1 in PFC, F(2, 12) = .277, p = .7625,
= .0441; ; membrane-bound GluR2 in PFC, F(2, 12) = .063, p = .939,
= .010; ]. Furthermore, the total protein levels of GluR1 and GluR2 in the PFC were also not affected by intra-VM injection of DHPG [total GluR1 in PFC, F(2, 12) = 1.018, p = .3904,
= .1451; ); total GluR2 in PFC, F(2, 12) = .310, p = .7391,
= .0491; )]. Locomotor activity was not significantly affected 2 and 24 h after intra-VM injection of DHPG [F(2, 18) = 1.233, p = .314,
= .120; ]. However, sucrose preference was significantly affected by intra-VM injection of DHPG [F(2, 17) = 3.911, p = .043,
= .342, ]. Bonferroni post-hoc test revealed that sucrose preference was significantly reduced 2 and 24 h after intra-VM injection of DHPG [aCSF vs. DHPG 2 h, p = .028, aCSF vs. DHPG 24 h, p = .029, ]. Total intake was not significantly affected by intra-VM injection of DHPG [F(2, 17) = .268, p = .768,
= .030, ]. According to these results, anhedonia-like symptoms were observed when the protein level of membrane-bound GluR1 in the VM was significantly decreased, indicating the possibility that the decrease in the protein level of membrane-bound GluR1 in the VM is critical for exhibiting anhedonia-like symptoms.
Effect of the selective mGluR1 antagonist JNJ-16259685 on SDS-induced anhedonia-like symptoms and decrease in membrane-bound GluR1 protein level
Although we observed that DHPG-induced decrease in the protein level of membrane-bound AMPA-GluR1 in the VM lead the lower sucrose preference, an anhedonia-like symptoms, it remains unclear whether the group I mGluR is involved in SDS-induced decrease in membrane-bound GluR1 protein level and anhedonia-like symptoms. Therefore, we investigated whether SDS-induced anhedonia-like symptoms and decreased membrane-bound GluR1 protein level in the PFC and VM are mediated by group I mGluRs activation. Considering that group I mGluRs are divided into two subtypes (mGluR1 and 5), we investigated the effect of each subtype on SDS-induced anhedonia-like symptoms. Mice were pre-treated with JNJ16259685 (30 mg/kg, subcutaneous) (Power, Morales, & Empson, Citation2016) 30 min prior to SDS for 4 consecutive days. One-way ANOVA revealed that JNJ16259685 pre-treatment did not significantly affect locomotor activity [F(3, 16) = 2.211, p = .126, = .293; ]. JNJ16259685 pre-treatment and SDS significantly affected sucrose preference [F(3, 16) = 5.735, p = .0073,
= .5181; ]. Bonferroni post-hoc test revealed that the reduced sucrose preference in SDS mice was abrogated by JNJ16259685 pre-treatment [control-vehicle vs. SDS-vehicle, p = .0158; SDS-vehicle vs. SDS-JNJ16259685, p = .0017; control-JNJ16259685 vs. SDS-JNJ16259685, p = .7093; ]. In contrast, total intake in SDS mice was affected by JNJ16259685 pre-treatment [F(3, 16) = 3.370, p = .044,
= .387; ]. Bonferroni post-hoc test revealed that the total intake of JNJ16259685-pretreated SDS mice was higher than that of saline-pretreated SDS mice [SDS-saline vs. SDS-JNJ16259685, p = .019; ]. These results indicated that mGluR1 activation is involved in SDS-induced decrease in the sucrose preference. Subsequently, we investigated whether mGluR1 is involved in the SDS-induced decrease in membrane-bound GluR1 protein level in the PFC or VM. The mGluR1 antagonist JNJ16259685 did not affect the membrane-bound GluR1 and GluR2 protein levels of nonSDS mice [membrane-bound GluR1 in PFC, p = .532, d = .468; membrane-bound GluR2 in PFC, p = .904, d = −.088; ]. Membrane-bound GluR1 and GluR2 protein levels in the VM of nonSDS mice were also not affected by JNJ16259685 [membrane-bound GluR1 in VM, p = .563, d = −.431; membrane-bound GluR2 in VM, p = .603, d = −.387; ]. Moreover, the total protein levels of GluR1 and GluR2 in the PFC and VM of nonSDS mice were not affected by JNJ16259685 [total GluR1 in PFC, p = .574, d = −.419; total GluR2 in PFC, p = .767, d = .219; total GluR1 in VM, p = .718, d = .266; total GluR2 in VM, p = .744, d = .241; ]. On the other hand, the membrane-bound GluR1 and GluR2 protein levels in the PFC was affected by SDS and JNJ16259685 pre-treatment [membrane-bound GluR1, F(2, 12) = 28.520, p < .001,
= .826; membrane-bound GluR2, F(2, 12) = 5.811, p = .017,
= .492, ]. Bonferroni post-hoc test revealed that the JNJ16259685 pre-treatment did not abrogate the decreased membrane-bound GluR1 and GluR2 in SDS mice [membrane-bound GluR1, control-vehicle vs. SDS-vehicle, p < .001; control-vehicle vs. SDS-JNJ16259685, p < .001, ; membrane-bound GluR2: control-vehicle vs. SDS-vehicle, p = .030; control-vehicle vs. SDS-JNJ16259685, p = .0055, ]. In contrast to the results of the PFC, the SDS-induced decrease in the protein level of membrane-bound GluR1 in the VM was abrogated by JNJ16259685 pre-treatment [F(2, 12) = 5.201, p = .023,
= .464; control-vehicle vs. SDS-vehicle, p = .009; control-vehicle vs. SDS-JNJ16259685, p = .436; SDS-vehicle vs. SDS-JNJ16259685, p = .040; ]. However, membrane-bound GluR2 protein level in the VM of SDS mice was not affected by JNJ16259685 pre-treatment [F(2, 12) = .001, p = .999,
= .0001; ]. The total protein levels of GluR1 and GluR2 in the PFC were not affected by either SDS or JNJ16259685 [total GluR1 in PFC, F(2, 12) = .132, p = .877,
= .021; ; total GluR2 in PFC, F(2, 12) = .101, p = .905,
= .016; ; total GluR1 in VM: F(2, 12) = .040, p = .961,
= .006; ; total GluR2 in VM: F(2, 12) = .46, p = .642,
= .0712; ]. These results indicated the possibility that mGluR1 in the VM is involved in SDS-induced anhedonia-like symptoms and the decreased membrane-bound GluR1 protein level in the VM. However, the decrease in the protein level of membrane-bound GluR1 and GluR2 in the PFC might not be involved in SDS-induced anhedonia-like symptoms.
Effect of the selective mGluR5 antagonist MPEP on SDS-induced anhedonia-like symptoms and decrease in membrane-bound GluR1 protein level
Finally, we examined whether mGluR5 is involved in SDS-induced anhedonia-like symptoms and the decrease in membrane-bound GluR1 protein level in the PFC or VM. The SDS and MPEP significantly affected locomotor activity [F(3, 16) = 3.712, p = .033, = .410; ]. Bonferroni post-hoc test revealed that MPEP did not significantly affect the locomotor activity of nonSDS mice; however, MPEP abrogated the SDS-induced decrease in locomotor activity [control-vehicle vs. SDS-vehicle, p = .004; SDS-vehicle vs. SDS-MPEP, p = .040; control-MPEP vs. SDS-MPEP, p = .864; ]. These results indicated that the SDS-induced decrease in locomotor activity is mediated by mGluR5 activation. Sucrose preference was also significantly affected by SDS and MPEP [F(3, 16) = 5.479, p = .008,
= .506; ]. However, Bonferroni post-hoc test revealed that MPEP did not significantly affect the SDS-induced decrease in sucrose preference [control-vehicle vs. SDS-vehicle, p = .021; control-MPEP vs. SDS-MPEP, p = .006; ]. Total intake was not affected by SDS and MPEP [F(3, 16) = 2.086, p = .142,
= .281; ]. These results indicated that mGluR5 activation is not involved in SDS-induced decrease in the sucrose preference, an anhedonia-like symptoms. MPEP did not affect the membrane-bound GluR1 and GluR2 protein levels of nonSDS mice [membrane-bound GluR1 in PFC, p = .448, d = −.573; membrane-bound GluR2 in PFC, p = .762, d = .223; ]. Membrane-bound GluR1 and GluR2 protein levels in the VM of nonSDS mice were also not affected by MPEP [membrane-bound GluR1 in VM, p = .587, d = −.405; membrane-bound GluR2 in VM, p = .757, d = −.228; ]. The total protein levels of GluR1 and GluR2 in the PFC and VM of nonSDS mice were also not affected by MPEP (total GluR1 in PFC, p = .700, d = −.284; total GluR2 in PFC, p = .869, d = .121; total GluR1 in VM, p = .658, d = .328; total GluR2 in VM, p = .917, d = −.076; ]. Although MPEP pre-treatment did not affect SDS-induced decrease in the sucrose preference, the protein level of membrane-bound GluR1 in the PFC was affected by SDS and MPEP pre-treatment [F(2, 12) = 11.110, p = .001,
= .649; ]. Bonferroni post-hoc test revealed that the protein level of membrane-bound GluR1 in the PFC of MPEP-pretreated SDS mice was significantly higher than that of SDS-vehicle-treated mice [SDS-vehicle vs. SDS-MPEP, p = .033; ]. Membrane-bound GluR2 protein level in the PFC was also affected by SDS and MPEP [F(2, 12) = 5.352, p = .0021,
= .4715; ]. However, Bonferroni post-hoc test revealed that the decrease in membrane-bound GluR2 protein level in the PFC was not significantly abrogated by MPEP [SDS-vehicle vs. SDS-MPEP, p = .179; ]. Although, MPEP pre-treatment also affected the SDS-induced decrease in membrane-bound GluR1 protein level in the VM [F(2, 12) = 12.911, p = .001,
= .649; ], Bonferroni post-hoc test revealed that MPEP did not abrogate the decreased membrane-bound GluR1 in the VM of SDS mice [SDS-vehicle vs. SDS-MPEP, p = .615; ]. In addition, SDS and MPEP did not affect the protein level of membrane-bound GluR2 in the VM [F(2, 12) = .029, p = .971,
= .004; ]. These results indicated that mGluR5 is not involved in SDS-induced anhedonia-like symptoms and the decreased membrane-bound GluR1 protein in the VM. However, the SDS-induced decrease in locomotor activity may be partially mediated by mGluR5 in the PFC.
Discussion
In the present study, we observed that the decrease in the protein level of membrane-bound GluR1 and GluR2 in the PFC and membrane-bound GluR1 in the VM were elicited by 4 consecutive days of SDS, which were accompanied by a decrease in sucrose preference. JNJ16259685, a mGluR1 antagonist, abrogated only the decreased membrane-bound GluR1 protein level in the VM and SDS-induced anhedonia-like symptoms, but not the decrease in membrane-bound GluR1 in the PFC; thus, the decrease in membrane-bound GluR1 protein level in the VM is important for SDS-induced anhedonia-like symptoms. This was demonstrated by the results of intra-PFC injection of DHPG which induced anhedonia-like symptoms during the second 24-h period after injection. Moreover, the decrease in membrane-bound AMPA-GluR1 protein level in the VM by intra-VM injection of DHPG led to anhedonia-like symptoms in both the first and second 24-h period after injection. On the other hand, pre-treatment with MPEP, a mGluR5 antagonist did not abrogate the SDS-induced decrease in the sucrose preference and did not affect the SDS-induced decrease in membrane-bound GluR1 protein level in the VM. Taken together, these results indicated that mGluR1 in the VM is involved in SDS-induced anhedonia-like symptoms, associated with decrease in membrane-bound AMPA-GluR1 protein level in the VM.
Since local drug application to a specific region of the VTA and the harvesting only the VTA would be technically difficult, we analyzed the VM in the present study. The VM contains the VTA and substantia nigra (SN), which includes both the pars compacta (SNc) and pars reticulata (SNr) in mice (German et al., Citation1996). The anatomical, physiological, and neurochemical properties of the SN have been well studies in rats compared with mice. These regions contain a large population of dopaminergic neurons (Hnasko, Hjelmstad, Fields, & Edwards, Citation2012; Watabe-Uchida, Zhu, Ogawa, Vamanrao, & Uchida, Citation2012), and the glutamatergic inputs to these areas affect reward processing, learning and memory, and movement (Wise, Citation2004). The AMPA receptor GluR1 and GluR2 subunits as well as mGluR1 and mGluR5 are also expressed in dopaminergic or nondopaminergic neurons in the SN (Kramer & Williams, Citation2015; Tse & Yung, Citation2000; Yung, Citation1998) and VTA (Luscher & Huber, Citation2010). The dopaminergic and nondopaminergic neurons in the VTA have been suggested to contribute to locomotor-related motivational signals (Wang & Tsien, Citation2011). Therefore, we were unable to differentiate the function of each area from the results of guide cannula-implanted mice. Intra-PFC injection of DHPG affected membrane-bound GluR1 protein level in the VM and PFC, 24 h after injection, indicating the possibility that the lower activity of neurons in the PFC can alter membrane-bound AMPA-GluR1 protein level in the VM. A study using a technique of rabies-virus-based trans-synaptic tracing, which can cross the synaptic cleft to identify monosynaptic inputs, revealed that both the VTA and SN receive a significant number of cortical inputs from the PFC (Watabe-Uchida et al., Citation2012). Moreover, lesions of the PFC can reduce dopaminergic activity in the VTA (Shim, Bunney, & Shi, Citation1996). Glutamatergic innervation has been suggested as the main direct input to the VTA from the PFC (Wanchoo, Swann, & Dafny, Citation2009). In addition, mGluR1 and mGluR5 are expressed in mouse SN dopamine neurons (Kramer & Williams, Citation2015), and DHPG, a group I mGluR agonist can suppress the glutamate-mediated synaptic input to rat midbrain dopamine neurons (Wigmore & Lacey, Citation1998). A recent study also demonstrated that the expressions of both mGluR1 and mGluR5 mRNAs in VTA dopaminergic neurons are significantly higher than those in VTA GABAergic neurons (Merrill, Friend, Newton, Hopkins, & Edwards, Citation2015), indicating that the localization of mGluR1 and mGluR5 predominantly regulates dopaminergic neurons rather than GABAergic neurons in the VTA. Therefore, the decreased membrane-bound GluR1 protein level in mice with intra-PFC injection of DHPG may be elicited in either the VTA or SN.
We have not found any evidence that the decreased membrane-bound AMPA-GluR1 protein is based on the membrane trafficking or the internalization of cell surface AMPA-GluR1 receptors to the cytosol. Group I mGluR-induced LTD is thought to be associated with the endocytosis of ionotropic AMPA receptor GluR1 and GluR2 subunits in the CA1 of the hippocampus (Moult et al., Citation2006; Snyder et al., Citation2001) and the activation of group I as well as group II mGluR is important for inducing LTD in the PFC (Otani, Auclair, Desce, Roisin, & Crepel, Citation1999). However, it is unclear whether the group I mGluR-dependent decrease in membrane-bound AMPA-GluR1 protein level following SDS or local DHPG injection shares the same mechanisms with mGluR-dependent LTD in the PFC. Nevertheless, the decrease in membrane-bound AMPA-GluR1 protein level in this study is similar to the mechanisms of mGluR-induced LTD. On the other hand, it has been suggested that mGluR-induced LTD in the VTA results in the insertion of lower-conductance GluR2-containing AMPA receptors, triggering a switch in the subunit composition of AMPA receptors rather than reducing the number of AMPA receptors (Bellone & Luscher, Citation2005; Mameli, Balland, Lujan, & Luscher, Citation2007). The GluR2-containing AMPA receptors exhibit lower Ca2+ permeability and consequently display linear current–voltage (I–V) relationships (Wolf & Tseng, Citation2012), resulting in the decrease in AMPA receptor-mediated excitatory postsynaptic current (EPSC) amplitude. In the present study, the membrane -bound GluR1 in the VM was significantly decreased by DHPG, whereas membrane-bound GluR2 protein level was not altered. This change in AMPA receptor subunit composition in the VM by DHPG may lead to lower Ca2+ channel conductance, linear I–V relationships, and smaller AMPA receptor-mediated EPSC. However, these studies did not reveal whether mGluR-dependent LTD in the VTA is caused by the alteration of cell surface AMPA receptor subunit expression level. LTD in the SN is dependent on dopamine receptors (Dupuis et al., Citation2013), and LTD can be induced by glutamatergic synapses on SNc neurons (Singh, Carman, Roeper, & Bonci, Citation2007). Interestingly, this form of synaptic plasticity occurs through the post-synaptic NMDA receptor-mediated endocytosis of GluR2-containing AMPA receptors (Dupuis et al., Citation2013). Furthermore, the group I/II mGluR antagonist, α-methyl-4-carboxyphenylglycine (MCPG) is unable to prevent this form of LTD (Dupuis et al., Citation2013), indicating that the trafficking of GluR2 during LTD induction in the SN is different from mGluR-dependent LTD in the VTA. Moreover, this form of LTD in the SN does not explain the SDS-induced decrease in membrane-bound GluR1 protein level in the VM and SDS did not affect membrane-bound GluR2 protein level in the VM, nevertheless, it remains unclear whether mGluR-dependent LTD can be elicited in the SN.
The blockade of either mGluR1 or mGluR5 exerts antidepressant-like effects on behavioral despair in rats and mice (Belozertseva, Kos, Popik, Danysz, & Bespalov, Citation2007; Palucha et al., Citation2005). In addition, the overexpression of Homer1a (a post-synaptic scaffolding protein associated with mGluR1 and mGluR5) in the hippocampus leads to increased behavioral despair (Wagner et al., Citation2015), indicating that the blockade of group I mGluR activity may have antidepressant effects on behavioral despair. On the other hand, the effect of group I mGluRs on anhedonia-like symptoms is poorly understood (Lesage & Steckler, Citation2010). In the present study, we observed that JNJ16259685 (a mGluR1 antagonist) but not MPEP (a mGluR5 antagonist) prevented the SDS-induced decrease in sucrose preference, indicating that an antagonist of mGluR1 may be suitable for reducing stress-induced anhedonia-like symptoms. Therefore, there is a possibility that the antagonism of mGluR1 is effective against both anhedonia-like symptoms and behavioral despair. In the present study, we found that MPEP did not affect the SDS-induced decrease in the sucrose preference. A study demonstrated that mGluR5 gene knockout mice have lower sucrose preference than wild type mice following 3 days of restraint stress (Shin et al., Citation2015). The discrepancy in these results may be attributed to the different models of animals used for assessing restraint stress-induced depressive-like behavior. SDS escalates cocaine self-administration because of increased dopamine release in the NAc shell (Han et al., Citation2015); conversely sucrose preference is decreased by SDS (Iniguez et al., Citation2014). The difference between these phenotypes in SDS in terms of preference for drugs and sucrose may be caused by the different neurochemical mechanisms. Interestingly, group I mGluRs have been suggested to contribute to drug-seeking behavior. For example, it has been reported that the systemic administration of a positive allosteric modulator of mGluR1 reduces the cue-induced cocaine craving (Loweth et al., Citation2014). In addition, the negative allosteric modulation of mGluR5 can reduce the self-administration of most drugs of abuse, including cocaine, heroin, methamphetamine, nicotine, and ethanol, and the reinstatement of drug-seeking behavior (Olive, Citation2009). From these studies, the mGluR1 might contribute to decrease and mGluR5 increase the drug seeking behavior. However, these studies did not use the animals with SDS. Therefore, both the sucrose preference and drug seeking behaviors are affected by SDS and involve the group I mGluRs activations, however, it is unclear whether group I mGluRs contribute to SDS-escalated cocaine self-administration. Therefore, it would be important to elucidate the mechanisms of SDS-induced anhedonia-like symptoms in terms of both the contribution of mGluR1 to SDS-induced drug-seeking behavior and decrease in the sucrose preference.
Acknowledgments
We would like to thank Miss Natsuki Kurosawa, Mr Ko Shimizu and Miss Kasumi Sato for technical supports for performing the experiments. We gratefully acknowledge the work of past and present members of our laboratory. This work was supported by a Grant for Research in the School of Pharmaceutical Science, Ohu University to K. Seki.
Disclosure statement
No potential conflict of interest was reported by the authors.
Additional information
Funding
References
- Arnsten, A. F. (2009). Stress signalling pathways that impair prefrontal cortex structure and function. Nature Reviews. Neuroscience, 10, 410–422. doi: 10.1038/nrn2648
- Audet, M. C., Jacobson-Pick, S., Wann, B. P., & Anisman, H. (2011). Social defeat promotes specific cytokine variations within the prefrontal cortex upon subsequent aggressive or endotoxin challenges. Brain, Behavior, and Immunity, 25, 1197–1205. doi: 10.1016/j.bbi.2011.03.010
- Bellone, C., & Luscher, C. (2005). mGluRs induce a long-term depression in the ventral tegmental area that involves a switch of the subunit composition of AMPA receptors. European Journal of Neuroscience, 21, 1280–1288. doi: 10.1111/j.1460-9568.2005.03979.x
- Belozertseva, I. V., Kos, T., Popik, P., Danysz, W., & Bespalov, A. Y. (2007). Antidepressant-like effects of mGluR1 and mGluR5 antagonists in the rat forced swim and the mouse tail suspension tests. European Neuropsychopharmacology, 17, 172–179. doi: 10.1016/j.euroneuro.2006.03.002
- Bjorkqvist, K. (2001). Social defeat as a stressor in humans. Physiological Behavior, 73, 435–442.
- Caspi, A., Sugden, K., Moffitt, T. E., Taylor, A., Craig, I. W., Harrington, H., … Poulton, R. (2003). Influence of life stress on depression: Moderation by a polymorphism in the 5-HTT gene. Science (New York, N.Y.), 301, 386–389. doi: 10.1126/science.1083968
- Chaudhury, D., Walsh, J. J., Friedman, A. K., Juarez, B., Ku, S. M., Koo, J. W., … Han, M. H. (2013). Rapid regulation of depression-related behaviours by control of midbrain dopamine neurons. Nature, 493, 532–536. doi: 10.1038/nature11713
- Colquhoun, D. (2014). An investigation of the false discovery rate and the misinterpretation of p-values. Royal Society Open Science, 1, 140216. doi: 10.1098/rsos.140216
- Crawford, L. K., Rahman, S. F., & Beck, S. G. (2013). Social stress alters inhibitory synaptic input to distinct subpopulations of raphe serotonin neurons. ACS Chemical Neuroscience, 4, 200–209. doi: 10.1021/cn300238j
- Dupuis, J. P., Feyder, M., Miguelez, C., Garcia, L., Morin, S., Choquet, D., … Baufreton, J. (2013). Dopamine-dependent long-term depression at subthalamo-nigral synapses is lost in experimental parkinsonism. Journal of Neuroscience, 33, 14331–14341. doi: 10.1523/jneurosci.1681-13.2013
- Gascon, E., Lynch, K., Ruan, H., Almeida, S., Verheyden, J. M., Seeley, W. W., … Gao, F. B. (2014). Alterations in microRNA-124 and AMPA receptors contribute to social behavioral deficits in frontotemporal dementia. Nature Medicine, 20, 1444–1451. doi: 10.1038/nm.3717
- German, D. C., Nelson, E. L., Liang, C. L., Speciale, S. G., Sinton, C. M., & Sonsalla, P. K. (1996). The neurotoxin MPTP causes degeneration of specific nucleus A8, A9 and A10 dopaminergic neurons in the mouse. Neurodegeneration, 5, 299–312. doi: 10.1006/neur.1996.0041
- Gladding, C. M., Collett, V. J., Jia, Z., Bashir, Z. I., Collingridge, G. L., & Molnar, E. (2009). Tyrosine dephosphorylation regulates AMPAR internalisation in mGluR-LTD. Molecular and Cellular Neuroscience, 40, 267–279. doi: 10.1016/j.mcn.2008.10.014
- Gold, P. W., & Chrousos, G. P. (2002). Organization of the stress system and its dysregulation in melancholic and atypical depression: High vs low CRH/NE states. Molecular Psychiatry, 7, 254–275. doi: 10.1038/sj.mp.4001032
- Han, X., Albrechet-Souza, L., Doyle, M. R., Shimamoto, A., DeBold, J. F., & Miczek, K. A. (2015). Social stress and escalated drug self-administration in mice II. Cocaine and dopamine in the nucleus accumbens. Psychopharmacology (Berlin), 232, 1003–1010. doi: 10.1007/s00213-014-3734-8
- Hnasko, T. S., Hjelmstad, G. O., Fields, H. L., & Edwards, R. H. (2012). Ventral tegmental area glutamate neurons: Electrophysiological properties and projections. Journal of Neuroscience, 32, 15076–15085. doi: 10.1523/jneurosci.3128-12.2012
- Iniguez, S. D., Riggs, L. M., Nieto, S. J., Dayrit, G., Zamora, N. N., Shawhan, K. L., … Warren, B. L. (2014). Social defeat stress induces a depression-like phenotype in adolescent male c57BL/6 mice. Stress (Amsterdam, Netherlands), 17, 247–255. doi: 10.3109/10253890.2014.910650
- Kim, J. J., & Yoon, K. S. (1998). Stress: Metaplastic effects in the hippocampus. Trends in Neuroscience, 21, 505–509. doi: http://dx.doi.org/10.1016/S0166-2236(98)01322-8
- Kinsey, S. G., Bailey, M. T., Sheridan, J. F., Padgett, D. A., & Avitsur, R. (2007). Repeated social defeat causes increased anxiety-like behavior and alters splenocyte function in C57BL/6 and CD-1 mice. Brain, Behavior, and Immunity, 21, 458–466. doi: 10.1016/j.bbi.2006.11.001
- Kramer, P. F., & Williams, J. T. (2015). Cocaine decreases metabotropic glutamate receptor mGluR1 currents in dopamine neurons by activating mGluR5. Neuropsychopharmacology, 40, 2418–2424. doi: 10.1038/npp.2015.91
- Labots, M., Laarakker, M. C., Ohl, F., & van Lith, H. A. (2016). Consomic mouse strain selection based on effect size measurement, statistical significance testing and integrated behavioral z-scoring: Focus on anxiety-related behavior and locomotion. BMC Genetics, 17, 95. doi: 10.1186/s12863-016-0411-4
- Lesage, A., & Steckler, T. (2010). Metabotropic glutamate mGlu1 receptor stimulation and blockade: Therapeutic opportunities in psychiatric illness. European Journal of Pharmacology, 639, 2–16. doi: 10.1016/j.ejphar.2009.12.043
- Loweth, J. A., Scheyer, A. F., Milovanovic, M., LaCrosse, A. L., Flores-Barrera, E., Werner, C. T., … Wolf, M. E. (2014). Synaptic depression via mGluR1 positive allosteric modulation suppresses cue-induced cocaine craving. Nature Neuroscience, 17, 73–80. doi: 10.1038/nn.3590
- Luscher, C., & Huber, K. M. (2010). Group 1 mGluR-dependent synaptic long-term depression: Mechanisms and implications for circuitry and disease. Neuron, 65, 445–459. doi: 10.1016/j.neuron.2010.01.016
- Mameli, M., Balland, B., Lujan, R., & Luscher, C. (2007). Rapid synthesis and synaptic insertion of GluR2 for mGluR-LTD in the ventral tegmental area. Science (New York, N.Y.), 317, 530–533. doi: 10.1126/science.1142365
- Merrill, C. B., Friend, L. N., Newton, S. T., Hopkins, Z. H., & Edwards, J. G. (2015). Ventral tegmental area dopamine and GABA neurons: Physiological properties and expression of mRNA for endocannabinoid biosynthetic elements. Scientific Reports, 5, 16176. doi: 10.1038/srep16176
- Moult, P. R., Gladding, C. M., Sanderson, T. M., Fitzjohn, S. M., Bashir, Z. I., Molnar, E., & Collingridge, G. L. (2006). Tyrosine phosphatases regulate AMPA receptor trafficking during metabotropic glutamate receptor-mediated long-term depression. Journal of Neuroscience, 26, 2544–2554. doi: 10.1523/jneurosci.4322-05.2006
- Nestler, E. J., & Carlezon, W. A. Jr. (2006). The mesolimbic dopamine reward circuit in depression. Biological Psychiatry, 59, 1151–1159. doi: 10.1016/j.biopsych.2005.09.018
- Ohtake, N., Saito, M., Eto, M., & Seki, K. (2014). Exendin-4 promotes the membrane trafficking of the AMPA receptor GluR1 subunit and ADAM10 in the mouse neocortex. Regulatory Peptides, 190–191, 1–11. doi: 10.1016/j.regpep.2014.04.003
- Olive, M. F. (2009). Metabotropic glutamate receptor ligands as potential therapeutics for addiction. Current Drug Abuse Reviews, 2, 83–98.
- Otani, S., Auclair, N., Desce, J. M., Roisin, M. P., & Crepel, F. (1999). Dopamine receptors and groups I and II mGluRs cooperate for long-term depression induction in rat prefrontal cortex through converging postsynaptic activation of MAP kinases. Journal of Neuroscience, 19, 9788–9802.
- Palucha, A., Branski, P., Szewczyk, B., Wieronska, J. M., Klak, K., & Pilc, A. (2005). Potential antidepressant-like effect of MTEP, a potent and highly selective mGluR5 antagonist. Pharmacology Biochemistry and Behavior, 81, 901–906. doi: 10.1016/j.pbb.2005.06.015
- Paxinos, G., & Franklin, K. (2007). The mouse brain in stereotaxic coordinates. New York: Elsevier Academic Press.
- Plaza-Zabala, A., Li, X., Milovanovic, M., Loweth, J. A., Maldonado, R., Berrendero, F., & Wolf, M. E. (2013). An investigation of interactions between hypocretin/orexin signaling and glutamate receptor surface expression in the rat nucleus accumbens under basal conditions and after cocaine exposure. Neuroscience Letters, 557, 101–106. doi: 10.1016/j.neulet.2013.10.038
- Power, E. M., Morales, A., & Empson, R. M. (2016). Prolonged type 1 metabotropic glutamate receptor dependent synaptic signaling contributes to spino-cerebellar ataxia type 1. The Journal of Neuroscience, 36, 4910–4916. doi: 10.1523/jneurosci.3953-15.2016
- Sekio, M., & Seki, K. (2014). Lipopolysaccharide-induced depressive-like behavior is associated with alpha(1)-adrenoceptor dependent downregulation of the membrane GluR1 subunit in the mouse medial prefrontal cortex and ventral tegmental area. International Journal of Neuropsychopharmacology, 18, pyu005. doi: 10.1093/ijnp/pyu005
- Shim, S. S., Bunney, B. S., & Shi, W. X. (1996). Effects of lesions in the medial prefrontal cortex on the activity of midbrain dopamine neurons. Neuropsychopharmacology, 15, 437–441. doi: 10.1016/s0893-133x(96)00052-8
- Shin, S., Kwon, O., Kang, J. I., Kwon, S., Oh, S., Choi, J., … Kim, D. G. (2015). mGluR5 in the nucleus accumbens is critical for promoting resilience to chronic stress. Nature Neuroscience, 18, 1017–1024. doi: 10.1038/nn.4028
- Singh, V., Carman, M., Roeper, J., & Bonci, A. (2007). Brief ischemia causes long-term depression in midbrain dopamine neurons. The European Journal of Neuroscience, 26, 1489–1499. doi: 10.1111/j.1460-9568.2007.05781.x
- Snyder, E. M., Philpot, B. D., Huber, K. M., Dong, X., Fallon, J. R., & Bear, M. F. (2001). Internalization of ionotropic glutamate receptors in response to mGluR activation. Nature Neuroscience, 4, 1079–1085. doi: 10.1038/nn746
- Tse, Y. C., & Yung, K. K. (2000). Cellular expression of ionotropic glutamate receptor subunits in subpopulations of neurons in the rat substantia nigra pars reticulata. Brain Research, 854, 57–69.
- Tye, K. M., Mirzabekov, J. J., Warden, M. R., Ferenczi, E. A., Tsai, H. C., Finkelstein, J., … Deisseroth, K. (2013). Dopamine neurons modulate neural encoding and expression of depression-related behaviour. Nature, 493, 537–541. doi: 10.1038/nature11740
- Wagner, K. V., Hartmann, J., Labermaier, C., Hausl, A. S., Zhao, G., Harbich, D., … Schmidt, M. V. (2015). Homer1/mGluR5 activity moderates vulnerability to chronic social stress. Neuropsychopharmacology, 40, 1222–1233. doi: 10.1038/npp.2014.308
- Wanchoo, S. J., Swann, A. C., & Dafny, N. (2009). Descending glutamatergic pathways of PFC are involved in acute and chronic action of methylphenidate. Brain Research, 1301, 68–79. doi: 10.1016/j.brainres.2009.08.095
- Wang, D. V., & Tsien, J. Z. (2011). Conjunctive processing of locomotor signals by the ventral tegmental area neuronal population. PLoS One, 6, e16528. doi: 10.1371/journal.pone.0016528
- Watabe-Uchida, M., Zhu, L., Ogawa, S. K., Vamanrao, A., & Uchida, N. (2012). Whole-brain mapping of direct inputs to midbrain dopamine neurons. Neuron, 74, 858–873. doi: 10.1016/j.neuron.2012.03.017
- Wigmore, M. A., & Lacey, M. G. (1998). Metabotropic glutamate receptors depress glutamate-mediated synaptic input to rat midbrain dopamine neurones in vitro. British Journal of Pharmacology, 123, 667–674. doi: 10.1038/sj.bjp.0701662
- Wise, R. A. (2004). Dopamine, learning and motivation. Nature Reviews. Neuroscience, 5, 483–494. doi: 10.1038/nrn1406
- Wolf, M. E., & Tseng, K. Y. (2012). Calcium-permeable AMPA receptors in the VTA and nucleus accumbens after cocaine exposure: When, how, and why? Frontiers in Molecular Neuroscience, 5, 72. doi: 10.3389/fnmol.2012.00072
- Yung, K. K. (1998). Localization of ionotropic and metabotropic glutamate receptors in distinct neuronal elements of the rat substantia nigra. Neurochemistry International, 33, 313–326.