
 ?Mathematical formulae have been encoded as MathML and are displayed in this HTML version using MathJax in order to improve their display. Uncheck the box to turn MathJax off. This feature requires Javascript. Click on a formula to zoom.
Abstract
Psychosocial stress may lead to increased food consumption and overweight. In turn, obesity is related to reduced brain energy content. We hypothesized that psychosocial stress influencing food intake may alter the neuroenergetic status in the human brain. We tested 14 healthy normal weight men in a randomized crossover design. A modified version of the Trier Social Stress Test (TSST) was carried out to induce psychosocial stress vs. control in a neuroimaging setting. Cerebral energy content, i.e. high energy phosphates adenosine triphosphate (ATP) and phosphocreatine (PCr), was measured by 31phosphorus magnetic resonance spectroscopy. Food intake was quantified by an ad libitum buffet test. Stress hormonal response and alterations in glucose metabolism were monitored by blood sampling. Before data collection, we mainly expected a stress-induced reduction in cerebral high energy phosphates, followed by higher food intake. Psychosocial stress increased serum cortisol concentrations (p = .003) and fat intake of all participants by 25% (p = .043), as well as food intake of “stress-eaters” by 41.1% (p = .003) compared with controls. Blood glucose and insulin concentrations were not affected (p > .174 for both). Cerebral ATP and PCr levels generally increased upon stress-induction (p > = .022 and p = .037, respectively). Our data confirm that psychosocial stress may enhance food intake. Contrary to our expectations, stress induces a distinct increase in the neuroenergetic status. This insight suggests that the underlying central nervous mechanisms of stress-induced overeating may involve the regulation of the brain energy homeostasis.
Introduction
Psychosocial stress and food intake behavior are related as a number of studies demonstrate (Harris, Citation2015). In this context, there is evidence that activation of the hypothalamus–pituitary–adrenal (HPA) axis and the sympathetic nervous system (SNS) may contribute to the genesis of overweight (Andrews, D'Aguiar, & Pruessner, Citation2012; Chrousos, Citation2009). Experimental data showed that the administration of glucocorticoids boosts food intake (Tataranni et al., Citation1996). Additionally, stress-induced enhancement of blood cortisol concentrations relates to higher caloric intake as well as overeating, and body weight gain in humans (Francis, Granger, & Susman, Citation2013; Newman, O'Connor, & Conner, Citation2007; Roberts, Campbell, & Troop, Citation2014). Both the activation of stress systems and the regulation of food intake behavior are under central nervous control interacting within the hypothalamus (Harrell, Gillespie, & Neigh, Citation2015). Acute stress enhances neuronal activity in humans, which has been previously shown via a combination of quantitative functional magnetic resonance imaging (fMRI) and arterial spin-labeling perfusion MRI (Wang et al., Citation2005). Further fMRI results demonstrated that individualized stress and food cues are linked within hypothalamic regions of overweight human subjects (Jastreboff et al., Citation2013). Moreover, city living and urban upbringing, which was defined as social stress, is linked to increased amygdala activity (Lederbogen et al., Citation2011). Hyperactivity of these brain regions are associated with hyperphagia and obesity (Rui, Citation2013). In terms of cerebral metabolism, it could be shown that neuronal activation upon psychological stress increases the cerebral metabolic rate for glucose by 12%, as assessed via tracer-based Kety–Schmidt technique, an effect that persists for more than 40 min after the intervention in healthy humans (Madsen et al., Citation1995). In rats, immobilization stress reduces cerebral energy, i.e. adenosine triphosphate (ATP) levels in cortical regions (De Cristóbal et al., Citation2002) and the hippocampus (Orellana et al., Citation2015). On the other hand, further rodent studies demonstrated unchanged ATP levels in the cortex (Madrigal et al., Citation2001) or even an increase in extracellular ATP in the hippocampus after acute restraint stress (Iwata et al., Citation2016). However, human experimental data using the method of 31phosphorous magnetic resonance spectroscopy (31P-MRS) showed a close link between neuroenergetic status and body weight as they repeatedly revealed a reduced cerebral ATP content in obese men compared with normal weight controls (Jauch-Chara et al., Citation2015; Schmoller et al., Citation2010). Moreover, a declined neuroenergetic status, i.e. lowered cerebral levels of the high energy phosphates ATP and phosphocreatine (PCr), may predict enhanced food intake and vice versa, as previously shown by 31P-MRS in humans (Jauch-Chara et al., Citation2012).
Against this background, we hypothesized that stress-induced enhancement in food intake behavior relates to neuroenergetic regulation in the human brain. In order to test our assumption, we examined the effects of psychosocial stress induced by modified Trier Social Stress Test (TSST, Kirschbaum, Pirke, & Hellhammer, Citation1993) adapted for neuroimaging studies (Wang et al., Citation2005) on the cerebral energy status as measured by 31phosphorus magnetic resonance spectroscopy (31P-MRS) of the cortex in normal weight men, as established in previous studies (Binkofski et al., Citation2011; Jauch-Chara et al., Citation2012; Kistenmacher et al., Citation2017). Food intake behavior was examined by standard buffet testing (Jauch-Chara et al., Citation2014; Ott et al., Citation2013) and relevant hormonal parameters, i.e. cortisol, adrenocorticotropic hormone (ACTH), catecholamines, glucose, and insulin were monitored by blood sampling.
Methods and materials
Participants
Our study included 14 healthy (24.8 ± 0.58 years) normal weight (mean body mass index 22.65 ± 0.34 kg/m2) male volunteers. Exclusion criteria were acute or chronic internal, neurological, or psychiatric diseases, nicotine or alcohol abuse, medication of any kind, competitive sports, and extraordinary mental or physical strain. Each participant gave written informed consent. The study was carried out in accordance with the Declaration of Helsinki (2013) of the World Medical Association. Approval was given by the ethics committee of the University of Luebeck (Project code: 07-091).
Experimental design
The study was performed in a randomized single-blinded crossover design. Each subject participated in two single-blinded conditions, i.e. a stress and a control condition as induced by a standardized computer program-based TSST version adapted to neuroimaging studies (Wang et al., Citation2005). Both conditions were carried out on two different days separated by a minimum of one week and a maximum distance of two weeks between. Subjects were instructed not to consume food or any caloric beverages six hours before the experiments started. On each experimental day, volunteers reported to the Institute of Neuroradiology at 4.45 p.m. After arrival, an intravenous forearm catheter was placed for continuous blood sampling. Subsequently, participants were laid in the MR tomograph, the head coil was placed, and 3D magnetic resonance image sets were recorded for 10 minutes to be evaluated for morphological abnormalities and anatomic mapping. At 5.15 p.m., baseline 31phosphor magnetic resonance spectroscopy (31P-MRS) measurements were conducted and a first blood sample was taken. Subsequently, the stress or control intervention was carried out for about five minutes, which was accompanied by a second 31P-MRS sequence and further blood sampling. After finishing the TSST, 31P-MR spectroscopy was continued in five minute intervals until 35 min after intervention onset. Respective blood samples were taken every five minutes until 35 minutes after the end of the TSST. All blood samples were cooled and immediately centrifuged. In order to detect differences in food intake behavior between stress and control conditions, a standard ad libitum buffet was offered immediately after the last 31PMR spectra.
Trier Social Stress Test
The TSST (Kirschbaum et al., Citation1993) is a well-established standardized test in biopsychological research, which induces a reliable acute stress response in human experimental settings (Frisch, Hausser, & Mojzisch, Citation2015). In its original version, the test comprises a free speech and subsequent calculation of arithmetic tasks (Birkett, Citation2011). To adapt the TSST to neuroimaging conditions, the test has been reduced to solving arithmetic tasks and has become a standard procedure (Wang et al., Citation2005). Tasks are divided into a “high-stress” and a “low-stress” control level (not leading to stress induction), which should be completed within about five minutes while taking 31PMR spectra in the magnetic resonance scanner. Special goggles (VisuaStim, Resonance Technology Inc., Northridge, CA) presented the tasks via an integrated monitor. The high stress intervention consisted of a serial subtraction of 13 from 1022. For each subtraction step, three solution options were presented and the correct answer should be selected by pressing the corresponding button on a special keyboard for this purpose (4-Button Curve Left Fiber Optic Response Pad HHSC-1x4-CL, Current Designs, Inc., Philadelphia, PA). If an incorrect answer was chosen, participants were abruptly informed via microphone and serial subtraction tasks started from 1022 again. In the control condition, participants are asked to simply count backwards (subtract 1 starting from 1022) without any feedback or interruption.
31P-magnetic resonance spectroscopy
31Phosphorus magnetic resonance spectroscopy measurements of the cortex were conducted in a 3.0-Tesla magnetic resonance scanner (Achieva 3T, Philips Medical Systems, Best, The Netherlands) by using a doubled-tuned volume 1H/31P-headcoil (Advanced Imaging Research, Cleveland, OH) before, during, and after the stress intervention. This noninvasive in vivo method allows quantitative statements of brain energy metabolites (Kemp, Citation2000). Key metabolites of the high energy phosphate homeostasis are ATP and PCr (Mattei, Bendahan, & Cozzone, Citation2011; Melchert et al., Citation1992). As the nicotinamide adenine dinucleotide (NAD) pool is crucial for mitochondrial ATP synthesis (Stein & Imai, Citation2012), we also monitored changes in its reduced form NADH via 31P-MR spectra (Lu, Zhu, Zhang, & Chen, Citation2014). A repetition time of 4500 ms with a three-dimensional chemical shift imaging sequence (6 × 6 voxels in three slices: 24 cm × 24 cm × 12 cm field of view, 6-kHz bandwidth, 1024 data points, 5:00 min measuring time) was chosen to attain sufficient relaxation of the phosphorus metabolites as described before (Binkofski et al., Citation2011). Nuclear Overhauser effect (Bachert-Baumann et al., Citation1990) and 1H-decoupling during receiving (wideband alternating-phase technique for zero-residual splitting, WALTZ) (Barker et al., Citation2001) were applied for improved spectral resolution 1H-decoupling during excitation and signal reception, respectively. Therefore, the second channel of the head coil for transmitting on the 1H-resonance frequencies was used. During the 40 minutes scan, the volunteers’ heads lay on a cushion inside of the double tuned birdcage head coil. In combination with the goggles used for the stress tests, there was very little space for head movements, which ensured placement. Under these circumstances, measurements of a voxel size of 4 × 4×4 cm3 turns potential motion artifacts due to head displacements negligible. The evaluation of the spectral data was performed applying magnetic resonance user interface (jMRUI) (Naressi, Couturier, Castang, de Beer, & Graveron-Demilly, Citation2001) with zero filling to 4096 data points, apodizing by a 10 Hz Lorentzian filter. 31P-MR spectra were measured in five minute intervals, one spectrum set before, one series during the stress intervention, and seven spectra sets thereafter leading to a total scanning time of 40 minutes. Calculations of peak positions and intensities were done using the Advanced Method for Accurate Robust and Efficient Spectral fitting (AMARES) algorithm (Vanhamme, van den Boogaart, & Van, Citation1997).
ATP levels were calculated out of the sum of α-, β-, and γ-ATP (Iosifescu & Renshaw, Citation2003; Rango, Bozzali, Prelle, Scarlato, & Bresolin, Citation2001). ATP and PCr represent the overall cerebral high energy phosphates. In a bidirectional manner, ATP is formed by PCr and vice versa by creatine-phospho-kinase at a molar ratio of 1:1 (Iosifescu & Renshaw, Citation2003). The reduced form of nicotinamide adenine dinucleotide (NADH) provides a signature of glycolysis or oxidative phosphorylation activity in the cytoplasm and the mitochondria of astrocytes and neurons (Pellerin & Magistretti, Citation2004). As NADH is an ultimate electron donor for many redox reactions, including oxidative phosphorylation, it plays a key role in cerebral energy and oxidative metabolism (Ghosh, Levault, & Brewer, Citation2014; Yaseen et al., Citation2013) and further represents an important sensor of cellular needs linked to its glycolytic activity (Raichle & Mintun, Citation2006). Before measuring baseline spectra, key T1-weighted 3D MR image sets were recorded for 10 minutes and evaluated for morphological abnormalities and anatomic mapping. This 3D turbo field echo (TFE) sequence was measured with 170 sagittal slices of 1 mm thickness (repetition time 8.2 ms, echo time 3.8 ms, inversion delay 1020 ms, field of view 240 × 240 mm2 with 1 mm2 in plane resolution, flip angle 8°, 119 TFE shots). Therefore, the total time of MR imaging and spectroscopy was 50 minutes.
Standardized buffet testing
Immediately after final 31P-MRS measurements, a well-established standardized ad libitum buffet (Jauch-Chara et al., Citation2012; Ott et al., Citation2013) was offered to the participants, which was provided for 30 minutes in a separate room. Subjects were not informed about the intent to examine food intake behavior. They were told that the study aim was to explore the effects of stress on brain function and food was only offered to compensate for the skipped lunch. The buffet included a balanced mixture of low and high caloric, warm and cold, fresh and convenience, as well as savory and sweet food as specifically combined for this type of analyses (Jauch-Chara et al., Citation2012; Ott et al., Citation2013). The total energy content of the entire buffet comprised 6958 kilocalories (kcal). Macronutrient content was about 47% carbohydrates, 41% fat, and 12% proteins. After 30 minutes, subjects were asked to finish their meal and food was weighed without awareness of the volunteers. Using a professional nutrition software program (Prodi Version 5.9, Nutri-Science GmbH, Hausach, Germany), energy content (kcal) and nutrient composition, i.e. carbohydrates (kcal), fat (kcal), and proteins (kcal), were calculated.
Handling and analysis of blood samples
The supernatants of blood samples were stored at −85 °C until analysis. Blood glucose was determined directly (B-Glucose-Data-Management, HemoCue GmbH, Grossostheim, Germany) every five minutes. Serum insulin, cortisol, and ACTH concentrations were measured by immunoassay (Immulite, DPC, Los Angeles, CA; insulin: inter-assay coefficient of variation (CV) < 6.1%, intra-assay CV < 5.2%; cortisol: inter-assay CV < 6.3, intra-assay CV < 5.8%; ACTH: inter-assay CV < 9.4%, intra-assay CV < 6.1%). Catecholamines (norepinephrine, epinephrine, and dopamine) were assessed via HPLC ECD (Chromaster, VWR-Hitachi, Merck, Tokyo, Japan; norepinephrine: inter-assay CV < 12.1%, intra-assay CV < 3.2%; epinephrine: inter-assay CV < 9.9%, intra-assay CV < 1.8%; dopamine: inter-assay CV < 11.1%, intra-assay CV < 5.1%).
Statistics
Data are presented as mean values ± SEMs. Statistical analyses were performed by Superior Performing Software System Version 22.0 (SPSS Inc., Chicago, IL, USA) based on analysis of variance (ANOVA) for repeated measurements. Normal distribution of the data was verified by the Shapiro–Wilk test. If necessary, correction was performed by applying the Greenhouse–Geisser method. Analyses compared stress and control interventions. Results are presented as “treatment” (stress vs. control) and “time” (time points of data collection) effects. The interaction effect between these factors is described as “treatment × time”. Paired-sample t-tests were calculated to compare single time points between conditions. Effect size was determined via G*Power Version 3.0.10 and is reported in the results as Cohen’s d (d) for all t-tests. The effect size for ANOVA analyses was calculated by SPSS and reported as partial eta squared (. Testings comprised n = 14 in each condition. Analyses of insulin, cortisol, ACTH, and dopamine concentrations comprised n = 12 due to venipuncture difficulties. A p value <.05 was considered significant. p between .05 and .100 was considered a trend. Areas under the curves were calculated using the standardized formula for individual areas as well as for areas with respect to the ground (AUCg) as described by Pruessner, Kirschbaum, Meinlschmid, and Hellhammer (Citation2003), which is shown in . In addition, bivariate correlation analyses between areas under the curve were conducted according to Pearson.
Results
Stress axes and blood glucose metabolism
Baseline serum cortisol concentrations were comparable in both conditions (t(11) = 0.413, p = .687, d = 0.119) but increased after stress-induction compared with the control condition (F(9, 99) = 8.036, p = .003, = 0.422 for the “interaction” including all time points, ). In contrast, we did not find any significant differential effects between conditions in ACTH concentrations (F(9, 99) = 1.504, p = .231,
= 0.120, for the “interaction”; ) after comparable concentrations at baseline (t(11) = 0.753, p = .467, d = 0.217).
Figure 1. Mean values ± SEM of serum cortisol (A) and ACTH (B) concentrations upon stress vs. control intervention (gray bar). Asterisks mark significant analyses of t-tests (*p < .05; **p < .01).
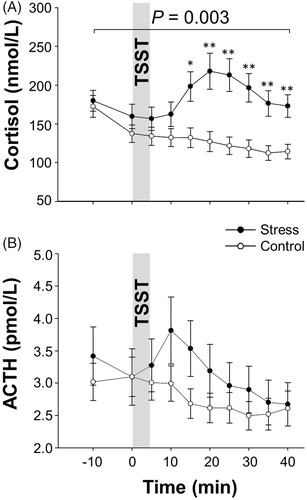
Activity of the SNS as determined by circulating catecholamine concentrations did not display any differences, neither at baseline (epinephrine: t(12) = −0.397, p = .531, d = 0.110; norepinephrine: t(12) = 0.106, p = .918, d = 0.029; dopamine: t(11) = 0.689, p = .505, d = 0.199) nor after the stress or control intervention (epinephrine: F(9, 99) = 0.634; p = .175, = 0.121; norepinephrine: F(9, 108) = 0.627, p = .615,
= 0.050; dopamine: F(9, 99) = 0.863, p = .512,
= 0.073, for interaction effects; ). Only a brief significant increase was found in terms of epinephrine from baseline until five minutes after stress intervention (F(2, 24) = 4.645, p = .030,
= 0.279, for “time” effect), while concentrations were unchanged after the control intervention (F(2, 24) = 2.006, p = .159,
= 0.143 for “time” effect).
Table 1. Mean values ± SEM of blood glucose, plasma catecholamine, and serum insulin concentrations.
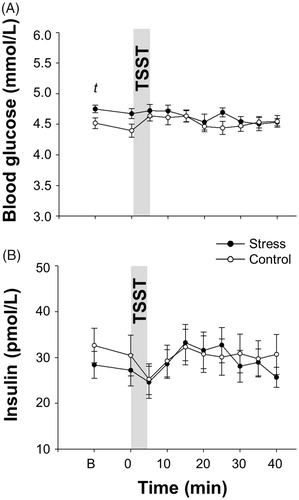
At baseline, blood glucose concentrations tended to be higher before stress induction compared with the control condition (t(13) = 1.989, p = .068, d = 0.531, ; ). In contrast, no differences were found between conditions comprising all time points (F(1, 13) = 1.292, p = .276, =0.090, for “treatment” effect; F(9, 117) = 1.628, p = .174,
= 0.111 for “interaction” effect, ; ). Similarly, we neither found any differences in baseline insulin concentrations (t(11)= −0.896, p = .390, d = 0.259, ; ) nor any differences comparing all insulin values between stress vs. control intervention (F(1, 11) = 0.133, p = .723,
= 0.012, for “treatment” effect; F(9, 99) = 1.215, p = .318,
= 0.099, for “interaction” effect, ; ).
Figure 2. Mean values ± SEM of blood glucose (A) and insulin (B) concentrations upon stress vs. control intervention (gray bar). Asterisks mark significant analyses of t-tests (tp < .10).
High energy phosphate content
At baseline, cerebral ATP and PCr levels did not differ between conditions (ATP: t(13) = −1.527, p = .151, d = 0.408; PCr: t(13) = 0.642, p = .532, d = 0.172, ). Comparing all time points after stress intervention onset, we found significantly higher ATP levels compared with control (F(1, 13) = 6.740, p = .022, = 0.341 for “treatment” effect ; t(13) = 2.810, p = .015, d = 0.751 for mean ATP levels, , bar chart). Accordingly, also PCr levels were higher by strong trend after stress induction although values failed to reach significance (F(1, 13) = 4.453, p = .055,
= 0.255, for “treatment” effect ; t(13) = 2.110, p = .055, d = 0.564, mean PCR levels , bar chart). However, there seems to be a delayed effect of stress induction as differences between conditions became significant when comparing the last six spectra sequences with each other (F(1, 13) = 5.409, p = .037,
= 0.294 for “treatment” effect). This effect resulted from higher PCr values of the two last spectra series after stress compared with the control condition (t(13) = 2.230, p = .044; d = 0.596 and t(13) = 2.179, p = .048; d = 0.582, respectively, ).
Figure 3. Mean values ± SEM of cerebral high energy phosphates and oxidized nicotinamide adenine dinucleotide (NADH) content upon stress vs. control intervention (gray bar). Asterisks mark significant analyses of t-test (tp < .10; *p < .05; **p < .01).
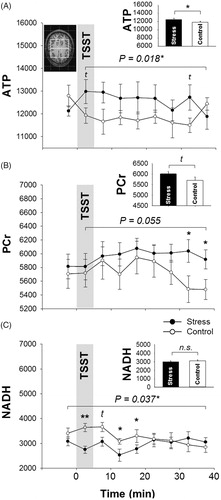
In terms of NADH, analyses revealed comparable baseline levels (t(13) = −1.726, p = .108, d = 0.461, ). Subsequent stress induction immediately caused a significant drop compared with control (F(6, 78) = 2.694, p = .037, = 0.121 for the “interaction” comprising all values, ). This differential effect lasted for four spectra series after stress induction (t(13) = −5.713, p < .001, d = 1.526; t(13)= −2.068, p = .059, d = 0.553; t(13) = −2.511, p = .026, d = 0.671; t(13) = −2.628, p = .021, d = 0.703, respectively, ) and disappeared thereafter (t(13) = −0.144, p = .887, d = 0.039; t(13)= −0.220, p = .829, d = 0.059; t(13) = 0.726, p = .480, d = 0.194; t(13) = 0.775, p = .452, d = 0.207, respectively, ). However, mean NADH content after intervention onset did not differ between conditions (t(13) = −1.185, p = .257, d = 0.317, , bar chart).
Correlation analyses between the areas under the curve of high energy phosphates and the HPA axis revealed a negative relationship at several points of time in both conditions as well as prior to TSST intervention, i.e. apparently independent of the stress induction ().
Table 2. Correlation analyses between the areas under the curve (AUC) of the high energy phosphates adenosine triphosphate (ATP) and phosphocreatine (PCr), and the hypothalamus–pituitary–adrenal axis (cortisol and ACTH).
Standardized buffet tests
Buffet testing comprising all participants revealed a higher overall caloric intake by trend after stress induction (2037.91 ± 132.269 kcal) compared with the control condition (1689.87 ± 170.153 kcal, t(13) = 1.880, p = .083, d = 0.502). Macronutrient differentiation in this cohort revealed that this effect was mainly due to significantly higher fat consumption by 184.44 ± 16.22 kcal (+25%) after stress (921.94 ± 66.69 kcal) than in the control condition (737.50 ± 82.91 kcal, t(13) = 2.238, p = .043, d = 0.598). Differences in terms of carbohydrate and protein consumption did not reach significance (carbohydrates: t(13) = 1.355, p = .198, d = 0.363; proteins: t(13) = 1.607, p = .132, d = 0.436).
Stress eaters
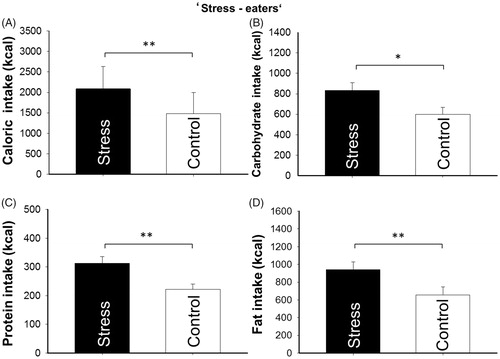
As previous works described, two different types of food intake behavior upon stress have been observed in humans (Jaaskelainen et al., Citation2014; Raspopow, Abizaid, Matheson, & Anisman, Citation2010, Citation2014), which are individuals with increased (“stress-eaters”) or decreased (“non-stress eaters”) food consumption irrespective of the stress hormonal response (Raspopow et al., Citation2014). We therefore screened data for participants who consumed less food after stress than in the control condition to differentiate between these two groups. In fact, we identified three subjects consuming significantly less calories in the stress condition than after control (t(2) = −5.822, p = .028, d = 3.367). Further analyses of remaining “stress-eaters” (n = 11) revealed significantly higher calorie consumption after stress (2087.81 ± 162.983 kcal) compared with control (1479.38 ± 154.55 kcal, t(10) = 3.889, p = .003, d = 1.174, ). This subgroup specifically consumed more calories in form of carbohydrates (t(10) = 2.970, p = .014, d = 0.898, ), proteins (t(10) = 4.257, p = .002, d = 1.289, ), and fat (t(10) = 3.664, p = .004, d = 1.105, ) after stress than in the control condition. The significantly lower total calorie consumption of “non stress-eaters” (n = 3) after stress compared with control was mainly due to a significantly lower carbohydrate and protein consumption (carbohydrates: t(2) = −14.845, p = .005, d = 8.360; proteins: t(2) = −19.237, p = .003, d = 21.148). Comparing mean cortisol concentrations of “stress-eaters” and “non-stress eaters” confirmed previous observations that the cortisol response does not differ between groups (Raspopow et al., Citation2014), neither in the stress condition (t(10) = 1.136, p = .283, d = 0.731) nor in the control intervention (t(10) = 0.313, p = .760, d = 0.243). Likewise, there were no differences between “stress-eaters” and “non-stress eaters” when differentiating between these two groups in terms of high-energy phosphate spectra after baseline, neither for the stress condition (ATP: t(12) = 0.814, p = .226, d = 0.362; PCr: t(12)=1.118, p = .158, d = 1.138) nor for the control condition (ATP: t(12) = 0.897, p = .418, d = 0.537; PCr: t(12) =1.118, p = .321, d = 0.660).
Figure 4. Mean values ± SEM of total calorie (kcal), carbohydrate (kcal), protein (kcal), and fat (kcal) consumption after stress vs. control intervention. Analyses compared stress (black bar) and control (white bar) intervention within the “stress-eater” group. n = 11. Asterisks mark significant analyses of t-test (*p< .05; **p< .01).
Discussion
Our study confirms previous insight that acute psychosocial stress alters human food intake behavior (Maniam & Morris, Citation2012). The predominant majority of our participants consumed significantly more calories after stress induction than in the control condition, which is consistent with previous data demonstrating that people rather increase (70%) than decrease (30%) their food intake during stress (Adam & Epel, Citation2007). In analogy, our study identified 80% “stress-eaters”, who consumed distinctly more calories in form of carbohydrates, fat, and proteins after stress intervention compared with 20% of our subjects, who responded in the opposite way, i.e. “non-stress eaters” consumed more calories in the control condition than after stress.
Generally, in most individuals, stress influences both the amount and type of food that they consume (Kim, Yang, Kim, & Lim, Citation2013; Yau & Potenza, Citation2013). Previous data show that stressed participants consumed significantly more calories in form of sweet snacks than salty food compared with non-stressed controls (Rutters, Nieuwenhuizen, Lemmens, Born, & Westerterp-Plantenga, Citation2009). Moreover, there are observations, which clearly showed that stress has the potential to change food choice in terms of higher amounts of carbohydrates and fat (Harris, Citation2015), and that people who increase their food intake under stress change their eating pattern from low to high fat foods (Zellner et al., Citation2006). Beyond that, it could be repeatedly shown that many stressed people select a greater proportion of calories from highly palatable foods, i.e. tasty, calorically dense non-nutritionous foods containing high amounts of sugar, other carbohydrates, and/or fat (Groesz et al., Citation2012; Kim et al., Citation2013; Oliver, Wardle, & Gibson, Citation2000). Comprising all subjects in our study, the phenomenon of stress-induced enhanced comfort-food consumption can be confirmed by increased fat consumption by 25%, which was surprisingly not found in terms of carbohydrate intake or overall energy consumption. In contrast, differential analysis of macronutrient consumption revealed that the identified “stress-eaters” in our investigation did not prefer specific macronutrients upon stress induction but rather consumed more calories equally in form of carbohydrates, fats, and proteins.
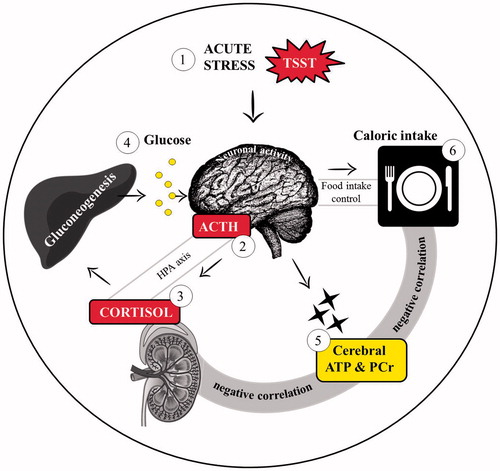
However, the important question remains, by which mechanism stress-induced food intake is mediated. In this context, results from human and rodent stress studies strongly suggest that particularly palatable food intake is initiated to blunt the acute neurohormonal stress response (Ulrich-Lai, Fulton, Wilson, Petrovich, & Rinaman, Citation2015). Notwithstanding, the underlying mechanisms of this observation are still unclear (Ulrich-Lai et al., Citation2015). In order to illustrate the reciprocal connection between the different sites playing a role in this context, we prepared a visual model (), that shall be explained here: Because activation of stress axes and food intake are both under central nervous control (Harrell et al., Citation2015), the brain should be regarded as the crucial site to be focused in terms of underlying mechanisms. Acute stress increases neuronal activity in humans (Jastreboff et al., Citation2013; Streit et al., Citation2014; Wang et al., Citation2005), which, in turn, could be shown to enhance the cerebral metabolic rate of glucose in a previous human investigation (Madsen et al., Citation1995). It has further been shown that caloric intake is negatively related to the cerebral energy content in men (Jauch-Chara et al., Citation2012), i.e. the higher total caloric intake the lower cerebral energy levels and vice versa. Based on this insight and in conjunction with the previous finding that cerebral ATP levels are reduced after six hours of acute immobilization stress exposure in the rat brain (De Cristóbal et al., Citation2002), we had hypothesized that stress-induced enhancements in cerebral energy consumption would be a consequence of lowered cerebral energy levels stimulating food intake. Interestingly, we found the opposite. Our data show that acute psychosocial stress enhanced cerebral energy levels for 40 min in all subjects preceding the described effects in food consumption. Notwithstanding, our divergent neuroenergetic results compared with the study in rats could be explained by the differing type of the stressor, shorter duration of the stress intervention, missing comparability of the intensity of stress experience, or different methods of high energy phosphate measurements. While the animals where physically threatened by immobilization for six hours, we induced psychosocial stress for only five minutes. Moreover, we investigated the effects of stress on cerebral energy levels in the human brain in vivo, while De Cristobal et al. measured the ATP content ex vivo in the rat brain (De Cristóbal et al., Citation2002). Although we are not able to explore molecular mechanisms due to our proof-of-principle approach in humans, we can speculate that the observed rise in cerebral high energy phosphates after psychosocial stress as observed in our study may be due to an increased synthesis on behalf of an overcompensation of cerebral needs after accelerated neuronal activity. On the other hand, correlation analyses of the areas under the curve between high energy phosphates and the HPA axis surprisingly revealed a negative relationship between both, which seemingly contradicts our finding of a stress-induced increase in the neuroenergetic status. However, this negative relationship was found in all conditions, i.e. at baseline, during stress, and in the control condition, which renders it likely that this is a fundamental and physiological principle beyond any stress-induced effects. Based on this, it seems possible that enhanced cerebral energy needs induce the well-known hypothalamic stimulation of the anterior pituitary secretion of ACTH as well as the consecutive secretion of cortisol, which consequently initiates ingestion (Adam & Epel, Citation2007).
Figure 5. Visual model of the mechanism underlying stress eating. The process describes that (1) acute stress initiates (2) cerebral ACTH release, which stimulates (3) adrenal cortisol secretion. In turn, cortisol induces hepatic (4) glucose release, which is assumed to be consumed by the brain for enhanced (5) cerebral energy generation, i.e. increased adenosine triphosphate (ATP) and phosphocreatine (PCr) synthesis. In consequence, the stressed individual regulates (6) food intake. The gray bars illustrate the connection between cerebral energy status, HPA axis, and food intake.
Interestingly, in terms of cerebral energy synthesis, our data show that stress reduces NADH, which regenerates 20 minutes after the intervention. NADH represents an important molecule in the cerebral energy metabolism and is essential for mitochondrial ATP synthesis in the respiratory chain (Ma et al., Citation2015; Ying, Citation2007). On the basis of our data, it can be assumed that cerebral energy synthesis is impaired during the first five minutes after acute psychosocial stress induction. As NADH rises after this short time, it is conceivable that the healthy brain is capable of fast NADH compensation to ensure energy synthesis after a transient stressful event, as could be shown by enhanced cerebral energy levels up to 40 minutes after our stress intervention. Nevertheless, our NADH data imply that psychosocial stress induces short-term impairments in neuronal mitochondrial energy synthesis, which has not been described in the human brain so far. However, our findings suggest that brain energy homeostasis is sustained or restored by enhanced food intake and that the well-known activation of stress axes and initiation of stress-induced food intake are the consequences of respective processes in cerebral energy metabolism.
At the systemic level, an interesting side effect was that mean blood glucose and insulin remained unaffected by the stress-induction despite a rise in cortisol concentrations. This was not expected because physiologically glucocorticoids are known to stimulate hepatic gluconeogenesis with subsequent glucose release (Kuo, McQueen, Chen, & Wang, Citation2015) and suppress pancreatic insulin secretion (Andrews & Walker, Citation1999). The phenomenon of unchanged blood glucose after stress despite a cortisol rise was also found in another stress study in both men and women (Dipietro, Yeckel, & Gribok, Citation2012). The stress challenge in this case was a standardized automated psychophysical test, which is comparable to our stress intervention but was 25 min longer, which may indicate that even a prolonged stress intervention does not affect blood glucose. The underlying reasons are not clear. One possible explanation could be that the cortisol rise was not sufficiently high enough or too short for significant effects on blood glucose metabolism in our study. Also the stress-induced increase in catecholamines, which was expected due to rising plasma noradrenaline concentrations after 15 minutes of TSST intervention (Petrakova et al., Citation2015), did not become significant upon our stress intervention. This difference was most likely due to the duration and type of the stress-intervention. While we applied five minutes of a standardized adapted version of TSST for neuroimaging conditions (Wang et al., Citation2005), Petrakova et al. examined the effect of the original TSST version including an interview and an arithmetic task for about 15 minutes, which could be more affective on the sympathetic stress response, whose mechanisms are not fully understood (Petrakova et al., Citation2015).
However, our results are a step toward a better understanding of the mechanisms underlying the phenomenon of boosted food consumption upon stress in humans. In this context, it would be particularly interesting to verify these effects in female participants because a differential response to social stress mainly with regard to the HPA axis (Kumsta, Entringer, Hellhammer, & Wust, Citation2007) has been previously shown in men and women (Kudielka et al., Citation1998; Kumsta, Entringer, Koper, et al., Citation2007). Notwithstanding, the assumption that neuroenergetic regulation per se differs in both genders appears rather unlikely at first glance and needs to be explored in future studies. Moreover, apart from the question how chronic stress affects the cerebral energy synthesis, it could be relevant to explore if stress reduction may reduce food consumption via the outlined neuroenergetic mechanisms. Such insight could open the vision of therapeutic stress management as a future treatment option in obesity.
Conclusions
Our data confirm that acute psychosocial stress increases food intake in the majority of healthy men. Concomitantly, stress induces a distinct increase in the neuroenergetic status. This insight suggests that the underlying central nervous mechanisms of stress-induced overeating may involve the regulation of brain energy homeostasis.
Acknowledgements
Public trial registry: This trial was registered at German Clinical Trials Register (No. DRKS00010439). Available at: https://drks-neu.uniklinik-freiburg.de/drks_web/navigate.do?navigationId=resultsExt
Disclosure statement
The authors have nothing to disclose.
Additional information
Funding
References
- Adam, T.C., & Epel, E.S. (2007). Stress, eating and the reward system. Physiology & Behavior, 91, 449–458. doi:10.1016/j.physbeh.2007.04.011
- Andrews, J., D'Aguiar, C., & Pruessner, J.C. (2012). The combined dexamethasone/TSST paradigm-a new method for psychoneuroendocrinology. PLoS One, 7, e38994. doi:10.1371/journal.pone.0038994
- Andrews, R.C., & Walker, B.R. (1999). Glucocorticoids and insulin resistance: Old hormones, new targets. Clinical Science, 96, 513–523. doi:10.1042/cs0960513
- Bachert-Baumann, P., Ermark, F., Zabel, H.J., Sauter, R., Semmler, W., & Lorenz, W.J. (1990). In vivo nuclear Overhauser effect in 31P-(1H) double-resonance experiments in a 1.5-T whole-body MR system. Magnetic Resonance in Medicine, 15, 165–172. doi:10.1002/mrm.1910150119
- Barker, P.B., Golay, X., Artemov, D., Ouwerkerk, R., Smith, M.A., & Shaka, A.J. (2001). Broadband proton decoupling for in vivo brain spectroscopy in humans. Magnetic Resonance in Medicine, 45, 226–232. doi:10.1002/1522-2594(200102)45:2<226::AID-MRM1031>3.0.CO;2-Z
- Binkofski, F., Loebig, M., Jauch-Chara, K., Bergmann, S., Melchert, U.H., Scholand-Engler, H.G., … Oltmanns, K.M. (2011). Brain energy consumption induced by electrical stimulation promotes systemic glucose uptake. Biological Psychiatry, 70, 690–695. doi:10.1016/j.biopsych.2011.05.009
- Birkett, M.A. (2011). The Trier Social Stress Test protocol for inducing psychological stress. Journal of Visualized Experiments, 56, 3238. doi:10.3791/3238.
- Chrousos, G.P. (2009). Stress and disorders of the stress system. Nature Reviews. Endocrinology, 5, 374–381. doi:10.1038/nrendo.2009.106
- De Cristóbal, J., Madrigal, J.L.M., Lizasoain, I., Lorenzo, P., Leza, J.C., & Moro, M.A. (2002). Aspirin inhibits stress-induced increase in plasma glutamate, brain oxidative damage and ATP fall in rats. Neurochemistry, 13, 217. doi:10.1097/00001756-200202110-00009
- Dipietro, L., Yeckel, C.W., & Gribok, A. (2012). Response to acute psychophysical stress and 24-hour glycemic control in healthy older people. Journal of Aging Research, 2012, 1. doi:10.1155/2012/803864
- Francis, L.A., Granger, D.A., & Susman, E.J. (2013). Adrenocortical regulation, eating in the absence of hunger and BMI in young children. Appetite, 64, 32–38. doi:10.1016/j.appet.2012.11.008
- Frisch, J.U., Hausser, J.A., & Mojzisch, A. (2015). The Trier Social Stress Test as a paradigm to study how people respond to threat in social interactions. Frontiers in Psychology, 6, 14. doi:10.3389/fpsyg.2015.00014
- Ghosh, D., Levault, K.R., & Brewer, G.J. (2014). Relative importance of redox buffers GSH and NAD(P)H in age-related neurodegeneration and Alzheimer disease-like mouse neurons. Aging Cell, 13, 631–640. doi:10.1111/acel.12216
- Groesz, L.M., McCoy, S., Carl, J., Saslow, L., Stewart, J., Adler, N., … Epel, E. (2012). What is eating you? Stress and the drive to eat. Appetite, 58, 717–721. doi:10.1016/j.appet.2011.11.028
- Harrell, C.S., Gillespie, C.F., & Neigh, G.N. (2015). Energetic stress: The reciprocal relationship between energy availability and the stress response. Physiology & Behavior, 166, 43–55. doi:10.1016/j.physbeh.2015.10.009
- Harris, R.B. (2015). Chronic and acute effects of stress on energy balance: Are there appropriate animal models? American Journal of Physiology – Regulatory, Intergrative and Comparative Physiology, 308, R250–R265. doi:10.1152/ajpregu.00361.2014
- Iosifescu, D.V., & Renshaw, P.E. (2003). 31P-magnetic resonance spectroscopy and thyroid hormones in major depressive disorder: Toward a bioenergetic mechanism in depression? Harvard Review of Psychiatry, 11, 51–63. doi:10.1097/00023727-200303000-00001
- Iwata, M., Ota, K.T., Li, X.-Y., Sakaue, F., Li, N., Dutheil, S., … Duman, R.S. (2016). Psychological stress activates the inflammasome via release of adenosine triphosphate and stimulation of the purinergic type 2X7 receptor. Biological Psychiatry, 80, 12–22. doi:10.1016/j.biopsych.2015.11.026
- Jaaskelainen, A., Nevanpera, N., Remes, J., Rahkonen, F., Jarvelin, M.R., & Laitinen, J. (2014). Stress-related eating, obesity and associated behavioural traits in adolescents: A prospective population-based cohort study. BMC Public Health, 14, 321. doi:10.1186/1471-2458-14-321
- Jastreboff, A.M., Sinha, R., Lacadie, C., Small, D.M., Sherwin, R.S., & Potenza, M.N. (2013). Neural correlates of stress- and food cue-induced food craving in obesity: Association with insulin levels. Diabetes Care, 36, 394–402. doi:10.2337/dc12-1112
- Jauch-Chara, K., Binkofski, F., Loebig, M., Reetz, K., Jahn, G., & Melchert, U., H. (2015). Blunted brain energy consumption relates to insula atrophy and impaired glucose tolerance in obesity. Diabetes, 64, 2082–2091. doi:10.2337/db14-0421
- Jauch-Chara, K., Friedrich, A., Rezmer, M., Melchert, U.H., G. Scholand-Engler, H., Hallschmid, M., & Oltmanns, K.M. (2012). Intranasal insulin suppresses food intake via enhancement of brain energy levels in humans. Diabetes, 61, 2261–2268. doi:10.2337/db12-0025
- Jauch-Chara, K., Kistenmacher, A., Herzog, N., Schwarz, M., Schweiger, U., & Oltmanns, K.M. (2014). Repetitive electric brain stimulation reduces food intake in humans. American Journal of Clinical Nutrition, 100, 1003–1009. doi:10.3945/ajcn.113.075481
- Kemp, G.J. (2000). Non-invasive methods for studying brain energy metabolism: What they show and what it means. Developmental Neuroscience, 22, 418–428. doi:10.1159/000017471
- Kim, Y., Yang, H.Y., Kim, A.J., & Lim, Y. (2013). Academic stress levels were positively associated with sweet food consumption among Korean high-school students. Nutrition, 29, 213–218. doi:10.1016/j.nut.2012.08.005
- Kirschbaum, C., Pirke, K.M., & Hellhammer, D.H. (1993). The 'Trier Social Stress Test' – A tool for investigating psychobiological stress responses in a laboratory setting. Neuropsychobiology, 28, 76–81. doi:10.1159/000119004
- Kistenmacher, A., Manneck, S., Wardzinski, E.K., Martens, J.C., Gohla, G., Melchert, U.H., … Oltmanns, K.M. (2017). Persistent blood glucose reduction upon repeated transcranial electric stimulation in men. Brain Stimulation, 10, 780–786. doi:10.1016/j.brs.2017.03.011
- Kudielka, B.M., Hellhammer, J., Hellhammer, D.H., Wolf, O.T., Pirke, K.M., Varadi, E., & Kirschbaum, C. (1998). Sex differences in endocrine and psychological responses to psychosocial stress in healthy elderly subjects and the impact of a 2-week dehydroepiandrosterone treatment. The Journal of Clinical Endocrinology and Metabolism, 83, 1756–1761.
- Kumsta, R., Entringer, S., Hellhammer, D.H., & Wüst, S. (2007). Cortisol and ACTH responses to psychosocial stress are modulated by corticosteroid binding globulin levels. Psychoneuroendocrinology, 32, 1153–1157.
- Kumsta, R., Entringer, S., Koper, J.W., van Rossum, E.F.C., Hellhammer, D.H., & Wüst, S. (2007). Sex specific associations between common glucocorticoid receptor gene variants and hypothalamus-pituitary-adrenal axis responses to psychosocial stress. Biological Psychiatry, 62, 863–869.
- Kuo, T., McQueen, A., Chen, T.C., & Wang, J.C. (2015). Regulation of glucose homeostasis by glucocorticoids. Advances in Experimental Medicine and Biology, 872, 99–126. doi:10.1007/978-1-4939-2895-8
- Lederbogen, F., Kirsch, P., Haddad, L., Streit, F., Tost, H., Schuch, P., … Meyer-Lindenberg, A. (2011). City living and urban upbringing affect neural social stress processing in humans. Nature, 474, 498–501. doi:10.1038/nature10190
- Lu, M., Zhu, X.H., Zhang, Y., & Chen, W. (2014). Intracellular redox state revealed by in vivo (31) P MRS measurement of NAD(+) and NADH contents in brains. Magnetic Resonance in Medicine, 71, 1959–1972. doi:10.1002/mrm.24859
- Ma, Y., Nie, H., Chen, H., Li, J., Hong, Y., Wang, B., … Ying, W. (2015). NAD(+)/NADH metabolism and NAD(+)-dependent enzymes in cell death and ischemic brain injury: Current advances and therapeutic implications. Current Medicinal Chemistry, 22, 1239–1247. doi:10.2174/0929867322666150209154420
- Madrigal, J.L., Olivenza, R., Moro, M.A., Lizasoain, I., Lorenzo, P., & Rodrigo, J. (2001). Glutathione depletion, lipid peroxidation and mitochondrial dysfunction are induced by chronic stress in rat brain. Neuropsychopharmacology, 24, 420–429. doi:10.1016/S0893-133X(00)00208-6
- Madsen, P.L., Hasselbalch, S.G., Hagemann, L.P., Olsen, K.S., Bülow, J., Holm, S., … Lassen, N.A. (1995). Persistent resetting of the cerebral oxygen/glucose uptake ratio by brain activation: Evidence obtained with the Kety–Schmidt technique. Journal of Cerebral Blood Flow & Metabolism, 15, 485–491. doi:10.1038/jcbfm.1995.60
- Maniam, J., & Morris, M.J. (2012). The link between stress and feeding behaviour. Neuropharmacology, 63, 97–110. doi:10.1016/j.neuropharm.2012.04.017
- Mattei, J.P., Bendahan, D., & Cozzone, P. (2011). P-31 magnetic resonance spectroscopy. A tool for diagnostic purposes and pathophysiological insights in muscle diseases. Reumatismo, 56, 9–14. doi:10.4081/reumatismo.2004.9
- Melchert, U.H., Brinkmann, G., Förger, K., Gleim, M., Wunsch-Binder, F., Maier, C., & Zick, G. (1992). In vivo 31-phosphorus MR spectroscopy of the calf musculature in arterial occlusive diseases. Rofo: Fortschritte Auf Dem Gebiete Der Rontgenstrahlen Und Der Nuklearmedizin, 156, 346–352. doi:10.1055/s-2008-1032899
- Naressi, A., Couturier, C., Castang, I., de Beer, R., & Graveron-Demilly, D. (2001). Java-based graphical user interface for MRUI, a software package for quantitation of in vivo/medical magnetic resonance spectroscopy signals. Computers in Biology and Medicine, 31, 269–286. doi:10.1016/S0010-4825(01)00006-3
- Newman, E., O’Connor, D.B., & Conner, M. (2007). Daily hassles and eating behaviour: The role of cortisol reactivity status. Psychoneuroendocrinology, 32, 125–132. doi:10.1016/j.psyneuen.2006.11.006
- Oliver, G., Wardle, J., & Gibson, E.L. (2000). Stress and food choice: A laboratory study. Psychosomatic Medicine, 62, 853–865.
- Orellana, J.A., Moraga-Amaro, R., Díaz-Galarce, R., Rojas, S., Maturana, C.J., Stehberg, J., & Sáez, J.C. (2015). Restraint stress increases hemichannel activity in hippocampal glial cells and neurons. Frontiers in Cellular Neuroscience, 9, 102. doi:10.3389/fncel.2015.00102
- Ott, V., Finlayson, G., Lehnert, H., Heitmann, B., Heinrichs, M., Born, J., & Hallschmid, M. (2013). Oxytocin reduces reward-driven food intake in humans. Diabetes, 62, 3418–3425. doi:10.2337/db13-0663
- Pellerin, L., & Magistretti, P.J. (2004). Neuroscience. Let there be (NADH) light. Science (New York, N.Y.), 305, 50–52. doi:10.1126/science.1100428
- Petrakova, L., Doering, B.K., Vits, S., Engler, H., Rief, W., Schedlowski, M., & Grigoleit, J.-S. (2015). Psychosocial stress increases salivary alpha-amylase activity independently from plasma noradrenaline levels. PLoS One, 10, e0134561. doi:10.1371/journal.pone.0134561
- Pruessner, J.C., Kirschbaum, C., Meinlschmid, G., & Hellhammer, D.H. (2003). Two formulas for computation of the area under the curve represent measures of total hormone concentration versus time-dependent change. Psychoneuroendocrinology, 28, 916–931. doi:10.1016/S0306-4530(02)00108-7
- Raichle, M.E., & Mintun, M.A. (2006). Brain work and brain imaging. Annual Review of Neuroscience, 29, 449–476. doi:10.1146/annurev.neuro.29.051605.112819
- Rango, M., Bozzali, M., Prelle, A., Scarlato, G., & Bresolin, N. (2001). Brain activation in normal subjects and in patients affected by mitochondrial disease without clinical central nervous system involvement: A phosphorus magnetic resonance spectroscopy study. Journal of Cerebral Blood Flow & Metabolism, 21, 85–91. doi:10.1097/00004647-200101000-00011
- Raspopow, K., Abizaid, A., Matheson, K., & Anisman, H. (2010). Psychosocial stressor effects on cortisol and ghrelin in emotional and non-emotional eaters: Influence of anger and shame. Hormones and Behavior, 58, 677–684. doi:10.1016/j.yhbeh.2010.06.003
- Raspopow, K., Abizaid, A., Matheson, K., & Anisman, H. (2014). Anticipation of a psychosocial stressor differentially influences ghrelin, cortisol and food intake among emotional and non-emotional eaters. Appetite, 74, 35–43. doi:10.1016/j.appet.2013.11.018
- Roberts, C.J., Campbell, I.C., & Troop, N. (2014). Increases in weight during chronic stress are partially associated with a switch in food choice towards increased carbohydrate and saturated fat intake. European Eating Disorders Review, 22, 77–82. doi:10.1002/erv.2264
- Rui, L. (2013). Brain regulation of energy balance and body weight. Reviews in Endocrine &Amp; Metabolic Disorders, 14, 387–407. doi:10.1007/s11154-013-9261-9
- Rutters, F., Nieuwenhuizen, A.G., Lemmens, S.G., Born, J.M., & Westerterp-Plantenga, M.S. (2009). Acute stress-related changes in eating in the absence of hunger. Obesity, 17, 72–77. doi:10.1038/oby.2008.493
- Schmoller, A., Hass, T., Strugovshchikova, O., Melchert, U.H., Scholand-Engler, H.G., Peters, A., … Oltmanns, K.M. (2010). Evidence for a relationship between body mass and energy metabolism in the human brain. Journal of Cerebral Blood Flow and Metabolism, 30, 1403–1410. doi:10.1038/jcbfm.2010.48
- Stein, L.R., & Imai, S. (2012). The dynamic regulation of NAD metabolism in mitochondria. Trends in Endocrinology and Metabolism: Tem, 23, 420–428. doi:10.1016/j.tem.2012.06.005
- Streit, F., Haddad, L., Paul, T., Frank, J., Schafer, A., & Nikitopoulos, J. (2014). A functional variant in the neuropeptide S receptor 1 gene moderates the influence of urban upbringing on stress processing in the amygdala. Stress, 17, 352–361. doi:10.3109/10253890.2014.921903
- Tataranni, P.A., Larson, D.E., Snitker, S., Young, J.B., Flatt, J.P., & Ravussin, E. (1996). Effects of glucocorticoids on energy metabolism and food intake in humans. The American Journal of Physiology, 271, E317–E325. doi:10.1152/ajpendo.1996.271.2.E317
- Ulrich-Lai, Y.M., Fulton, S., Wilson, M., Petrovich, G., & Rinaman, L. (2015). Stress exposure, food intake and emotional state. Stress (Amsterdam, Netherlands), 18, 381–399. doi:10.3109/10253890.2015.1062981
- Vanhamme, L., van den Boogaart, A., & Van, H.S. (1997). Improved method for accurate and efficient quantification of MRS data with use of prior knowledge. Journal of Magnetism Reasoning., 129, 35–43. doi:10.1006/jmre.1997.1244
- Wang, J., Rao, H., Wetmore, G.S., Furlan, P.M., Korczykowski, M., Dinges, D.F., & Detre, J.A. (2005). Perfusion functional MRI reveals cerebral blood flow pattern under psychological stress. Proceedings of the National Academy of Sciences of the United States of America, 102, 17804–17809. doi:10.1073/pnas.0503082102
- Yaseen, M.A., Sakadzic, S., Wu, W., Becker, W., Kasischke, K.A., & Boas, D.A. (2013). In vivo imaging of cerebral energy metabolism with two-photon fluorescence lifetime microscopy of NADH. Biomedical Optics Express, 4, 307–321. doi:10.1364/BOE.4.000307
- Yau, Y.H., & Potenza, M.N. (2013). Stress and eating behaviors. Minerva Endocrinologica, 38, 255–267.
- Ying, W. (2007). NAD + and NADH in neuronal death. Journal of Neuroimmune Pharmacology, 2, 270–275. doi:10.1007/s11481-007-9063-5
- Zellner, D.A., Loaiza, S., Gonzalez, Z., Pita, J., Morales, J., Pecora, D., & Wolf, A. (2006). Food selection changes under stress. Physiology & Behavior, 87, 789–793. doi:10.1016/j.physbeh.2006.01.014