
 ?Mathematical formulae have been encoded as MathML and are displayed in this HTML version using MathJax in order to improve their display. Uncheck the box to turn MathJax off. This feature requires Javascript. Click on a formula to zoom.
Abstract
Healthcare providers often perform under significant stress, during which their performance must be optimal, but is known to suffer. Stress management interventions in this context can provide cognitive support to rescue performance. This exploratory study sought to evaluate the effect of stress intervention components on stress and performance while clinicians engaged in two versions of a computer-based task, differing in overall level of demand: one high-stress and one low-stress. Participants (N = 45) were assigned to one of five groups (N = 9 per group), where they each completed both versions of the task, under different conditions of cognitive support. Group 1 received no intervention; Group 2 received biofeedback; and Group 3 received biofeedback and explicit coping instructions. Group 4 received emotional intelligence training, and Group 5 received emotional intelligence training and biofeedback. We hypothesized that Group 3 participants would present the lowest self-reported and physiological measures of stress, and the highest performance. Results reveal that the high-stress task induced significantly higher self-reported and physiological stress/anxiety, and lower task performance. No significant main effects of experimental condition or interaction effects were detected, indicating that intervention components had minimal effect on stress and performance. However, ultra-short term physiological analysis, analyzing <5 min of HRV data, revealed significantly decreased stress (SDNN, the standard deviation of normal-to-normal peaks) following auditory coping instructions. Exploratory study results suggest that although cognitive intervention components had minimal effect on stress and performance, physiological stress may be significantly reduced immediately following adherence to a coping instruction intervention. Future work is needed.
This exploratory study evaluated the potential benefit of providing healthcare practitioners with various stress management components during an acutely stressful task. Our results support the positive effect of following behavioral coping instructions on immediate physiological measures of stress.
Lay summary
Introduction
Adaptive coping in response to stressful stimuli in our environment while engaging in goal-directed behavior is imperative in order to maintain performance. Unfortunately, when appropriate responses have not been learned or engrained, maladaptive coping patterns emerge and may subsequently threaten the likelihood of reaching prescribed goals. Approaches to recognizing coping behaviors and redirecting those behaviors can be enhanced by incorporating awareness of concurrent physiological changes (Jamieson, Mendes, & Nock, Citation2013).
Heart rate variability-derived biofeedback has a long history (Lehrer, Citation2013) as well as a promising future (Lehrer & Vaschillo, Citation2008), with broad utility. Recent studies show that biofeedback can be effectively used for stress management (Kennedy & Henrickson Parker, Citation2018a). A recent systematic review of biofeedback indicated enhanced psychological, physiological, and performance benefits when evaluated among professionals operating in high-stress settings, including soldiers, correctional officers, police officers, professional athletes, senior managers, and post-partum mothers (Kennedy & Henrickson Parker, Citation2018a). This finding is encouraging, because restoring stress to optimal levels among these populations can have broad implications for occupational safety and performance. One crucial demographic missing from the biofeedback literature is healthcare practitioners, for whom the consequences of poor performance due to unregulated stress are dire.
Previous work has also suggested the benefit of introducing adaptive systems (Wilson & Russell, Citation2007) and intermittent notifications (Afergan, Hincks, Shibata, & Jacob, Citation2015) related to the procedure at hand, based on elevated psychophysiological measures. Less research has addressed the potential impact of physiologically-based notifications incorporating human action, for behavioral adaptations for the purpose of self-management. Physiologically-based interventions have the unique benefit of drawing attention to internal processes, awareness of which presents the opportunity to actively alter cognitive patterns, behaviors, and thereby outcomes (Jamieson et al., Citation2013). The literature that does exist in this domain supports the utility of estimating a user’s physiological status as the basis for introducing behavioral interventions (Al Osman, Eid, & Saddik., Citation2013; Kennedy & Henrickson Parker, Citation2018b; Pina et al., Citation2014). Specifically, heart rate variability (HRV) can be used as a proxy for stress and/or cognitive workload (Kennedy & Henrickson Parker, Citation2017, Citation2018b; Wu, Cao, Nguyen, Surmacz, & Hargrove, Citation2015), particularly in the field of surgery (Dias, Ngo-Howard, Boskovski, Zenati, & Yule, Citation2018).
Given the rapid advancement of modern sensor technology, HRV can now be accurately and reliably captured on ultra-short time scales spanning less than the traditionally accepted five-minute short-term analysis windows (Baek, Cho, Cho, & Woo, Citation2015; Munoz et al., Citation2015; Nussinovitch et al., Citation2011; Thong, Li, McNames, Aboy, & Goldstein, Citation2003). Analysis of these ultra-short-term HRV components is sensitive enough to distinguish between mental stress (Kim, Seo, Kim, & Jung, Citation2008; Salahuddin, Cho, Jeong, & Kim, Citation2007) and arousal (Schaaff & Adam, Citation2013) states.
Most commonly, HRV components of interest fall into two categories, classified according to how the components are derived: time-domain and frequency-domain measures (Task Force, Citation1996). Alternatively, components of HRV can be classified according to predominant inputs driving the measure: sympathetically-driven and parasympathetically-driven. On ultra-short time scales and in relation to stress management, parasympathetically-driven, or vagally-mediated, measures tend to be more sensitive to and reflective of real-time changes in physiology. These components primarily include the root mean square of the successive differences (RMSSD), percentage of consecutive intervals differing by 50 milliseconds or more (pNN50), and the high frequency power band (HF). When calculated on short and ultra-short time scales in resting and/or sedentary settings, the primary source of variation within the standard deviation of inter-beat intervals between normal sinus beats (SDNN) is also known to be reflective of parasympathetic activity (McCraty & Shaffer, Citation2015; Shaffer & Ginsberg, Citation2017; Shaffer, McCraty, & Zerr, Citation2014).
To manage stress effectively in the high-risk domain of healthcare, reliable, unobtrusive measurement and aiding is necessary. The objectives of the current exploratory study were to evaluate the influence of different combinations of a cognitive support intervention on outcome measures including perceptions of anxiety and cognitive workload, short-term and ultra-short-term vagally-mediated measures of HRV, and task performance. Specific components included: visual biofeedback displayed as heart rate (HR) in a trending format; auditory coping instructions delivered at times of elevated HR; and a brief training video discussing emotional intelligence in relation to coping with stress in a clinical environment.
Our research questions and hypotheses were:
1. Do perceptions of stress and cognitive workload differ as a result of different intervention components?
– Subjective reports of anxiety and cognitive workload will be lower when participants receive the highest degree of real-time cognitive aid (biofeedback, coping instructions).
2. Do physiological measures of stress differ as a result of different intervention components?
– Objective indicators of stress will be lower when participants receive the highest degree of real-time cognitive aid.
– Ultra-short-term objective indicators of stress will be lower immediately following adherence to discrete intervention events (coping instructions).
3. Does performance differ as a result of different intervention components?
– Task performance will be higher when participants receive the highest degree of real-time cognitive aid.
Methods
Participants
A total of 45 late-stage medical students (N = 32) and residents (N = 13) were recruited to participate in this study. Residents were recruited from emergency medicine, surgery, neurosurgery, and obstetrics and gynecology specialties, and from all post-graduate years (1-6). Of the medical students recruited, 23 were enrolled at the end of their final year, and 9 were enrolled at the beginning of their final year.
Participants were randomly assigned to one of the five experimental groups described below, where each participant completed two versions of a stress-inducing, computer based task: one high- and one low-difficulty.
Equipment
Electrocardiograph (ECG) signals were collected using a MindWare Technologies LTD (Gahanna, OH) 3-lead ambulatory recording device at a sampling rate of 500 Hz. The ECG signals were acquired and transmitted in real time directly to a PC, viewed only by the researcher, by MindWare’s BioLab Acquisition Software. Three lead-shielded electrode leads attached to disposable ECG electrodes transmitted voltage signals and recorded changes from the RA (−), LL (+), and RL (ground) locations on the chest. Participant instructions and medical questions were developed using E-Prime stimulation software by Psychology Software Tools, Inc. (Sharpsburg, PA). The auditory coping instruction administered in Group 3 was prerecorded using a generic voice recorder. The instruction read “Take a deep breath. Count to three out loud as you exhale”, and was administered during the experimental phases when HR exceeded one standard deviation above an individual’s average HR, recorded during the baseline period.
Task
To capture subtle differences among physiological variables, the current study utilized a validated task, Medically-Focused Multitasking Game (MFMG), in a lab setting to achieve high experimental control (Kennedy & Henrickson Parker, Citation2017).
MFMG was designed to induce different degrees of stress while recruiting attentional processes and key cognitive processes, such as memory recall and decision-making (Kennedy & Henrickson Parker, Citation2017). The MATB-II component of the task (Comstock & Arnegard, Citation1992) was completed on a 12” Lenovo Yoga 12 laptop computer, while the task instructions and medical questions component of MFMG were displayed on a 21.5” Dell monitor positioned directly above and behind the Yoga laptop. The MATB-II subtasks employed in this study included Resource Management, System Monitoring, and Tracking.
Two distinct versions of the task were generated, intended to elicit different responses. One version was considered to be low stress and low difficulty, while the other was considered to be high stress and high difficulty. Details on the development and specific composition of these tasks were previously published (Kennedy & Henrickson Parker, Citation2017). The order of conditions was counterbalanced across participants within each experimental group.
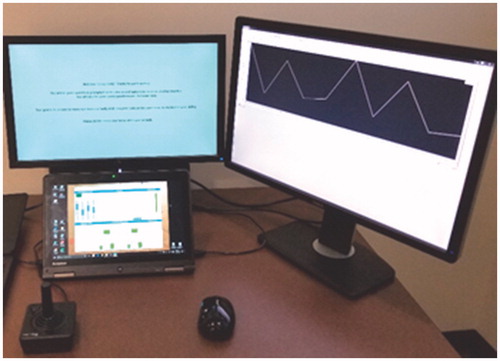
When HR information was available to participants, in Groups 2, 3, and 5, HRV signals were transformed in real time by BioLab and displayed as HR in a trending format and beats per minute, on a 24” Dell monitor placed next to the task display ().
Figure 1. Participant view of the experimental set-up. MATB-II was completed using the joystick, mouse, and the computer screen in the foreground, while medical questions were displayed on the large screen directly above and behind. The screen on the participant’s right displayed HR in Groups 2, 3, and 5.
Self-Report
Self-report measures collected included the stable trait of anxiety, the current state of anxiety, and the current state of cognitive workload. Trait anxiety was measured using the State Trait Anxiety Inventory for Adults (STAI) Y-2 form (Spielberger & Gorsuch, Citation1983), consisting of 20 questions rated on a 4-point Likert scale. Some of the items are reverse coded, resulting in the highest score of 80 representing the highest level of general anxiety. State anxiety during a given period of time was measured using the STAI Y-1 short-form (Marteau & Bekker, Citation1992), a six-item inventory adapted from the original 20-item STAI Y-1 form. The STAI short-form is also presented as a 4-point Likert scale, where the highest possible total score of 24 indicates the highest state of anxiety. Finally, cognitive workload during a given period of time was measured using the NASA Task Load Index (NASA-TLX) (Hart & Staveland, Citation1988). The NASA-TLX measures six domains of cognitive workload (Temporal Demands, Mental Demands, Physical Demands, Effort, Frustration, and Performance), each scored on a 100-point scale. By indicating how much each domain contributes to overall workload using the NASA-TLX Weighting form, participants provide weights for each of the six domains. Overall cognitive workload is calculated by assigning reported weights to each domain, resulting in the highest possible score of 100, which represents the highest possible cognitive workload.
Procedure
Upon arrival, participants reviewed and signed the informed consent. Participants then had time to ask additional questions as the researcher entered their information into the system and compensated them with $20. The researcher then prepared the three sites for electrode attachment by cleaning the skin with alcohol swabs and lightly abrading with NuPrep gel. Once participants were equipped and data was streaming into the BioLab software, participants viewed a 12-minute MATB-II tutorial produced by NASA, overviewing the goals of each subtask and the appropriate controls. Participants were randomly assigned to one of five experimental groups (). Participants in Groups 4 and 5 then watched a 12-minute video describing the tenets of emotional intelligence and their relationship with stress and coping in clinical practice. This video was co-written by all authors and featured one author (PW), a clinician and leading expert in the field.
Table 1. Experimental groups (Biofeedback = continuous visual HR; Augmented biofeedback = continuous visual HR and intermittent auditory coping instructions; Prior stress management training = prerecorded video covering emotional concepts of self-awareness and self-regulation and their relationship with stress and coping).
Following the tutorial(s), participants were allowed to ask additional questions and then began a 20-minute practice phase to get acquainted with MFMG and produce stable levels of performance on MATB-II (Venables & Fairclough, Citation2009). At the start of this phase of the study, the biofeedback display was initiated for those participants assigned to groups receiving visual biofeedback (Groups 2, 3, and 5). Within the first five minutes of the practice phase, participants in Group 3 received one auditory coping instruction. Unlike the medical questions prompted during the experimental phase, questions during this practice phase represented random trivia knowledge, to give participants the opportunity to fully learn the MATB-II subtasks. Participants then reported basic demographic details and responded to form Y-2 of the STAI (Spielberger & Gorsuch, Citation1983) to indicate their general anxiety level, a relatively stable trait.
While participants responded to these questionnaires, the researcher calculated average HR and standard deviation, taken from the middle 10-minute segment of the practice phase. The HR value representing one standard deviation above a participant’s average value was used to determine when auditory coping instructions would be administered during ensuing experimental conditions.
Following randomization into groups, the experimental phase involved completing two 10-minute versions of MFMG: one low-stress and one-high stress version, the order of which was counterbalanced. Following each condition, participants reported their self-perceived levels of anxiety via the short form of Y-1 of the STAI (Marteau & Bekker, Citation1992), and self-perceived levels of cognitive workload via the NASA-TLX scale (Hart & Staveland, Citation1988). At the conclusion of the study, participants weighed each of the six workload dimensions represented in the NASA-TLX ().
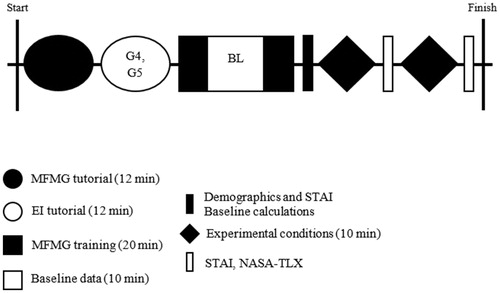
Figure 2. Timeline of basic procedure. Group 1 was the control group and experienced no intervention. Group 2 received a real-time visual biofeedback display during the MFMG training phase and the experimental conditions. Group 3 received the same biofeedback, and intermittent auditory coping instructions during the training and experimental phases. Group 4 received EI training prior to the MFMG training period, but received no intervention during the course of the training or experimental phases. Group 5 received the same EI training prior to the MFMG training period, and also received the same biofeedback display as Groups 2 and 3 during the MFMG training and experimental phases. G4, G5: Group 4, Group 5; BL: baseline; MFMG: Medically-Focused Multitasking Game; EI: emotional intelligence; STAI: State Trait Anxiety Inventory for Adults; NASA-TLX: NASA Task Load Index.
Analysis
Analysis of self-report, physiological, and performance data relied on calculating repeated measures, mixed model ANOVAs, including Stress Level as a within-subjects factor, and Group Assignment and Order of Condition as between-subject factors. One-tailed paired samples t-tests were also calculated to compare overall differences between high-stress and low-stress conditions, with the expectation that high-stress conditions would produce higher values among self-report measures and lower values among HRV and performance measures compared to low-stress conditions. Effect size metrics, including partial eta squared (ηp2) and Cohen d, were used to describe the magnitude of the difference between compared groups. All results are reported as significant when analysis yielded a p-value <.05.
Analysis of physiological signals to derive HRV values was conducted using MindWare Technologies LTD (Gahanna, OH) Heart Rate Variability Analysis Software. All ECGs were visually inspected in the HRV Software and ectopic beats were manually removed. Following inspection and filtering, vagally-mediated HRV components were calculated based on determining the inter-beat intervals between consecutive normal peaks, including three time-domain measures (RMSSD, pNN50, and SDNN) and one frequency-domain measure (HF power). Analysis of HRV measures in the time domain involves various calculations derived from detecting the time intervals between consecutive normal peaks in the raw ECG trace (Anonymous, Citation1996). Analysis of frequency-domain features, including the very low frequency power band (VLF Power; 0.0033–0.04 Hz), low frequency power band (LF Power; 0.04–0.15 Hz), the high frequency power band (0.15–0.40 Hz), and the low frequency to high frequency ratio (LF/HF Ratio), relies on spectral methods to discern variance within the data occurring as a function of its frequency (Anonymous, Citation1996). For the purposes of evaluating vagally-mediated measures specifically, VLF, LF, and the LF/HF Ratio were excluded from subsequent analysis. Statistical analysis of all data was then conducted using Microsoft Excel (Redmond, WA), JMP Pro 14 by SAS Institute, Inc. (Cary, NC, USA), and IBM SPSS Software 26.0 (Armonk, NY, USA).
The segment of data spanning from five to 15 minutes of the 20-minute practice phase was used to represent baseline values for physiological signals and MATB-II performance metrics. This was considered an appropriate baseline period because it intentionally excluded the first five minutes when participants were initially exploring the task, and the final five minutes when participants likely began to experience fatigue or boredom.
The average and standard deviations of each participant’s HR values were calculated during this 10-minute time period to generate a personalized index of physiological state, and these values were used as the threshold to trigger auditory coping instructions for participants in Group 3. A similar approach was utilized in previous research (Kennedy & Henrickson Parker, Citation2018b) to arrive at a personalized “red-line”, rather than applying a standard threshold value to all individuals. It is well established in the literature that physiological values (HR and HRV measures included) can vary greatly between and across individuals. Personalizing thresholds for each participant was done to acknowledge the presence and effect of individual differences.
For physiological data, the baseline values from the middle 10 minutes of the practice period were derived on an individual basis, and became the denominator when normalizing data from the experimental phases for each participant (Equation 1). This approach is similar to that used in previously published research (Schaaff & Adam, Citation2013).
(Equation 1)
(Equation 1)
Values representing MATB-II performance data were calculated separately for each subtask before combining them. For each subtask, a group average and group standard deviation were calculated, after which each participant’s performance on that subtask was transformed into a z-score (Equation 2).
(Equation 2)
(Equation 2)
To calculate an “overall MATB-II” score, each subtask z-score was summed and divided by the number of subtasks, to assign equal weight given to each subtask. Performance on medical questions was calculated strictly as a percentage and is reported separately from MATB-II performance, because baseline questions were not medically-oriented and thus are not representative of performance on experimental phases.
To determine the impact of the coping instructions on physiological response, additional analysis of participants in Group 3 also involved calculating values for the 10, 20, and 30 seconds preceding and the 10, 20, and 30 seconds following the delivery of an auditory coping instruction. A value representing the change in physiology for each time-domain HRV component was calculated by subtracting the value preceding the stimulus from the value following the stimulus.
Results
Preliminary analyses
Across experimental groups, demographics varied in terms of years of experience, but not gender ().
Table 2. Details on participant demographics.
One-tailed paired samples t-tests were conducted to compare all outcome measures between high and low stress conditions as a manipulation check to ensure the different versions of the task were successful at inducing disparate degrees of anxiety, cognitive workload, physiological stress, and task performance. Cohen’s d pooled variance was calculated to gauge the effect size of the independent variable. Self-report responses were partially completed for three participants, and all subsequent analyses excluded these data (Group 1: N = 8; Group 2: N = 9; Group 3: N = 8; Group 4: N = 9; Group 5: N = 8; total N = 42). Results show that there was a significant difference in the anxiety levels reported in high (M = 13.02, SD = 3.90) and low (M = 11.14, SD = 3.09) stress conditions; t(41)=5.66, p < .001, d = 0.534; and perceived cognitive workload between high (M = 68.02, SD = 17.24) and low (M = 50.73, SD = 13.96) stress conditions; t(41)=9.88, p < .001, d = 1.102.
Incomplete physiological data for six participants resulted in their exclusion in all subsequent analyses of physiological signals (Group 1: N = 7; Group 2: N = 9; Group 3: N = 8; Group 4: N = 7; Group 5: N = 8; total N = 39). Results of physiological data also reveal a significant difference in normalized RMSSD in high (M = 1.05, SD = 0.17) and low (M = 1.09, SD = 0.22) stress conditions; t(39)= −1.77, p = .043, d = 0.228; and normalized SDNN between high (M = 1.03, SD = 0.22) and low (M = 1.10, SD = 0.20) stress conditions; t(39)= −2.47, p = .009, d = 0.314.
Performance data were incomplete for three participants overall, and these participants were thus excluded from all performance analyses (Group 1: N = 8; Group 2: N = 9; Group 3: N = 8; Group 4: N = 9; Group 5: N = 8; total N = 42). Finally, performance results indicate a significant difference in overall performance in high (M = 0.10, SD = 0.67) and low (M = 0.63, SD = 0.58) stress conditions; t(41)= −11.39, p < .001, d = 0.833.
Although these results do not relate directly to specific hypotheses, they do support the validity of the task in inducing distinct levels of stress based on the version of the task completed.
Self-Report
The mixed model ANOVA comparing means from self-report data revealed significant main effects of Stress Level for both STAI and NASA-TLX reports, such that anxiety and cognitive workload were perceived to be significantly higher in the high-stress task compared to the low-stress task, regardless of other factors included in the model (STAI: Wilks’ Lambda = 0.545, F(1,32) = 26.71, p < .001, ηp2 = 0.455; NASA-TLX: Wilks’ Lambda = 0.224, F(1,32) = 110.59, p < .001, ηp2 = 0.776). No additional main effects of Group (STAI: F(4,32) = 1.25, p = .308, ηp2 = 0.136; NASA-TLX: F(4,32)=1.05, p = .397, ηp2=0.116) or interaction effects (STAI: Wilks; Lambda = 0.947, F(4,32 = 0.45, p = .771, ηp2 = 0.053; NASA-TLX: Wilks’ Lambda = 0.805, F(4,32) = 1.94, p = .128, ηp2 = 0.195) were revealed in this analysis.
Physiology
Results of the mixed model ANOVA analyzing HRV components revealed only the main effect of Stress Level for the normalized SDNN measure, indicating significantly lower normalized SDNN values among high-stress versus low-stress tasks (Wilks’ Lambda = 0.834, F(1,29)=5.79, p = .023, ηp2=0.166). No main effect of Group within the SDNN measure (F(4,29)=0.97, p = .442, ηp2=0.117), nor interaction effect (Wilks’ Lambda = 0.979, F(4,29)=0.958, ηp2=0.021) were detected. For remaining physiological measures, no other main effects of Stress Level (RMSSD: Wilks’ Lambda = 0.905, F(1,29)=3.06, p = .091, ηp2=0.095; pNN50: Wilks’ Lambda = 0.937, F(1,29)=1.97, p = .17, ηp2=0.063; HF: Wilks’ Lambda = 0.962, F(1,29)=1.16, p = .290, ηp2=0.038) or Group (RMSSD: F(4,29)=0.98, p = .434 ηp2=0.119; pNN50: F(4,29)=0.72, p = .585, ηp2=0.090; HF: F(4,29)=0.54, p = .711, ηp2=0.069), or interaction effects (RMSSD: Wilks’ Lambda = 0.962, F(4,29)=0.29, p = .885 ηp2=0.038; pNN50: Wilks’ Lambda = 0.924, F(4,29)=0.60, p = .668, ηp2=0.076; HF: Wilks’ Lambda = 0.867, F(4,29)=1.03, p = .411, ηp2=0.124). were detected
Ultra-short term physiology
Additional analyses of physiological components compared 10-, 20-, and 30-second time windows directly preceding and following coping instruction delivery. Significant differences between different time windows representing the same stress level would indicate a lack of sensitivity of the ultra-short time calculation. This analysis was performed for time-domain components only (RMSSD, SDNN, and pNN50). The HF power band was excluded from ultra-short term physiological analysis due to software limitations. In addition to the limitations of our own software program, recent literature has also emphasized the general inability to compute many spectral analyses on ultra-short time scales, suggesting recordings of at least ten times longer than the wavelength of the lower frequency limit be employed (Castaldo, Montesinos, Melillo, James, & Pecchia, Citation2019). For the HF band, this eliminates time windows shorter than one minute. One-tailed paired Student’s t-tests were calculated to compare the mean normalized HRV values (RMSSD, SDNN, and pNN50) for each duration (10 s, 20 s, and 30 s) before and after coping instructions (N = 39 coping instructions delivered). Using the values representing a change in physiology before and after coping instructions for each HRV value, we also conducted mixed model repeated measures ANOVAs, including Time Window as a within-subjects factor and Stress Level as a between-subjects factor.
Normalized RMSSD
While there was a significant difference in the normalized RMSSD values observed before (M = 43.45, SD = 23.54) and after (M = 57.80, SD = 27.54) coping instruction delivery for the 10-second time windows (t(38)= −2.47, p = .0078, d = 0.560), there were no significant differences observed when comparing normalized RMSSD values spanning 20- and 30-second time windows.
The repeated measures ANOVA indicated a significant effect on normalized RMSSD value; F(2,74)=22.658, p < .001. Post hoc comparisons using the Tukey HSD test indicated that the mean change in normalized RMSSD observed in each pair differed significantly, with the highest p-value revealed as .016. This indicates that the change in RMSSD values after coping instructions compared to before coping instructions differed depending on the duration of data selected. In other words, 10-, 20-, and 30-second time windows from high-stress and low-stress conditions representing the RMSSD contrast after receiving an auditory coping instruction differed significantly, indicating a lack of sensitivity in ultra-short term data for this HRV component.
Normalized SDNN
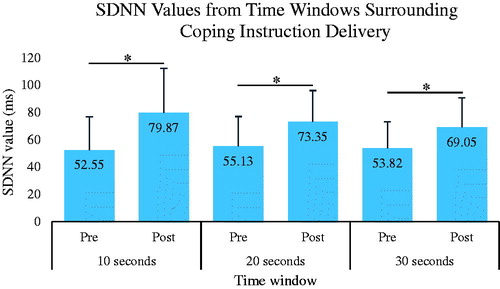
Analysis of normalized SDNN values revealed a significant difference before (M = 52.55) and after (M = 79.87) coping instruction delivery for the 10-second time windows (t(38)= −4.21, p < .0001, d = 0.952); before (M = 55.13) and after (M = 73.35) coping instruction delivery for the 20-second time windows (t(38)= −3.61, p = .0003, d = 0.818); and before (M = 53.82) and after (M = 69.05) coping instruction delivery for the 30-second time windows (t(38)= −3.29, p = .0008, d = 0.745); ().
Figure 3. Ultra-short term HRV analysis reveals a significant increase in SDNN values, indicative of a decrease in stress state, immediately following an auditory coping instruction in Group 3 compared to those values immediately preceding the instruction for 10-second (p < .0001), 20-second (p < .05), and 30-second time windows (p < .05). SDNN: standard deviation from normal-to-normal.
The repeated measures ANOVA indicated a significant effect on normalized SDNN value; F(2,74)=7.942, p = .001. Post hoc comparisons using the Tukey HSD test indicated that the mean change in normalized SDNN observed in each pair differed significantly, with the highest p-value revealed as 0.016. The only exception in this pairwise comparison was a lack of statistical difference between 20-second and 30-second time windows (p = .113). Similarly to the findings of the repeated measure ANOVA comparing means for RMSSD values, this result indicates a lack of sensitivity of 10-second time windows to represent the same data as 20- and 30-second time windows, but unlike RMSSD findings, we can conclude that values calculated at 20- and 30-second durations are equally representative.
Normalized pNN50
No significant differences between normalized pNN50 values before compared to after coping instruction delivery were detected for any of the time window durations analyzed.
The repeated measures ANOVA indicated a significant effect on normalized pNN50 value; F(2,74)=21.908 p < .001. Post hoc comparisons using the Tukey HSD test indicated that the mean change in normalized pNN50 observed in each pair differed significantly, with the highest p-value revealed as <.001. The only exception in this pairwise comparison was a lack of statistical difference between 20-second and 30-second time windows (p = .638).
Performance
Performance analysis calculated mixed-model repeated measure ANOVAs for medical question accuracy and the combined MATB-II score. There were no statistical differences observed within the medical questions data. However, MATB-II analysis revealed a main effect of Stress Level, such that the high-stress task produced significantly worse outcomes than the low-stress task across all factors (Wilks’ Lambda = 0.212, F(1,32)=118.82, p < .001, ηp2=0.788). No main effect of Group (F(4,32)=0.78, p = .548, ηp2=0.089) or interaction effects (Wilks’ Lambda = 0.864, F(4,32)=1.26, p = .305, ηp2=0.136) were detected.
Discussion
Overall the results of this exploratory study emphasize the validity of the task utilized for the specialized demographic recruited, despite its low ecological validity and small sample size. Additionally, the results support future research investigating the potential role of discrete behavioral interventions in managing physiological indicators of stress.
Responses to both self-report instruments, normalized RMSSD, normalized SDNN, and performance measures indicated that the high-stress condition was more anxiety-inducing, cognitively demanding, physiologically stressful, and difficult than the low-stress condition when collapsing all groups. The lack of main effects found between Groups, and the lack of interaction effects, suggest a very minimal and non-significant impact of the intervention components on outcome measures of interest.
Data gathered from Group 3 participants, representing the only group receiving discrete stimuli embedded into the overall task as a part of the cognitive intervention, presented the opportunity to take advantage of time-locked psychophysiological approaches to analyze HRV components directly surrounding stimuli. Other groups received intervention components either before the task began (Groups 4 and 5, receiving emotional intelligence training), or continuously over the course of the entire task (Groups 2 and 3, receiving visual biofeedback during participation). The addition of intermittent coping instructions into the design of Group 3 enabled a more fine-grained analysis relying on innovative analytic techniques, i.e. ultra-short term HRV analysis. Group 3 was also the only experimental group to receive auditory input as a component of the intervention. Previous work has demonstrated the detrimental effect of domain-specific auditory distractors on workload and performance, including intra-operative phone calls and verbalized patient discomfort (Weigl et al., Citation2016) as well as music and case-irrelevant conversation (Pluyter, Buzink, Rutkowski, & Jakimowicz, Citation2010). Although we hypothesized that this experimental group would outperform others due to the high degree of cognitive aid, it could have been the cost of distractions derived from the excessive inputs themselves that masked any potential benefit.
Literature supports that the short-term RMSSD and SDNN components of HRV reflect parasympathetic activity (McCraty & Shaffer, Citation2015; Shaffer & Ginsberg, Citation2017; Shaffer et al., Citation2014). The significantly higher values across these components observed in the low-stress conditions compared to high-stress conditions in this study corroborate previous findings on an ultra-short term time scale. Further, while multiple ultra-short term physiological measures were gathered, only the normalized SDNN and pNN50 measures revealed a consistent trend across a subset of time windows, indicating stability in the measure, whether calculated according to 20- or 30-second intervals. This suggests an insensitivity to time windows as narrow as 10 seconds, but preservation of the measure with moderately longer time windows of analysis, thus lending itself to more reliable interpretation for longer—but still ultra-short—HRV analysis for SDNN and pNN50 components. Because these results show that the magnitude of change in the 20-second time window is not statistically different from that of the 30-second time window, our data suggest stability in the both SDNN and pNN50 measures across ultra-short time scales.
This finding is compelling and contributes substantially because previous work demonstrates that SDNN is a function of the recording length, such that the longer the recording, the larger and more stable the SDNN values (Anonymous, Citation1996; Nunan, Sandercock, & Brodie, Citation2010; Shaffer & Ginsberg, Citation2017). Thus we could have expected SDNN values to differ significantly when comparing recording lengths of varying durations. The findings presented here can therefore be considered robust and meaningful. SDNN was the only HRV component analyzed in the ultra-short term time windows that demonstrated significant differences in values before and after coping instruction delivery among Group 3 participants across all durations and at the same time, proved to be consistent when comparing values across longer durations (20 and 30 seconds). This is in contrast to pNN50 values, which revealed no differences before and after coping instruction delivery, and RMSSD values which differed significantly based on all time windows analyzed.
These data support that the delivery of and adherence to auditory coping instructions has an immediate and beneficial effect on ultra-short term physiological indicators of stress. Using SDNN as the index of stress, the findings show that this benefit is maintained over 20- and 30-second time windows.
When considering a more comprehensive framework integrating theory and evidence, the physiological recovery detected via ultra-short term analysis of HRV components is reassuring and has potential to reach beyond the realm of basic physiological responses. The neurovisceral integration model is one framework with extensive support from empirical evidence, that suggests that certain neural structures are inextricably linked to cardiovascular physiological responses and cognitive functioning (Thayer, Hansen, Saus-Rose, & Johnsen, Citation2009). According to this model, a broad network of associated neural structures, which are affected by changes in the cardiovascular system, enables flexibility and adaptability in the face of environmental demands. Maladaptive physiological and cognitive patterns as well as behaviors emerge when this network is uncoupled and not working appropriately. Along these lines, we can expect that redirecting behaviors to more adaptive actions—by imposing coping mechanisms, for example—could be reflected in vagal indicators of cardiovascular physiology as well as performance outcomes.
While the results from this exploratory research do not reveal a direct link between these variables, the results of the ultra-short term physiological analysis do support immediate vagally-mediated physiological change in response to a behavioral adaptation. One remaining piece that was not identified in this work, but should be explored more thoroughly through future work, is the manifestation of these changes as improvements in executive cognitive functioning and overall performance.
This study had a number of limitations. The primary limitation was the small sample size, which increased the probability of under-powered results, increased the likelihood of producing Type I errors, and greatly limits the generalizability and the strength of interpretability. Despite this limitation, one might consider the group of late-stage medical students and early career residents to be a ‘culturally distinct’ group. Indeed, not many people in the world are surgical residents or fourth year medical students. It may be therefore short-sighted and inappropriate to attempt to generalize findings too broadly, since this research was designed to address stress management in a highly specialized population (Frazier & Parker, Citation2018; Kennedy & Henrickson Parker, Citation2018a). Regardless, results must be taken with caution, and this study should be considered exploratory.
Additionally, although a strength of this evaluation is that it was done with medically familiar participants and the researchers targeted recruiting those with surgical experience or interest, many participants were at an early stage of their career. While we attempted to mimic the conditions common to a stressful operation with MFMG, it still likely lacked ecological validity. For the purposes of this work, we felt that a high level of experimental control was necessary. We effectively induced stress according to all measures taken, evidenced by the manipulation checks performed across all measures, but the setting and task were still unrelated to the daily workflow of healthcare practitioners.
Future work should recruit larger sample sizes to obtain adequate power. Further, greater sample sizes would enable parsing out individual characteristics to determine the factors driving the observed variability within conditions. Overall, the opportunities to expand the core concepts of this intervention are promising, especially due to the affordability, timeliness, and unobtrusive approach utilized with sensor technology today. Future work should consider the application of coping instructions, specifically adapted for the domain and workflow, in other high-risk, high-consequence settings. A higher degree of realism and generalizability could be achieved in the healthcare system by more closely approximating clinical care through simulation. Simulation-based training in healthcare can improve performance on clinical tasks while introducing learners to high levels of stress and adverse events, all in a safe environment (Feins et al., Citation2017). The emphasis on learning to cope appropriately with the stress and adverse events presented ensures that a stress management training program with embedded behavioral coping instructions could be a suitable addition to simulation-based training.
Conclusions
This study showed that adhering to coping instructions, intended to promote behavioral adaptation to the physiological stress experienced, appeared to result in an observable benefit on an ultra-short time scale. Ultra-short term HRV analysis of these data suggest that taking a deep breath as a means of responding to increasing stress may have decreased the physiological indicators of stress triggering the adaptive response. In doing so, and with frameworks such as the neurovisceral integration theory in mind, overall executive functioning and subsequently task performance could be enhanced, but require future research.
Informed consent
This research involved human participants. The experiments were approved by and conducted in accordance with the guidelines of the Carilion Clinic Institutional Review Board with subjects providing written informed consent.
Disclosure statement
The authors report no conflicts of interest.
Additional information
Funding
References
- Afergan, D., Hincks, S.W., Shibata, T., & Jacob, R.J.K. (2015). Phylter: A system for modulating notifications in wearables using physiological sensing. Lecture Notes in Computer Science (Including Subseries Lecture Notes in Artificial Intelligence and Lecture Notes in Bioinformatics), 9183, 167–177. doi:10.1007/978-3-319-20816-9_17
- Al Osman, H., Eid, M., & Saddik, A. (2013). U-biofeedback: A multimedia-based reference model for ubiquitous biofeedback systems. Multimedia Tools and Applications, 72, 1–26. doi:10.1007/s11042-013-1590-x
- Baek, H.J., Cho, C.-H., Cho, J., & Woo, J.-M. (2015). Reliability of ultra-short-term analysis as a surrogate of standard 5-min analysis of heart rate variability. Telemedicine and e-Health, 21, 404–414. doi:10.1089/tmj.2014.0104
- Castaldo, R., Montesinos, L., Melillo, P., James, C., & Pecchia, L. (2019). Ultra-short term HRV features as surrogates of short term HRV: A case study on mental stress detection in real life. BMC Medical Informatics and Decision Making, 19, 1–13. doi:10.1186/s12911-019-0742-y
- Comstock, J.R., & Arnegard, R.J. (1992). Multi-attribute task battery for human operator workload and strategic behavior research. NASA Technical Memorandum, Technical Report. NASA Langley Research Center, Hampton, VA, USA.
- Dias, R.D., Ngo-Howard, M.C., Boskovski, M.T., Zenati, M.A., & Yule, S.J. (2018). Systematic review of measurement tools to assess surgeons’ intraoperative cognitive workload. British Journal of Surgery, 105, 491. doi:10.1002/bjs.10795
- Feins, R.H., Burkhart, H.M., Conte, J.V., Coore, D.N., Fann, J.I., Hicks, G.L., … Mokadam, N.A. (2017). Simulation-based training in cardiac surgery. The Annals of Thoracic Surgery, 103, 312–321. doi:10.1016/j.athoracsur.2016.06.062
- Frazier, S.E., & Parker, S.H. (2018). Measurement of physiological responses to acute stress in multiple occupations: A systematic review and implications for front line healthcare providers. Translational Behavioral Medicine, 9(1):158–166. doi:10.1093/tbm/iby019
- Hart, S.G., & Staveland, L.E. (1988). Development of NASA-TLX (Task Load Index): Results of empirical and theoretical research. Advances in Psychology, 52, 139–183. doi:10.1016/S0166-4115(08)62386-9
- Jamieson, J.P., Mendes, W.B., & Nock, M.K. (2013). Improving acute stress responses: The power of reappraisal. Current Directions in Psychological Science, 22, 51–56. doi:10.1177/0963721412461500
- Kennedy, L., & Henrickson Parker, S. (2017). Making MATB-II medical: Pilot testing results to determine a novel lab-based, stress-inducing task. Proceedings of the International Symposium on Human Factors and Ergonomics in Health Care, 6(1), 201–208. doi:10.1177/2327857917061044
- Kennedy, L., & Henrickson Parker, S. (2018a). Biofeedback as a stress management tool: A systematic review. Cognition. Technology & Work, 21(2), 161–190. doi:10.1007/s10111-018-0487-x
- Kennedy, L., & Henrickson Parker, S. (2018b). Timing of coping instruction presentation for real- time acute stress management Long-term implications for improved surgical performance. Journal of Healthcare Informatics Research, 2(1–2), 111–131. doi:10.1007/s41666-018-0016-y
- Kim, D., Seo, Y., Kim, S., & Jung, S. (2008). Short term analysis of long term patterns of heart rate variability in subjects under mental stress. 2008 International Conference on BioMedical Engineering and Informatics, 27–30 May, 1411–1415, Sanya, China. doi:10.1109/BMEI.2008.272
- Lehrer, P. (2013). History of heart rate variability biofeedback research: A personal and scientific voyage. Biofeedback, 41, 88–97. doi:10.5298/1081-5937-41.3.03
- Lehrer, P., & Vaschillo, E. (2008). The future of heart rate variability biofeedback. Biofeedback, 36, 11–14.
- Marteau, T.M., & Bekker, H. (1992). The development of a six-item short-form of the state scale of the Spielberger State-Trait Anxiety Inventory (STAI). British Journal of Clinical Psychology, 31, 301–306. doi:10.1111/j.2044-8260.1992.tb00997.x
- McCraty, R., & Shaffer, F. (2015). Heart rate variability: New perspectives on physiological mechanisms, assessment of self-regulatory capacity, and health risk. Global Advances in Health and Medicine, 4, 46–61. doi:10.7453/gahmj.2014.073
- Munoz, M.L., van Roon, A., Riese, H., Thio, C., Oostenbroek, E., Westrik, I., … Snieder, H. (2015). Validity of (Ultra-)Short recordings for heart rate variability measurements. PLoS One, 10, e0138921–15. doi:10.1371/journal.pone.0138921
- Nunan, D., Sandercock, G.R.H., & Brodie, D.A. (2010). A quantitative systematic review of normal values for short-term heart rate variability in healthy adults. Pacing and Clinical Electrophysiology, 33, 1407–1417. doi:10.1111/j.1540-8159.2010.02841.x
- Nussinovitch, U., Elishkevitz, K.P., Katz, K., Nussinovitch, M., Segev, S., Volovitz, B., & Nussinovitch, N. (2011). Reliability of ultra-short ECG indices for heart rate variability. Annals of Noninvasive Electrocardiology, 16, 117–122. doi:10.1111/j.1542-474X.2011.00417.x
- Pina, L., Rowan, K., Roseway, A., Johns, P., Hayes, G. R., & Czerwinski, M. (2014). In situ cues for ADHD parenting strategies using mobile technology. Proceedings - PERVASIVEHEALTH 2014: 8th International Conference on Pervasive Computing Technologies for Healthcare, 20–23 May, 17–24, Oldenburg, Germany. doi:10.4108/icst.pervasivehealth.2014.254958
- Pluyter, J.R., Buzink, S.N., Rutkowski, A.F., & Jakimowicz, J.J. (2010). Do absorption and realistic distraction influence performance of component task surgical procedure? Surgical Endoscopy, 24, 902–907. doi:10.1007/s00464-009-0689-7
- Salahuddin, L., Cho, J., Jeong, M. G., & Kim, D. (2007). Ultra Short Term Analysis of Heart Rate Variability for Monitoring Mental Stress in Mobile Settings. Conference proceedings: Annual International Conference of the IEEE Engineering in Medicine and Biology Society, 2007, 4656–4659. doi:10.1109/IEMBS.2007.4353378
- Schaaff, K., & Adam, M.T.P. (2013). Measuring emotional arousal for online applications: Evaluation of ultra-short term heart rate variability measures. 2013 Humaine Association Conference on Affective Computing and Intelligent Interaction, 2–5 Sept, 362–368, Geneva, Switzerland. doi:10.1109/ACII.2013.66
- Shaffer, F., & Ginsberg, J.P. (2017). An overview of heart rate variability metrics and norms. Frontiers in Public Health, 5, 1–17. doi:10.3389/fpubh.2017.00258
- Shaffer, F., McCraty, R., & Zerr, C.L. (2014). A healthy heart is not a metronome: An integrative review of the heart’s anatomy and heart rate variability. Frontiers in Psychology, 5, 1–19. doi:10.3389/fpsyg.2014.01040
- Spielberger, C.D., & Gorsuch, R.L. (1983). State-trait anxiety inventory for adults: Manual, instrument, and scoring guide. Menlo Park: Mind Garden, Inc.
- Task Force. (1996). Heart rate variability: Standards of measurement, physiological interpretation and clinical use. Task Force of the European Society of Cardiology and the North American Society of Pacing and Electrophysiology. European Heart Journal, 17, 354–381. doi:10.1161/01.CIR.93.5.1043
- Thayer, J.F., Hansen, A.L., Saus-Rose, E., & Johnsen, B.H. (2009). Heart rate variability, prefrontal neural function, and cognitive performance: The neurovisceral integration perspective on self-regulation, adaptation, and health. Annals of Behavioral Medicine, 37, 141–153. doi:10.1007/s12160-009-9101-z
- Thong, T., Li, K., McNames, J., Aboy, M., & Goldstein, B. (2003). Accuracy of ultra-short heart rate variability measures. Proceedings of the 25th Annual International Conference of the IEEE Engineering in Medicine and Biology Society (IEEE Cat. No.03CH37439), 17–21 Sept, 2424–2427, Cancun, Mexico. doi:10.1109/IEMBS.2003.1280405
- Venables, L., & Fairclough, S.H. (2009). The influence of performance feedback on goal-setting and mental effort regulation. Motivation and Emotion, 33, 63–74. doi:10.1007/s11031-008-9116-y
- Weigl, M., Stefan, P., Abhari, K., Wucherer, P., Fallavollita, P., Lazarovici, M., … Catchpole, K. (2016). Intraoperative disruptions, surgeon’s mental workload, and technical performance in a full-scale simulated procedure. Surgical Endoscopy, 30, 559–566. doi:10.1007/s00464-015-4239-1
- Wilson, G.F., & Russell, C.A. (2007). Performance enhancement in an uninhabited air vehicle task using psychophysiologically determined adaptive aiding. Human Factors: The Journal of the Human Factors and Ergonomics Society, 49, 1005–1018. doi:10.1518/001872007X249875
- Wu, M., Cao, H., Nguyen, H. L., Surmacz, K., & Hargrove, C. (2015). Modeling perceived stress via HRV and accelerometer sensor streams. Conference proceedings: Annual International Conference of the IEEE Engineering in Medicine and Biology Society, 2015, 1625–1628. doi:10.1109/EMBC.2015.7318686