
 ?Mathematical formulae have been encoded as MathML and are displayed in this HTML version using MathJax in order to improve their display. Uncheck the box to turn MathJax off. This feature requires Javascript. Click on a formula to zoom.
Abstract
Allostatic load is the wear-and-tear organisms accumulate due to senescence and stress; it is measured by combining biomarkers from multiple somatic systems into allostatic load indices (ALIs). Frequently used in human research, ALIs have shown consistent results across samples despite different biomarkers and methods. However, determining optimal models likely is necessary if ALIs are to be feasible research tools in other species. Herein, we build on prior research in western lowland gorillas to explore one potential method for determining which biomarkers may be best for estimating allostatic load. After narrowing down which biomarkers to include using a combination of forward stepwise regression and independent biomarker associations with project variables, we estimated allostatic load using both the traditional one-tailed quartile method as well as a multi-method approach. There was a significant positive association between allostatic load and triglycerides, but not cholesterol, both of which are commonly used as diagnostic markers of poor health. Using binomial generalized linear models, a one-unit increase in allostatic load was associated with increased risk of all-cause morbidity and mortality, but reduced risk of cardiac disease. Although conclusions were similar, compared to our original ALIs, these new ALIs had weaker effect sizes and poorer relative goodness of fit, suggesting this method for identifying the best possible list of biomarkers to include in an index was not effective. This report continues the development of ALIs as a clinical tool in wildlife while systematically testing one possible method for determining an optimal ALI for a particular species.
Introduction
Organisms respond dynamically to their environment. Physiological responses, termed allostasis (Sterling & Eyer, Citation1988), range from routine fluctuations (e.g. during physical activity) to temporal shifts across seasons and life history stages (e.g. migration) to dealing with unexpected challenges (e.g. predation). Allostatic states are characterized by changes in activity across multiple physiological systems (McEwen & Wingfield, Citation2003; Korte et al., Citation2005). Typically, allostasis is adaptive, ending when the stressor is removed. However, when repeatedly or chronically activated, or when there is failure to habituate or shut off the response, costs can ensue (McEwen Citation1998). This wear-and-tear is allostatic load (McEwen & Stellar Citation1993). Allostatic load accumulates over the lifespan and can eventually result in allostatic overload and disease pathology. Many negative health outcomes are associated with allostatic overload in humans, including arthritis, cardiovascular disease, diabetes, frailty, hypertension, obesity and overweight, and increased mortality risk (for reviews, see Beckie, Citation2012; Edes & Crews, Citation2017; Juster et al., Citation2010). Because the shifts in biomarkers during allostatic states can be long-lasting, combining biomarkers from across somatic systems into a single index can provide a window into an individual’s allostatic load. These composites, or allostatic load indices (ALIs), have been constructed using a variety of biomarkers and methods since they were first operationalized over two decades ago (Seeman et al., Citation1997).
The lack of a “gold standard” for constructing ALIs has been criticized (e.g. Delpierre et al., Citation2016), yet the strength of this measure is demonstrated by consistent associations with disease and mortality risk despite the variety of biomarkers and methods used (Edes & Crews, Citation2017; Prior et al., Citation2018; Wallace & Harville, Citation2013). This robustness and flexibility also are positive features when extending ALIs to wildlife. While human studies often use large, preexisting datasets (e.g. MacArthur Studies of Successful Aging), these are unavailable for most species. Moreover, the need for invasive sampling, limited tissue availability, and assay costs present additional barriers for nonhuman applications. As such, research on allostatic load in wildlife will be more feasible with methods for determining optimal ALIs for individual species. Unfortunately, there do not seem to be any attempts to quantitatively determine which biomarkers to use or how allostatic load should be estimated.
Herein, we build on our prior research in western lowland gorillas (Gorilla gorilla gorilla; Edes et al., Citation2016a, Citation2016b, Citation2018a) to explore one potential method for selecting among biomarkers and methods for estimating allostatic load. While previous researchers had used individual biomarkers as simple proxies of allostatic load (for review, see Edes & Crews, Citation2017; Edes et al., Citation2018b), this was the first replication of human allostatic load methodology in another species. We demonstrated age, sex, stressful events, parity, and differences in rearing were associated with differences in allostatic load in gorillas, and, in turn, that having higher allostatic load was positively associated with potential indicators of morbidity (e.g. triglycerides), higher in those with chronic conditions, and predicted mortality risk. Having since assayed additional biomarkers, we evaluate this potential method for selecting an optimal ALI by comparing predictions for health risks made with the new ALI to those made using our original index.
Methods
Subjects
Data on western lowland gorillas from three North American zoos (Columbus Zoo and Aquarium, Louisville Zoo, Omaha’s Henry Doorly Zoo) were included in our sample (n = 63). The sample contained 30 males ranging in age from 6 to 52 years ( = 21.5 years, SD = 11.1 years) and 33 females ranging in age from 7 to 52 years (
= 24.1 years, SD = 14.1 years). There was no significant difference in age between zoos, between males and females at each zoo, or between males and females overall (data not shown), so all gorillas were combined into pooled samples (see ‘Quantitative analyses’ for the two methods used to pool samples). This study was conducted using previously banked serum samples along with husbandry reports and medical records provided by each zoo. This study complied with The Ohio State University Animal Care and Use Committee (IACUC) protocols and was approved by each participating institution.
Selecting biomarkers for the ALI
The original ALI constructed for gorillas contained albumin, corticotropin-releasing hormone (CRH), cortisol, dehydroepiandrosterone-sulfate (DHEA-S), glucose, interleukin-6 (IL-6), and tumor necrosis factor-alpha (TNF-α; Edes et al., Citation2016a, Citation2016b). In a follow-up which extended the research from one zoo to three (Edes et al., Citation2018a), we replaced glucose with the homeostasis model assessment of insulin resistance (HOMA-IR, calculated using glucose and insulin; Matthews et al., Citation1985), a longer-term indicator of metabolic function than glucose alone. Following these initial ALIs, we assayed additional biomarkers and analyzed models containing cholesterol, creatinine, C-reactive protein (CRP), and triglycerides. We were interested in determining which combination of biomarkers would best reflect physiological dysregulation and predict disease and mortality risk in western lowland gorillas and selected from the available biomarkers using the following process.
First, Pearson correlations were used to evaluate the relative equivalency of ALIs with fewer biomarkers against ones with more biomarkers. We constructed ALIs containing 7–11 biomarkers (original seven biomarkers with the addition of CRP, creatinine, cholesterol, and triglycerides one-by-one) using quartile and multi-method approaches (see ‘Methods for constructing ALIs’) for both pooled samples (see ‘Quantitative analyses’). All correlations were greater than 0.90 and all models explained >80% of the variance in one another (data not shown; Edes, Citation2018), indicating fewer biomarkers can be used without compromising the robusticity of associations between AL and outcomes of interest. This criterion was used recently to compare robustness of skeletal frailty indices (SFIs; Marklein & Crews, Citation2017), which are theoretically and methodologically similar to ALIs.
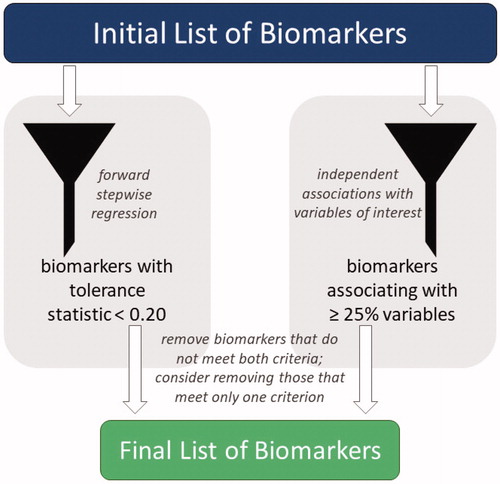
To refine the list of biomarkers included, we first removed cholesterol (n = 46) and triglycerides (n = 33), the two biomarkers with the most missing values, allowing us to maintain the full sample for all analyses. Then, using forward stepwise regression, the tolerance of each biomarker within the ALI was examined; biomarkers with tolerance ≤0.20 were considered for removal (). When the original ALI (Edes, Citation2018; Edes et al., Citation2016a, Citation2016b) was analyzed, tolerance levels for all biomarkers were above the threshold, but the addition of other biomarkers caused CRP and TNF-α to fall below 0.20, indicating they may be less integral for estimating allostatic load in gorillas. As whether or not biomarkers independently associate with predictors and outcomes of interest may help researchers identify which are most important, we next examined associations of each biomarker with each project variable (e.g. age, sex, mortality; data not shown; Edes, Citation2018). Biomarkers that were independently associated with <25% of the tested variables also were considered for removal (). DHEA-S and CRP were below that threshold, matching only 14% and 21% of project variables, respectively. As it met both thresholds, CRP was removed. DHEA-S also was removed due to its association with only one project variable. TNF-α only had low tolerance when CRP was included in the ALI; therefore, it was retained in the index since CRP had been removed.
Figure 1. The full list of available biomarkers was refined into a final list of biomarkers to include in an allostatic load index using a combination of forward stepwise regression and independent biomarker associations. Biomarkers with a tolerance statistic >0.20 that associated independently with fewer than 25% of project variables were removed from the allostatic load index; those that met only one criterion also were considered for removal.
Biomarker assays
Our final ALI included albumin, cortisol, CRH, creatinine, insulin resistance (HOMA-IR), IL-6, and TNF-α. All biomarkers were measured from serum collected from gorillas under anesthesia between 1991 and 2015. Values for albumin, cholesterol, creatinine, glucose, and triglycerides were obtained from medical records, while other biomarkers were assayed from samples collected during the same exams and cryopreserved at −80°C. Samples remained frozen until they were assayed by The Ohio State University Center for Clinical and Translation Science: Clinical Research Center in 2014 and 2016. While sample degradation can present an issue with long-term storage, studies indicate steroid hormones (cortisol; Harder, Citation2012; Orentreich et al., Citation1984), CRH (Latendresse & Ruiz, Citation2008; Linton et al., Citation1986), and inflammatory cytokines (IL-6 and TNF-α; Tworoger & Hankinson, Citation2006) maintain their integrity when cryopreserved at ultralow temperatures without multiple freeze-thaw cycles. Unfortunately, no data are available on the integrity of insulin in long-term storage at ultralow temperatures.
Assays for CRH, cortisol, insulin, IL-6, and TNF-α were conducted using commercially available kits. CRH was measured by radioimmunoassay (RK-019-06, Phoenix Pharmaceuticals, California, USA). As previously described (Ellis et al., Citation1988; Linton et al., Citation1995), CRH was extracted prior to assay using ice-cold methanol to remove interfering binding proteins, then reconstituted to its original volume for assay. CRH measures were log-transformed due to positive skew, which normalized the data and stabilized the variance. Cortisol was measured using solid phase, competitive chemiluminescent enzyme immunoassay with an Immulite 1000. Insulin was assayed using a solid-phase, enzyme-labeled chemiluminescent immunometric assay with an Immulite 1000. Finally, solid-phase enzyme-linked immunosorbent assay (ELISA) was used for IL-6 (HS600B, R and D Systems, Minnesota, USA) and TNF-α (HSTA00D, R and D Systems, Minnesota, USA). All samples analyzed were above the lower limit of sensitivity for each assay, and CV’s are within the 10% and 15% acceptable thresholds for intra- and inter-assay variability, respectively.
Methods for constructing ALIs
ALIs were constructed using the one-tailed quartile method (abbreviated ALQ), which was the first allostatic load methodology proposed (Seeman et al., Citation1997) and remains the most frequently used (Edes & Crews, Citation2017), as well as a multi-method approach (abbreviated ALM). In the quartile method, the distribution of each biomarker is divided into quartiles, and either the first or fourth quartile is designated as high-risk (e.g. physiological dysregulation is reflected by low levels of albumin but high levels of IL-6). For any biomarker with p ≤ 0.10 between means for males and females (t-test; data not shown), sex-specific quartiles were determined (). Herein, the fourth quartile was designated as high risk for all except albumin. The number of biomarkers each gorilla had in a high-risk quartile reflects its allostatic load score. With seven biomarkers in the ALI, scores could range from 0 (i.e. no biomarkers considered high risk) to 7 (i.e. all biomarkers considered high risk).
Table 1. High-risk quartile boundaries for biomarkers included in allostatic load indices combined using a one-tailed quartile approach and a multi-method, split quartile approach (top and bottom 12.5%) for cortisol.
While physiological dysregulation frequently is characterized by either low or high levels, for some biomarkers the direction of the dysregulated-induced shift depends on the individual. For example, both hypo- and hypercortisolism may indicate chronic stress (Badanes et al., Citation2011; Heim et al., Citation2000; Raison & Miller, Citation2003). Therefore, we also used a multi-method approach developed in our previous research (Edes, Citation2018; Edes et al., Citation2016a, Citation2016b) to integrate both one-tailed and two-tailed approaches, depending on the biomarker. A one-tailed quartile was used for most biomarkers, but for cortisol, a two-tailed split quartile was used (top and bottom 12.5% of the distribution) to reflect that dysregulation of this biomarker can be characterized by either high or low levels.
Outcome variables
Data on health outcomes for each individual were obtained from zoo medical records. Given their use by physicians and veterinarians as indicators of disease risk, cholesterol and triglycerides were used as potential indicators of morbidity when they were available. We also collected data on the presence or absence of chronic conditions (e.g. cardiac disease, arthritis, cancer). Age at death was recorded for gorillas in the sample who are deceased.
Quantitative analyses
Gorillas from the three zoos were pooled in two different ways. Pooled Sample 1 (PS1) assumes each zoo is an independent sample and preserves variation between zoos by estimating allostatic load at each zoo prior to combining allostatic load scores into a single sample. Alternatively, assuming all zoo-housed North American gorillas are part of one population, Pooled Sample 2 (PS2) combined all biomarker data prior to determining the biomarker cut-points for estimating allostatic load scores.
Associations of allostatic load with cholesterol and triglycerides were analyzed using linear regression; gorillas with missing values for either lipid factor were excluded from that respective analysis. We used t-tests to determine if there were significant differences in allostatic load between gorillas with or without chronic conditions, with or without cardiac disease, and those who were alive versus deceased at the time of analysis. Relationships between allostatic load and morbidity and mortality risk were examined using odds ratios as determined through binomial generalized linear models (GLMs) with a logit link. First, because allostatic load increases with age and the two variables often are significantly associated, we assessed multicollinearity by estimating the variance inflation factor. Multicollinearity was not observed between age and allostatic load for any model tested (VIF = 1.13–1.17). Next, because disease and mortality risk may be predicted by older age and vary by sex, we analyzed baseline models containing only these two variables. Given the exploratory nature of this work, we analyzed models containing only allostatic load to examine associations with each health outcome independently. Finally, if age and/or sex had p ≤ 0.10 in the baseline model, they were added into a full model alongside allostatic load. Thus, the full models for all-cause morbidity and cardiac disease contained age, sex, and allostatic load, while those for mortality included just age and allostatic load. As our previous analyses of the original ALI were conducted using different quantitative methods, we also re-analyzed those indices using these methods to allow for more accurate comparisons. Relative goodness of fit was determined with Akaike’s information criterion (AIC), which was corrected for small sample sizes (AICc). As adding zoo ID as a random effect resulted in similar or higher AICc values, this variable was not included in any models. Results are described as significant at p ≤ 0.05 but, given that statistical significance does not equate to clinical importance and the small sample size for this type of analysis, we instead mainly discuss variables in terms of their odds ratios, as small sample sizes can still yield large effect sizes despite high p-values and wide confidence intervals. All statistical analyses were conducted using R (v3.5.0, R Core Team, Citation2018), with GLMs analyzed using the “lme4” package (Bates et al., Citation2015).
Results
Sample characteristics
Gorillas in this sample had cholesterol values ranging from 123-417 mg/dl ( = 236.7 mg/dl, SD = 70.2, n = 46) and triglycerides ranging from 56–317 mg/dl (
= 128.4 mg/dl, SD = 76.8, n = 33). In this sample, 55.5% (n = 35) of gorillas were diagnosed with a chronic condition and 33.3% (n = 21) died between sample collection and this study. Cardiac disease was diagnosed in 42.9% (n = 27) of gorillas, while 17.5% (n = 11) had arthritis, 4.8% (n = 3) had obesity and/or hypothyroidism, and 3.2% had cancer and/or hypertension (n = 2). Males were more likely than females to present with a chronic condition, with 73.3% (n = 22) having at least one chronic condition, 66.7% (n = 20) having cardiac disease, and 30% (n = 9) being deceased. Among females, 39.4% (n = 13) had at least one chronic condition, 21.2% (n = 7) had cardiac disease, and 36.4% (n = 12) were deceased. Allostatic load scores ranged from 0-6 for each ALI; means, standard deviations, and ranges for each new and original ALI are presented in .
Table 2. Means, standard deviations, and ranges for each allostatic load index tested in western lowland gorillas (n = 63), as well as associations of allostatic load with age (linear regression) and sex (t-test).
Associations with cholesterol and triglycerides
Due to their potential as indicators of morbidity, we previously examined associations of allostatic load with cholesterol and triglycerides, observing nonsignificant and significant relationships, respectively, with each ALI. Results from the new ALIs tested herein were consistent with those observations. Allostatic load was not significantly associated with cholesterol (PS1 ALQ: p = 0.971, R2 < 0.001; PS2 ALQ: p = 0.773, R2 = 0.002; PS1 ALM: p = 0.527, R2 = 0.009; PS2 ALM: p = 0.481, R2 = 0.011) but showed a significant positive relationship with triglycerides (PS1 ALQ: p = 0.002, R2 = 0.260; PS2 ALQ: p = 0.005, R2 = 0.226; PS1 ALM: p = 0.018, R2 = 0.168; PS2 ALM: p = 0.012, R2 = 0.188).
All-cause morbidity
Differences in allostatic load based on the presence or absence of at least one chronic condition were not significant (PS1 ALQ: t = 0.18, df = 61, p = 0.075, PS2 ALQ: t = −0.56, df = 61, p = 0.579; PS1 ALM: t = −1.86, df = 61, p = 0.068; PS2 ALM: t = −0.65, df = 61, p = 0.516). By itself, a one-unit increase in allostatic load estimated using the new ALIs predicted a 10–35% higher odds of developing a chronic condition, compared to 9–44% higher odds for the original ALIs (; ). However, the baseline model with age and sex only had the lowest AICc of all models tested. According to the baseline model, gorillas had 75% higher odds of developing a chronic condition with every 5-year increase in age. Males were more than 10× more likely to develop a chronic condition than females, although this estimate had wide confidence intervals. Compared to the original ALIs, the new PS1 ALIs had slightly higher AICc values and smaller effect sizes, indicating poorer performance, while the PS2 ALIs were equivalent.
Figure 2. Relative risk of developing at least one chronic condition in western lowland gorillas for each allostatic load index tested. Error bars represent 95% confidence intervals. ALI: allostatic load index; ALM: allostatic load index constructed with a multi-method approach; ALQ: allostatic load index constructed with traditional one-tailed quartiles; PS1: pooled sample 1; PS2: pooled sample 2.
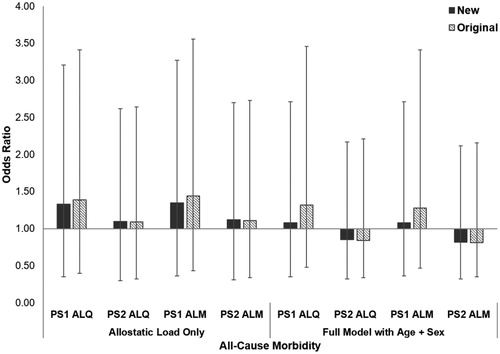
Table 3 Risk of all-cause morbidity in western lowland gorillas (n = 63) was analyzed using binomial generalized linear models (GLMs) with logit links for a baseline model with age and sex only, a model with each allostatic load index only, and a full model with allostatic load and significant variables from the baseline model.
Cardiac disease
As with all-cause morbidity, gorillas affected by cardiac disease did not have significantly higher allostatic load than unaffected conspecifics (PS1 ALQ: t = −0.92, df = 61, p = 0.360, PS2 ALQ: t = 0.27, df = 61, p = 0.789; PS1 ALM: t = −0.83, df = 61, p = 0.408; PS2 ALM: t = 0.35, df = 61, p = 0.727). Results from GLMs when allostatic load alone was in the model were mixed, with some models showing increased risk of cardiac disease while others showed decreased risk (; ). Compared to the new ALIs, the baseline model had the lowest AICc, indicating 30% increased odds of developing cardiac disease with every 5-year increase in age and males being more than 10x more likely to develop the condition than females. However, both original PS2 ALIs had slightly slower AICc values than the baseline model. Unexpectedly, these models indicate a 30% and 36% reduced risk of developing cardiac disease with every one-unit increase in allostatic load for PS2 ALQ and PS2 ALM, respectively. Opposite of all-cause morbidity, this time the new PS1 ALIs performed equivalently to the original PS1 ALIs, while the original PS2 ALIs had lower AICc values and larger effect sizes compared to the new PS2 ALIs.
Figure 3. Relative risk of developing cardiac disease in western lowland gorillas for each allostatic load index tested. Error bars represent 95% confidence intervals. ALI: allostatic load index; ALM: allostatic load index constructed with a multi-method approach; ALQ: allostatic load index constructed with traditional one-tailed quartiles; PS1: pooled sample 1; PS2: pooled sample 2.
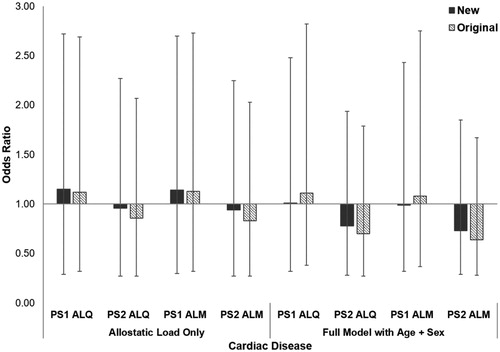
Table 4. Risk of cardiac disease in western lowland gorillas (n = 63) was analyzed using binomial generalized linear models (GLMs) with logit links for a baseline model with age and sex only, a model with each allostatic load index only, and a full model with allostatic load and significant variables from the baseline model.
Mortality risk
Allostatic load was significantly higher in deceased gorillas compared to those still alive at time of submission for all but the PS1 ALM model (PS1 ALQ: t = −2.17, df = 61, p = 0.034, PS2 ALQ: t = −2.67, df = 61, p = 0.010; PS1 ALM: t = −1.52, df = 61, p = 0.133; PS2 ALM: t = −2.33, df = 61, p = 0.023). By itself, allostatic load was associated with an 11–56% higher odds of mortality in the new ALIs, compared with 17–71% higher odds in the original ALIs (; ). All full models for both the original and new ALIs had lower AICc values than the baseline model, indicating the inclusion of allostatic load improved predictions of mortality risk. When included in models alongside age, allostatic load in the new ALIs predicted an 11-43% higher mortality risk, compared to 17–50% in the original ALIs. Across ALIs, each 5-year increase in age predicted a 30–35% increased likelihood of death. For both PS1 and PS2 ALIs, the new models had higher AICc values and weaker effect sizes compared to the original indices.
Figure 4. Relative risk of mortality in western lowland gorillas for each allostatic load index tested. Error bars represent 95% confidence intervals. ALI: allostatic load index; ALM: allostatic load index constructed with a multi-method approach; ALQ: allostatic load index constructed with traditional one-tailed quartiles; PS1: pooled sample 1; PS2: pooled sample 2.
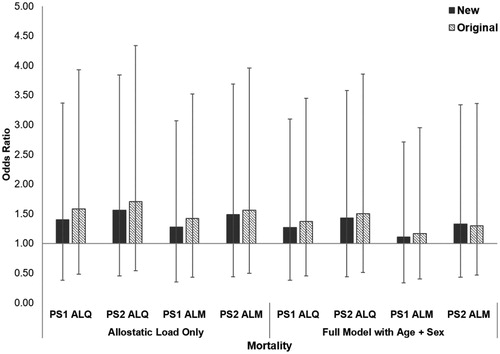
Table 5. Risk of mortality in western lowland gorillas (n = 63) was analyzed using binomial generalized linear models (GLMs) with logit links for a baseline model with age and sex only, a model with each allostatic load index only, and a full model with allostatic load and significant variables from the baseline model.
Discussion and Conclusion
Allostatic load in humans predicts risk of a variety of morbid conditions. As gorillas develop many of these same conditions, we expected to observe higher allostatic load in gorillas with chronic conditions. Allostatic load was not significantly higher in gorillas based on the presence or absence of at least one chronic condition. By itself, each one-unit increase in allostatic load was associated with a 10–35% increase in risk of all-cause morbidity for new ALIs, but this was slightly weaker than the 9–44% higher odds predicted by the original ALIs. However, the model with the lowest AICc for predicting all-cause morbidity contained only sex and age, with every 5-year increase in age predicted 75% higher odds of having a chronic condition and males nearly 11× more likely than females to develop at least one. With larger effect sizes and lower AICc values, the original ALIs performed better than the new ALIs when predicting all-cause morbidity.
Risk of cardiac disease was the first chronic disease predicted using allostatic load scores (Seeman et al., Citation1997), an association which has since been repeatedly observed (e.g. Karlamangla et al., Citation2002; Mattei et al., Citation2010). As cardiac disease is the leading cause of death for zoo-housed great apes (Murphy et al., Citation2018), we hypothesized significant differences in allostatic load between gorillas with and without heart disease. However, allostatic load was not significantly higher in gorillas with cardiac disease. For both the original and new ALIs, when allostatic load was the only variable included in the models, results were mixed, with some analyses showing increased risk while others showed reduced risk. While the baseline model with age and sex only had lower AICc when compared to the full models with the new ALIs, both full models including the original PS2 ALIs had the lowest AICc values. These two ALIs unexpectedly showed that a one-unit increase in allostatic load predicted 30–36% lower odds of developing cardiac disease. In these two models, a 5-year increase in age predicted a 35–40% increase likelihood of having cardiac disease and males were more than 11× more likely to develop cardiac disease than females, consistent with previous estimates that males are 8× more likely to die from the condition than females (Strong et al., Citation2018). It is unclear why we are observing a reduced risk of cardiac disease with higher allostatic load given the likely widespread effects of having this condition on other physiological parameters. Some biomarkers which have been linked to cardiac disease in gorillas include blood pressure (Junge et al., Citation1998; Murphy et al., Citation2011, Citation2018), brain natriuretic peptide (BNP; Murphy et al., Citation2018; Murray et al., Citation2019), and leptin and adiposity (Dennis et al., Citation2019); incorporating biomarkers such as these may improve predictions of cardiac disease risk in gorillas using ALIs.
Finally, increasing allostatic load in humans is associated with increased mortality risk (Castagné et al., Citation2018; Hwang et al., Citation2014). By itself, allostatic load had a more substantial impact on mortality risk than disease risk, with each one-unit increase associated with a 28–56% higher odds of death in the new ALIs and 42–71% higher odds in the original indices. Unlike disease risk, the full models containing allostatic load and age were the best fit models for both the new and original ALIs. Although allostatic load was not a significant predictor in the best fit models, a one-unit increase remained associated with up to 43% and 50% higher odds of mortality for new and original ALIs, respectively. Each 5-year increase in age was associated with 30–35% higher odds of death.
For all-cause morbidity, PS1 ALIs had both larger effect sizes and lower AICc values when compared to PS2 ALIs, while the opposite pattern was observed for mortality risk. Effect size strength and AICc values are mixed between pooling strategies for cardiac disease. These results indicate there may be a benefit to using both pooling strategies, depending on the outcome of interest. However, across all three health outcomes examined, most original ALIs had larger effect sizes and lower AICc values than the new ALIs. This suggests our original ALI is better at predicting risk of poor health in western lowland gorillas. As the purpose herein was to test a method for refining a large list of biomarkers into a smaller allostatic load index that could better predict health outcomes, we are unable to recommend using forward stepwise regression combined with independent biomarker associations as a method for determining which biomarkers to include in an index. It has been previously suggested forward stepwise regression may not be ideal for identifying key variables (Harrison et al., Citation2018; Whittingham et al., Citation2006). Information theoretic approaches, such as multimodel inference (Harrison et al., Citation2018), may offer an alternative for identifying which biomarkers would be best to include in ALIs. While allostatic load was designed to assess sub-clinical risk and one advantage is that it predicts individuals most likely to develop poor health in the future even when individual biomarkers included in the index may not predict those same outcomes, there are likely benefits to including biomarkers which are known to associate with particular health outcomes, as is done in human research (e.g. insulin resistance and diabetes, triglycerides and cardiovascular disease).
One limitation to this study is the missing data on cholesterol and triglycerides, which relegated these markers to being analyzed as outcome variables rather than included within the ALI. ALIs containing lipid markers should be tested to determine if such models are more sensitive to disease outcomes. We also are limited in our ability to determine associations of allostatic load with other chronic conditions, such as arthritis and hypertension, which are not sufficiently prevalent in this sample for valid quantitative analyses. Moreover, the timing of samples is a potential confound; for some individuals, samples were collected at young ages prior to the onset of any disease, while others were in advanced stages of disease. While we would like to control for this variation when sample size permits, studying health in wildlife is complicated by the fact that hiding sick behavior can be adaptive (Markowitz, Citation1982), making it difficult to establish the exact timing of disease onset. Quantitatively, given our small sample size, the results of our binomial GLMs must be interpreted with caution, although large estimated effects can be observed despite having high p-values and wide confidence intervals.
There are many additional factors that both contribute to the development of allostatic load and to poor health outcomes, such as social rank and personality, which often are interconnected. Social status is associated with health and longevity in both humans and nonhuman primates (Archie et al., Citation2014; Goymann & Wingfield, Citation2004; Holt-Lunstad et al., Citation2010; Uchino, Citation2006). Dozens of studies in human populations demonstrate an inverse association between allostatic load and indicators of social status like socioeconomic position and educational attainment (for review, see Edes & Crews, Citation2017). Personality also plays a large role in allostatic responses to events, impacting both allostatic load and allostatic overload (Korte et al., Citation2005). Seeman et al. (Citation2002) observed higher allostatic load in people with more hostile temperaments. It also was recently shown that chimpanzees who were more agreeable had longer lifespans than more aggressive conspecifics (Altschul et al., Citation2018). Future work that considers social rank and personality as both a predictor and mediator of allostatic load will improve our ability to predict health risks in gorillas and many other species.
Considerable flexibility in constructing ALIs has demonstrated the robustness of using these models to assess disease and mortality risk. While we agree with the suggestion that different ALIs may be required for predicting various health outcomes (Delpierre et al., Citation2016), applications to questions of wildlife welfare, health, and conservation would benefit from identifying optimal, species-specific ALIs. Herein, we explored one potential method for determining which biomarkers to include using stepwise regression combined with independent associations between individual biomarkers and project variables. Higher allostatic load was associated with increased risk of all-cause morbidity and mortality. However, there was an inverse association between allostatic load and cardiac disease. The observations for all-cause morbidity and mortality are consistent with our initial research on allostatic load in this species, but the original ALIs had consistently better goodness of fit and stronger effect sizes compared to the new ALIs. As such, alternative quantitative methods are likely to be better at identifying specific biomarkers to include in an ALI. Moreover, the best strategy for pooling datasets from multiple locations may vary based on the outcome of interest. These data and results hopefully will serve to guide others as they seek to measure allostatic load in their study species. Continued exploration of methods and biomarker discovery are encouraged and will be beneficial to advancing research on stress and allostatic load across a variety of taxa.
Notes on contributors
All authors helped conceptualize the study and interpret the results. ANE analyzed the data. ANE prepared the manuscript and completed revisions with contributions from all co-authors.
Acknowledgements
The authors thank research assistants Rebecca Makii, Michelle Forman, Balbine Jourdan, and Jessica Schuster. This research would not have been possible without the assistance of veterinarians, keepers, and staff at the Columbus Zoo and Aquarium, Louisville Zoo, and Omaha’s Henry Doorly Zoo. The authors also thank two anonymous reviewers for their helpful feedback to improve this manuscript.
Disclosure statement
No potential conflict of interest was reported by the author(s).
Data availability
Data supporting the findings of this study are available on request from the corresponding author, ANE. Individually identifiable data are not publicly available due to confidential agreements made between the corresponding author, ANE, and each cooperating zoological institution.
Additional information
Funding
References
- Altschul, D. M., Hopkins, W. D., Herrelko, E. S., Inoue-Murayama, M., Matsuzawa, T., King, J. E., Ross, S. R., & Weiss, A. (2018). Personality links with lifespan in chimpanzees. eLife, 7, 1–17. https://doi.org/https://doi.org/10.7554/eLife.33781
- Archie, E. A., Tung, J., Clark, M., Altmann, J., & Alberts, S. C. (2014). Social affiliation matters: Both same-sex and opposite-sex relationships predict survival in wild female baboons. Proceedings of the Royal Society B, 281, 1–9.
- Badanes, L. S., Watamura, S. E., & Hankin, B. L. (2011). Hypocortisolism as a potential marker of allostatic load in children: Associations with family risk and internalizing disorders. Development and Psychopathology, 23(3), 881–896. https://doi.org/https://doi.org/10.1017/S095457941100037X
- Bates, D., Maechler, M., Bolker, B., Walker, S., Christensen, R. H. B., Singmann, H., Dai, B., Scheipl, F., Grothendieck, G., Green, P., & Fox, J. (2015). lme4: Linear Mixed-Effects Models using “Eigen” and S4. R package version 1.1-19. Retrieved from https://cran.r-project.org/package=lme4
- Beckie, T. M. (2012). A systematic review of allostatic load, health, and health disparities. Biological Research for Nursing, 14(4), 311–346. https://doi.org/https://doi.org/10.1177/1099800412455688
- Castagné, R., Garès, V., Karimi, M., Chadeau-Hyam, M., Vineis, P., Delpierre, C., & Kelly-Irving, M.; for the Lifepath Consortium. (2018). Allostatic load and subsequent all-cause mortality: Which biological markers drive the relationship? Findings from a UK birth cohort. European Journal of Epidemiology, 33(5), 441–458. https://doi.org/https://doi.org/10.1007/s10654-018-0364-1
- Delpierre, C., Barbosa-Solis, C., Torrisani, J., Darnaudery, M., Bartley, M., Blane, D., Kelly-Irving, M., Getz, L., Tomasdottir, M. O., Roberston, T., & Gustafsson, P. E. (2016). Origins of health inequalities: The case for Allostatic Load. Longitudinal and Life Course Studies, 7(1), 79–103. https://doi.org/https://doi.org/10.14301/llcs.v7i1.325
- Dennis, P. M., Raghanti, M. A., Meindl, R. S., Less, E., Henthorn, E., Devlin, W., Murray, S., Meehan, T., Kutinsky, I., & Murphy, H. (2019). Cardiac disease is linked to adiposity in male gorillas (Gorilla gorilla gorilla). PLOS One, 14(6), e0218763. https://doi.org/https://doi.org/10.1371/journal.pone.0218763
- Edes, A. N. (2018). Assessing long-term stress in great apes: Allostatic load in western lowland gorillas (Gorilla gorilla gorilla). The Ohio State University. http://rave.ohiolink.edu/etdc/view?acc_num=osu1523103332647349
- Edes, A. N., & Crews, D. E. (2017). Allostatic load and biological anthropology. American Journal of Physical Anthropology, 162(S63), 44–70. https://doi.org/https://doi.org/10.1002/ajpa.23146
- Edes, A. N., Wolfe, B. A., & Crews, D. E. (2016a). Assessing stress in zoo-housed western lowland gorillas (Gorilla gorilla gorilla) using allostatic load. International Journal of Primatology, 37(2), 241–259. https://doi.org/https://doi.org/10.1007/s10764-016-9899-8
- Edes, A. N., Wolfe, B. A., & Crews, D. E. (2016b). Rearing history and allostatic load in adult western lowland gorillas (gorilla gorilla gorilla) in human care. Zoo Biology, 35(2), 167–173. https://doi.org/https://doi.org/10.1002/zoo.21270
- Edes, A. N., Wolfe, B. A., & Crews, D. E. (2018a). The first multi-zoo application of an allostatic load index to western lowland gorillas (Gorilla gorilla gorilla). General and Comparative Endocrinology, 266, 135–149. https://doi.org/https://doi.org/10.1016/j.ygcen.2018.05.006
- Edes, A. N., Wolfe, B. A., & Crews, D. E. (2018b). Evaluating Allostatic Load: A new approach to measuring long-term stress in wildlife. Journal of Zoo and Wildlife Medicine, 49(2), 272–282. https://doi.org/https://doi.org/10.1638/2016-0070.1
- Ellis, M. J., Livesey, J. H., & Donald, R. A. (1988). Circulating plasma corticotrophin-releasing factor-like immunoreactivity. Journal of Endocrinology, 117(2), 299–307. https://doi.org/https://doi.org/10.1677/joe.0.1170299
- Goymann, W., & Wingfield, J. C. (2004). Allostatic load, social status and stress hormones: The costs of social status matter. Animal Behaviour, 67(3), 591–602. https://doi.org/https://doi.org/10.1016/j.anbehav.2003.08.007
- Harder, J. D. (2012). Reproduction and hormones. In N. J. Silvy (Ed.), The wildlife techniques manual. (Vol. 1, pp. 502–525). John Hopkins University Press.
- Harrison, X. A., Donaldson, L., Correa-Cano, M. E., Evans, J., Fisher, D. N., Goodwin, C. E. D., Robinson, B. S., Hodgson, D. J., & Inger, R. (2018). A brief introduction to mixed effects modelling and multi-model inference in ecology. PeerJ, 6, e4794. https://doi.org/https://doi.org/10.7717/peerj.4794
- Heim, C., Ehlert, U., & Hellhammer, D. H. (2000). The potential role of hypocortisolism in the pathophysiology of stress-related bodily disorders. Psychoneuroendocrinology, 25(1), 1–35. https://doi.org/https://doi.org/10.1016/S0306-4530(99)00035-9
- Holt-Lunstad, J., Smith, T. B., & Layton, J. B. (2010). Social relationships and mortality risk: A meta-analytic review. PLOS Medicine, 7(7), e1000316–20.
- Hwang, A.-C., Peng, L.N., Wen, Y.W., Tsai, Y.W., Chang, L.C., Chiou, S.T., & Chen, L.K. (2014). Predicting all-cause and cause-specific mortality by static and dynamic measurements of allostatic load: A 10-Year Population-Based Cohort Study in Taiwan. Journal of the American Medical Directors Association, 15(7), 490–496. https://doi.org/https://doi.org/10.1016/j.jamda.2014.02.001
- Junge, R. E., Mezei, L. E., Muhlbauer, M., & Weber, M. (1998). Cardiovascular evaluation of lowland gorillas. Journal of the American Veterinary Medical Association, 212(3), 413–415.
- Juster, R.-P., McEwen, B. S., & Lupien, S. J. (2010). Allostatic load biomarkers of chronic stress and impact on health and cognition. Neuroscience and Biobehavioral Reviews, 35(1), 2–16. https://doi.org/https://doi.org/10.1016/j.neubiorev.2009.10.002
- Karlamangla, A. S., Singer, B. H., McEwen, B. S., Rowe, J. W., & Seeman, T. E. (2002). Allostatic load as a predictor of functional decline: MacArthur studies of successful aging. Journal of Clinical Epidemiology, 55(7), 696–710. https://doi.org/https://doi.org/10.1016/S0895-4356(02)00399-2
- Korte, S. M., Koolhaas, J. M., Wingfield, J. C., & McEwen, B. S. (2005). The Darwinian concept of stress: benefits of allostasis and costs of allostatic load and the trade-offs in health and disease. Neuroscience and Biobehavioral Reviews, 29(1), 3–38. https://doi.org/https://doi.org/10.1016/j.neubiorev.2004.08.009
- Latendresse, G., & Ruiz, R. J. (2008). Bioassay research methodology: measuring CRH in pregnancy. Biological Research for Nursing, 10(1), 54–62. https://doi.org/https://doi.org/10.1177/1099800408320970
- Linton, E. A., McLean, C., Nieuwenhuyzen Kruseman, A. C., Tilders, F. J., Van der Veen, E. A., & Lowry, P. J. (1986). Direct measurement of human plasma corticotropin-releasing hormone by “Two-Site” immunoradiometric assay. The Journal of Clinical Endocrinology and Metabolism, 64(5), 1047–1053.
- Linton, E. A., Perkins, A. V., Hagan, P., Poole, S., Bristow, A. F., Tilders, F., Corder, R., & Wolfe, C. D. A. (1995). Corticotrophin-releasing hormone (CRH)-binding protein interference with CRH antibody binding: implications for direct CRH immunoassay. Journal of Endocrinology, 146(1), 45–53. https://doi.org/https://doi.org/10.1677/joe.0.1460045
- Marklein, K. E., & Crews, D. E. (2017). Frail or hale: Skeletal frailty indices in Medieval London skeletons. PLOS One, 12(5), e0176025. https://doi.org/https://doi.org/10.1371/journal.pone.0176025
- Markowitz, H. (1982). Behavioral enrichment in the zoo. Van Norstrand Reinhold Company.
- Mattei, J., Demissie, S., Falcon, L. M., Ordovas, J. M., & Tucker, K. (2010). Allostatic load is associated with chronic conditions in the Boston Puerto Rican Health Study. Social Science and Medicine, 70(12), 1988–1996. https://doi.org/https://doi.org/10.1016/j.socscimed.2010.02.024
- Matthews, D. R., Hosker, J. P., Rudenski, A. S., Naylor, B. A., Treacher, D. F., & Turner, R. C. (1985). Homeostasis model assessment: Insulin resistance and β -cell function from fasting glucose and insulin concentrations in man. Diabetologia, 28(7), 412–419. https://doi.org/https://doi.org/10.1007/BF00280883
- McEwen, B. S. (1998). Protective and damaging effects of stress mediators. New England Journal of Medicine, 338(3), 171–179. https://doi.org/https://doi.org/10.1056/NEJM199801153380307
- McEwen, B. S., & Stellar, E. (1993). Stress and the individual: Mechanisms leading to disease. Archives of Internal Medicine, 153(18), 2093–2101. https://doi.org/https://doi.org/10.1001/archinte.153.18.2093
- McEwen, B. S., & Wingfield, J. C. (2003). The concept of allostasis in biology and biomedicine. Hormones and Behavior, 43(1), 2–15. https://doi.org/https://doi.org/10.1016/S0018-506X(02)00024-7
- Murphy, H. W., Danforth, M. D., & Clyde, V. L. (2018). The Great Ape Heart Project. International Zoo Yearbook, 52(1), 103–112. https://doi.org/https://doi.org/10.1111/izy.12180
- Murphy, H. W., Dennis, P., Devlin, W., Meehan, T., & Kutinsky, I. (2011). Echocardiographic parameters of captive western lowland gorillas (Gorilla gorilla gorilla). Journal of Zoo and Wildlife Medicine, 42(4), 572–579. https://doi.org/https://doi.org/10.1638/2010-0139.1
- Murray, S., Kishbaugh, J. C., Hayek, L.-A C., Kutinsky, I., Dennis, P. M., Devlin, W., Hope, K. L., Danforth, M. D., & Murphy, H. W. (2019). Diagnosing cardiovascular disease in western lowland gorillas (Gorilla gorilla gorilla) with brain natriuretic peptide. PLOS One, 14(3), e0214101. https://doi.org/https://doi.org/10.1371/journal.pone.0214101
- Orentreich, N., Brind, J. L., Rizer, R. L., & Vogelman, J. H. (1984). Age changes and sex differences in serum dehydroepiandrosterone sulfate concentrations throughout adulthood. The Journal of Clinical Endocrinology and Metabolism, 59(3), 551–555. https://doi.org/https://doi.org/10.1210/jcem-59-3-551
- Prior, L., Manley, D., & Jones, K. (2018). Stressed out? Health and Place, 52, 25–33. https://doi.org/https://doi.org/10.1016/j.healthplace.2018.05.003
- R Core Team (2018). R: A language and environment for statistical computing. R Foundation for Statistical Computing.
- Raison, C. L., & Miller, A. H. (2003). When not enough is too much: The role of insufficient glucocorticoid signaling in the pathophysiology of stress-related disorders. The. American Journal of Psychiatry, 160(9), 1554–1565. https://doi.org/https://doi.org/10.1176/appi.ajp.160.9.1554
- Seeman, T. E., Singer, B. H., Rowe, J. W., Horwitz, R. I., & McEwen, B. S. (1997). Price of adaptation - allostatic load and its health consequences. Archives of Internal Medicine, 157(19), 2259–2268. https://doi.org/https://doi.org/10.1001/archinte.157.19.2259
- Seeman, T. E., Singer, B. H., Ryff, C. D., Love, G. D., & Levy-Storms, L. (2002). Social relationships, gender, and allostatic load across two age cohorts. Psychosomatic Medicine, 64(3), 395–406.
- Sterling, P., & Eyer, J. (1988). Allostasis: A new paradigm to explain arousal pathology. In S. Fisher & J. Reason (Eds.), Handbook of life stress, cognition and health. (pp. 629–649). John Wiley & Sons.
- Strong, V. J., Martin, M., Redrobe, S., White, K., & Baiker, K. (2018). A retrospective review of great ape cardiovascular disease epidemiology and pathology. International Zoo Yearbook, 52(1), 113–125. https://doi.org/https://doi.org/10.1111/izy.12193
- Tworoger, S. S., & Hankinson, S. E. (2006). Collection, processing, and storage of biological samples in epidemiological studies: Sex hormones, carotenoids, inflammatory markers, and proteomics as examples. Cancer Epidemiology Biomarkers and Prevention, 15(9), 1578–1581. https://doi.org/https://doi.org/10.1158/1055-9965.EPI-06-0629
- Uchino, B. N. (2006). Social support and health: A review of physiological processes potentially underlying links to disease outcomes. Journal of Behavioral Medicine, 29(4), 377–387. https://doi.org/https://doi.org/10.1007/s10865-006-9056-5
- Wallace, M. E., & Harville, E. W. (2013). Allostatic load and birth outcomes among White and Black women in New Orleans. Maternal and Child Health Journal, 17(6), 1025–1029. https://doi.org/https://doi.org/10.1007/s10995-012-1083-y
- Whittingham, M. J., Stephens, P. A., Bradbury, R. B., & Freckleton, R. P. (2006). Why do we still use stepwise modelling in ecology and behaviour? Journal of Animal Ecology, 75(5), 1182–1189. https://doi.org/https://doi.org/10.1111/j.1365-2656.2006.01141.x