
Abstract
Patients with stress-related Exhaustion Disorder (ED) have problems with memory and executive function. These problems have been associated with deviant activity in prefrontal cortex (PFC). We investigated cognitive performance and functional activity in the PFC during prolonged mental activity in patients with ED (n = 20, 16 women) with a mean duration since diagnosis of 46 ± 23 months in comparison to healthy individuals (n = 20, 12 women). A block of six neuropsychological tests was performed in a sequence that was repeated once. The brain imaging technique, functional near infrared spectroscopy (fNIRS) was used for all tests. There were no differences between the groups in terms of changes over time, i.e. difference between first and second test block. In the Stroop–Simon test, the controls showedhigher functional activity in the frontal cortex. In the left ventrolateral PFC, we observed an increased activity in controls in the incongruent compared to the congruent trials, whereas no changes were detected in the ED patient group. During processing speed tasks, only ED patients showed higher functional activity in right dorsolateral PFC. The ED patients reported lower subjective energy level and they also performed less well on a mental control task compared to healthy individuals. In conclusion, ED patients showed altered functional activity compared to controls, indicating that ED patients process information differently in the prefrontal cortex, but the functional activity did not change during the 2½ hr procedure, as revealed by the test-retest design.
Lay summary
In this paper we show that patient with exhaustion disorder have a reduced functional activity in the prefrontal cortex. This functional activity was not affected by 2.5 hours mental activity.
1. Introduction
A severe consequence of persistent stress exposure is exhaustion or “burnout”, which can result in long-term disability and cognitive impairment (Glise et al., Citation2012; Grossi et al., Citation2015). In Sweden, the clinical diagnosis, Exhaustion Disorder (ED), code F43.8A in the International Classification of Diseases and Related Health Problems (ICD-10) is used for this patient group (Grossi et al., Citation2015). ED patients describe being easily fatigued after cognitively demanding tasks and they need a longer recovery time (Sandstrom et al., Citation2005). They appear to experience substantially increased fatigue when the cognitive demand increases further (Krabbe et al., Citation2017). The ED diagnosis shares several cardinal symptoms with other diagnoses such as chronic fatigue syndrome (CFS). Several symptoms however distinguish these two conditions. The debut of CFS is commonly related to infections and symptoms related to this such as sore throat and enlarged lymph nodes. This is rarely the case in patients with ED who describe an intense and prolonged stress exposure and long-lasting fluctuating prodromal somatic or mental symptoms, sometimes during several years before ED debut. The onset of ED is often acute and not seldom associated with a traumatic event or an unusual situation.
Despite some inconsistencies between studies, a general pattern has emerged regarding ED patients’ cognitive impairments. ED patients appear to have cognitive difficulties associated with attention (Linden et al., Citation2005; Osterberg et al., Citation2012), memory (Jonsdottir et al., Citation2013; Ohman et al., Citation2007; Österberg et al., Citation2009; Osterberg et al., Citation2012; Sandstrom et al., Citation2005, Citation2011) and executive function, such as working memory (Diestel et al., Citation2013; Ohman et al., Citation2007; Oosterholt et al., Citation2012; Sandstrom et al., Citation2005, Citation2011), inhibition (Diestel et al., Citation2013; Jonsdottir et al., Citation2013; Linden et al., Citation2005) and mental flexibility (Ohman et al. Citation2007; Oosterholt et al., Citation2012). Few longitudinal studies have been performed. One study showed that 1.5 years after diagnosis, patients still experienced fatigue and reported further cognitive problems, whereas at the same time performance on cognitive tests (Digit Span, 2-Back Task, STOP-IT, Flanker Task, and Matching Task) did not differ between patients and healthy controls (Oosterholt et al., Citation2016). In a different cohort, Jonsdottir et al. found that ED patients still had persistent memory problems after three years as well as problems with attention (forward Digit Span) (Jonsdottir et al., Citation2017).
Magnetic resonance imaging (MRI) has found evidence for reduced gray matter volume in the prefrontal cortex (PFC), the anterior cingulate cortex (ACC) (Blix et al., Citation2013; Savic, Citation2015; Savic et al., Citation2018) and the superior temporal gyrus along with an increased amygdala volume (Savic, Citation2015; Savic et al., Citation2018). Functional connectivity between dorsolateral PFC (DLPFC), ACC, amygdale, and motor cortex is decreased in patients with ED (Golkar et al., Citation2014; Jovanovic et al., Citation2011). Functional MRI studies found decreased activity in the PFC for ED patients during working memory tasks (Gavelin et al., Citation2017; Sandstrom et al. Citation2012). Using functional near-infrared spectroscopy (fNIRS), which measures the concentration of oxygenated (oxy-Hb) and deoxygenated (deoxy-Hb) hemoglobin, a correlation between higher occupational burnout scores and lower oxy-Hb concentration in the PFC was detected during a verbal fluency task (Chou et al., Citation2016).
In this study a test-retest design was used, with six neuropsychological tests being performed twice, in order to test the effects of mental fatigue on cognition in ED patients. All participants performed the six tests in the same sequence and fNIRS was recorded during all tests. We hypothesized that ED patients would perceive increased mental fatigue over the course of the test sessions and that this would also be reflected in their test performance compared to the healthy controls. In addition, we expected ED patients to have altered hemodynamic activity in the frontal cortex compared to healthy controls and that the altered activity would be more pronounced during the second test period.
2. Method
2.1. Participants
The patients were clinically assessed by a physician at a specialist clinic for stress-related exhaustion, the Institute of Stress Medicine in Gothenburg, Sweden and were diagnosed with Exhaustion Disorder ED code F43.8A, ICD-10. Patients received information about the study during a follow up meeting at the clinic or by mail. Those who showed interest to participate were contacted by a research nurse. They were not compensated. All patients had received 12–18 months of multimodal treatment for ED, except one who was eight months in to the treatment at time of inclusion. This treatment has previously been described in detail (Glise et al. Citation2012). Exclusion criteria for the treatment program were a body mass index less than 18.5 kg/m2 or over 30 kg/m2, high blood pressure, infection, menopause, pregnancy, nursing, vitamin B-deficiency (high homocysteine), known systemic disease such as diabetes or thyroid disease or known psychiatric disease, except depression and anxiety disorder, which are common co-morbidity in the history of ED patients (Glise et al., Citation2012).
Twenty-one healthy controls neither reporting mental fatigue (below 10.5 points on MFS), nor any psychiatric or neurological disorders, were recruited from the general community, by posting on the university and hospital webpages and through a general mailing list to some larger companies in the Gothenburg region. The study was approved by the regional Ethical Review Board in Gothenburg (reference number: 736-16). The participants gave their written informed consent before the assessment and were informed that they could withdraw from the study at any time.
2.2. Cognitive tests
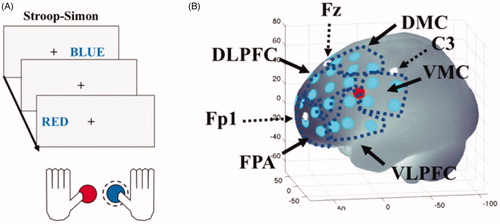
The Stroop–Simon test was used to measure both the Stroop effect (conflict between semantic meaning and ink color) and the Simon effect (conflict between stimulus location and response hand) (Egner, Citation2008; Forster & Cho Citation2014). A cross was presented in the middle of the screen as a marker, and on the left or right side of the marker the word, “RÖD” or ”BLÅ” (the Swedish for red and blue) was presented, either in blue or red ink. The task was to report the color of the word. This was done by pressing one of two buttons on a gamepad with either the left thumb for red color, or the right thumb for blue color (see ). The participants had three seconds to respond and there was a random response to stimulus interval between 7 and 11 seconds. This created four different types of trials and each trail had two dimensions; Stroop congruent and Simon congruent (CC), Stroop congruent and Simon incongruent (CI), Stroop incongruent and Simon congruent (IC) or Stroop incongruent and Simon incongruent (II) (). In total, there were 164 trials, semi-randomized with a 30-second pause after half of the trials. As raw scores, reaction time as well as error and omission frequencies were recorded.
Figure 1. The first stimulus (BLUE on the right side) is considered (Stroop) congruent-(Simon) congruent. The next stimulus (RED on the left side) is considered (Stroop) incongruent- (Simon) incongruent. In both cases the correct answer is to push the right button (which is blue) that is highlighted with a dashed line. Only when the word would be written in red should the left button (which is red) be pressed regardless of where (left or right) the word is presented. (B) Location of the fNIRS channels (light dots) on the left cerebral hemisphere. The single dot shows location of the short separation channel. White dots indicate reference points according to the 10/20 system. Dark dotted areas indicate the regions of interest (ROIs): left and right frontal polar area (FPA) or Brodmann area (BA) 10; dorsolateral prefrontal cortex (DLPFC) or BA 9 and 46; dorsal motor cortex (DMC) BA 6 and 8; ventral lateral prefrontal cortex (VLPFC) BA 44 and 45 and ventral motor cortex (VMC) BA 6 and 44. The brain templet was generated using a MATLAB-based toolbox (Singh et al., Citation2005). The axes refer to MNI (Montreal Neurological Institute) coordinate system.
Symbol Search (SS) is a subtest within the Processing Speed Index in WAIS-IV (Wechsler, Citation2010). As raw scores, numbers of symbols correctly processed during two minutes were determined.
Digit Span (DS) from WAIS-IV (Wechsler Citation2010) was used to assess working memory. Raw scores were reported as the number of correctly repeated strings of digits.
The parallel serial mental operation test (PaSMO) (Reitan & Wolfson, Citation1985) was used to measure mental control. The participants were asked to verbally reproduce the letters of the alphabet with the corresponding digits i.e. “A1”, “B2”, “C3”, etc. as fast as possible. Performance was measured in time (seconds) to complete the alphabet with a faster time indicating a better performance.
The SAWM test was used for simultaneous assessment of Speed, divided Attention and Working Memory (Johansson & Ronnback, Citation2015). The raw scores used for analysis were the mean scores of errors and number of clicks from the second to fifth 30-seconds run.
Digit Symbol Coding (DSC) is a subtest within the Processing Speed Index in WAIS-IV (Wechsler, Citation2010). As raw scores, numbers of symbols correctly processed during two minutes were used. All participants used their right hand.
OPATUS-CPTA, is a continuous performance one-back task to measure sustained attention using a mini tablet. Participants were asked to tap the screen only if a triangular symbol with the same orientation as the previous one appeared on the screen. Triangles were pointing up, down, left or right and appeared in yellow or blue. The stimulus duration was set to 150 ms, the inter-stimuli interval was 2000 ms, the target rate was 20% and the number of trials was 240. The raw scores for reaction times, error and omission frequencies were recorded.
Visual Analogies Scale (VAS). Participants specified their subjective energy level on a continuous line (10 cm) indicating a position between the two end-points, with “full of energy” appearing to the right and “totally exhausted, no energy” to the left.
Mental Fatigue Scale (MFS). The MFS consists of fourteen questions and each item comprises examples of common activities to be related to four response alternatives between 0 and 3 points, plus an additional question, that is not included in the scoring. The 42-point scale has a recommended cutoff value of 10.5, to indicate a concern for pathological mental fatigue. The questionnaire asks about fatigue in general, lack of initiative, mental recovery, concentration difficulties, memory problems, slowness of thought, sensitivity to stress, emotional instability and irritability, sensitivity to noise and light and sleep. The MFS has been shown to be invariant to age, sex and education (Johansson & Ronnback, Citation2014; Johansson et al., Citation2010). The questionnaire is freely downloadable under: https://www.mf.gu.se/digitalAssets/1346/1346171_sj–lvskattning-engelska-modifierad.pdf. The validity of the MFS has been evaluated with stroke and traumatic brain injury patients (Johansson & Ronnback, Citation2014). The internal consistency in this sample is very high with a Cronbach’s α of 0.964 for all 14 items, which is in line with what has been reported before (Johansson et al., Citation2010).
2.3. Study design
Before the tests were started, a semi-structured interview was done with the controls to assess if any psychiatric or neurological disorders were present. The study had a test-retest design, in which the block of neuropsychological tests was performed and then repeated once, taking 150 minutes in total. All participants performed the tests in the following order: (1) Stroop–Simon (Egner et al., Citation2007) (), (2) Symbol Search (SS, WAIS-IV) (Wechsler, Citation2010), (3) Digit Span (DS, WAIS-IV) (Wechsler, Citation2010), (4) Parallel Serial Mental Operations (PaSMO) (Reitan, Citation1985), (5) a computerized test combining speed, divided attention and working memory simultaneously (SAWM) (Johansson & Ronnback, Citation2015) and (6) Digit Symbol Coding (DSC, WAIS-IV) (Wechsler, Citation2010). Between the two blocks of tests, the participants performed the OPATUS-CPTA for 8 minutes. This test was not repeated. Thereafter they were asked to rate their mental fatigue using the MFS questionnaire (Johansson & Ronnback, Citation2014; Johansson et al., Citation2010).
2.4. fNIRS data acquisition
We used a continuous wave system (NTS Optical Imaging System, Gowerlabs Ltd., UK) (Everdell et al., Citation2005) that has two wavelengths (780 and 850 nm) to measure changes in the concentration of oxygenated hemoglobin (oxy-Hb), deoxygenated hemoglobin (deoxy-Hb) and their sum, i.e. total hemoglobin (tot-Hb). The system has 16 dual-wavelength sources and 16 detectors. The specific array used in this study provided 44 standard fNIRS channels (i.e. source/detector pairs) with a 30 mm source-detector distance, plus two short-separation channels (for channel locations see ). To regress out hemodynamic changes occurring in the overlying skin and bone, the distance for the short-separation channels was 10 mm, as suggested by previous studies (Brigadoi & Cooper, Citation2015; Gagnon et al., Citation2011). The array was designed with help of the MATLAB based open source program Atlasviewer (Aasted et al., Citation2015) to encompass ten regions of interest (ROIs): left and right frontal polar area (FPA – Brodmann area BA10), dorsolateral prefrontal cortex (DLPFC – BA 9 and 46), dorsal motor cortex (DMC – BA 6 and 8); ventral lateral prefrontal cortex (VLPFC – BA 44 and 45) and ventral motor cortex (VMC – BA 6 and 44) (). Reliability studies with fNIRS show that, as long as analysis is performed at the group level and with regions of interest (ROI) instead of individual subjects and channels, the reliability is very high, with an intraclass correlation coefficient between 80 and 96% (Plichta et al., Citation2006, Citation2007). The location of the channels and the 10/20 reference points were generated with a digitizer (PATRIOTTM 3 D Digitizer, Polhemus, USA). Data were acquired at a sampling frequency of 10 Hz. For all tests, except the Stroop-Simon, the event markers in the fNIRS recording were inserted manually.
2.5. fNIRS data analysis
The fNIRS data was pre-processed using MATLAB Citation2014a and MATLAB 2019a (MATLAB, Citation2014) and the MATLAB based fNIRS-processing package HomER2 (Huppert et al., Citation2009). The processing pipeline started with pruning the raw data such that channels were rejected if their mean intensity was below the noise floor of the instrument (1e-3 A.U.). The raw data were then converted to optical density (OD). A high band-pass filter of 0.03 Hz was used to correct for drift and a low band-pass 0.5 Hz filter to remove pulse and respiration. For the Stroop–Simon test, the HomER2 functions enPCAFilter, hmrMotionArtifact and hmrMotionCorrectSpline were used to correct for motion artifacts. For fNIRS data from SS, DSC and OPATUS-CPTA, a five-time recursive PCA filter was used (Yucel et al., Citation2014) instead of cubic spline correction. To calculate the hemodynamic response function (HRF), the GLM_HRF_Drift_SS function in HomER2 that estimates the HRF by applying a General Linear Model (GLM) was used. To solve the GLM, a least-square fit of a convolution model in which the HRF at each channel and chromophore was modeled as a series of Gaussian basis functions, with a spacing and standard deviation of 0.5 seconds (Ye et al., Citation2009). The model included polynomial drift regressors up to the 3rd order. The regression time length was −2 to 12 seconds. For the other tests, block average was used, e.g. −2 to 120 seconds for SS and DSC. For each trial, the signal from -2 to 0 seconds were used by the GLM as the baseline. From the regular channels, a static estimator was regressed out, based on the short separation channels with which they had the highest correlation. The fNIRS data of the Stroop–Simon test were analyzed with pre-determined ROIs. A visual analysis of each channel was performed and, where these appeared too noisy, channels were removed from a ROI. This resulted in an internal loss of 19.75% of the data, but not in the exclusion of any ROI.
Since the specific wavelength combination of the NTS-fNIRS system (780 nm, 850 nm) is more sensitive to oxy-Hb compared to deoxy-HB, only the oxy-Hb data were statistically analyzed (Sato et al., Citation2013; Uludağ et al., Citation2004). For the Stroop–Simon test, the maximum peak between 3 and 9 seconds after each stimulus was identified. One second around the peak value was averaged. Due to extensive motion artifacts from the verbal response of DS and PaSMO, these fNIRS data sets were not analyzed.
2.6. Statistics
2.6.1. Demographic data
For the demographic data we used independent t-test to evaluate if there was a difference in age between the two samples and Chi2 to evaluate if there was any sex difference or difference in education level between the samples. The null hypothesis was: there is no difference in age, gender or educational level between patients and controls.
2.6.2. Evaluation of assumptions for repeated ANOVA and analysis pipeline
To evaluate if the assumption (normality and equality of covariance) for a repeated ANOVA, a two-step process was used. First, we tested normality using the Shapiro–Wilk test. If any cell in the intended ANOVA had a p value <.05, the assumption of the normality test was considered not valid. For the data sets that were normal distributed, the Box’s test of equality of covariance was applied. If the p-value was <.05, the equality of covariance assumption of was considered negative for the data set. If either of the assumptions did not hold, a Mann–Whiney U test was used for between-group comparison (patient vs. control) and Wilcoxon Signed Rank Test for the within-subject factor (test vs. retest). To substitute the Group vs. Time interaction analysis from the ANOVA, we used a difference of difference approach with a Mann–Whiney U test, i.e. patients (test–retest) – control (test–retest). The null hypothesis for the Shapiro–Wilk test was that the data is normally distributed. The null hypothesis for the for the Box’s test of equality of covariance was that the covariance for the dependent variable are equal across the two samples.
To correct for multiple comparisons with the neuropsychological test and the fNIRS analysis, a false discovery rate (FDR) was used with the q-value set to .05 in order to keep the false positive rate at 5% (Singh and Dan Citation2006). All p-values of group-wise between-subject comparisons were corrected together, all within-subject comparisons for the controls were corrected together and all within-subject comparisons for the patients were corrected together. As effect size measurements for the repeated ANOVA we used ηp2, with interpretation of the values 0.02/0.16/0.26 as small/medium/large effect. For all other measurements we used Cohen’s d with interpretation of the values 0.2/0.5/0.8/1.2 as small/medium/large/very large effect size. Statistical analysis was performed with SPSS version 25 and MATLAB statistical toolbox (MATLAB, Citation2014).
2.6.3. Behavioral data
For all behavioral test that were performed twice, we used a two-way repeated ANOVA with one between-subject factor Group (patient, control) and one within-subject factor Time (test, retest). The dependent variable for the behavioral measurements were raw test scores (see section for cognitive tests).
For the MFS, the Mann–Whitney U test was applied and for the OPATUS-CPT an independent t-test was used. For the Stroop–Simon test, mean reaction time for each stimulus type for each participant was used, and we analyzed the Stroop effect (congruent, incongruent) and Time (test, retest) as within-subject variables. This excluded trials with omissions (more than three seconds after stimulus without an answer), error trials, trial markers set after an error and condition-specific outlier values that were greater than 2 SDs from the mean. The null hypothesis for the between-subject factor was as follows: there is no difference between patient and controls in the performance on the neuropsychological tests. The null hypothesis for the within-subject factor Time was as follows: there is no difference in performance on the neuropsychological test between the first test and the retest. The null hypothesis for the within-subject factor Stroop effect was as follows: there is no difference in response time between congruent and incongruent trials.
2.6.4. fNIRS Stroop–Simon test data
The fNIRS data acquired during the Stroop–Simon test were analyzed for the Stroop effect within predefined ROIs. Peak oxy-Hb concentration was used as the dependent variable. A three-way repeated ANOVA including a within-subject factor was used with Time (test, retest) and Stroop (congruent, incongruent) and the between-subject factor Group (patient, control) for each ROI. The data from CC trials were used to represent responses to congruent stimuli as well as the average of the IC and II trials as responses to incongruent stimuli. For ROIs, where the assumptions of an ANOVA did not hold a Wilcoxon Signed Rank Test was used for the within-subject factors Stroop effect (congruent, incongruent) and Time (test, retest), Mann–Whitney U test for the between-subject Group (patient, control) for test, retest, the difference between test and retest as well as the Stroop effect difference i.e. the difference between congruent and incongruent trials. If there was a significant difference in the interaction between Stroop effect vs. Group or the difference of difference equivalent) an additional Spearman´s correlation with the MFS score was calculated. The null hypothesis for the between-subject factor was as follows: there is no difference between patient and controls in the peak oxy-Hb concentration. The null hypothesis for the within-subject factor Time was as follows: there is no difference in peak oxy-Hb concentration between test and retest. The null hypothesis for the within-subject factor Stroop effect was: there is no difference in peak oxy-Hb concentration between congruent and incongruent trials. The null hypothesis for the Spearman´s correlation was: there is no association between the difference in peak oxy-Hb for the congruent and incongruent trials and score on the MFS questionnaire.
2.6.5. fNIRS data from SS, DSC, SAWM and OPATUS-CPTA
For the fNIRS data acquired during the performance of SS, DSC, the SAWM and the OPATUS-CPTA test, no predefined ROIs were used and a non-parametric permutation analysis was conducted (Maris & Oostenveld Citation2007), in order to analyze functional activation of cortical locations with the emphasis on temporal and spatial adjacency of activity. We chose this analysis method since to our knowledge no previous imaging study has reported using these cognitive tests. We were therefore not able to define a priori the ROIs or time windows of interest. The permutation analysis deals with multiple comparison that arises from evaluating many different channels and time points by means of changing the null-hypothesis to include the whole spatio-temporal dataset. This method was developed for other imaging techniques and has been evaluated for use with fNIRS (Singh et al. Citation2008). For the same test and the same condition, e.g. the first SS session, an independent Student t-test was conducted between the groups for every time point and every channel (a partition). All partitions with a t-value higher than an alpha value equivalent to p<.01, around t = 2.7, were selected to be clustered in connected sets on the basis of temporal and spatial adjacency. The sum of the t-values for each of the clusters was used as the cluster statistics. To generate a threshold to evaluate significant clusters, a Monte Carlo p-value was calculated. This was done by first conducting 1000 random permutations for each partition, and for each iteration the clusters with the highest cluster statistics were chosen. From this distribution, we used the 2.5th- and the 97.5th-quantiles as thresholds for group comparison. Only those time-space clusters involving more than one channel were incorporated. The datasets generated and analyzed in the current study are available from the corresponding author upon reasonable request.
3. Result
3.1. Demographics and preliminary analysis
Twenty-one patients diagnosed with ED (code F43.8A, ICD-10) were included. The time since diagnosis was between 8 and 99 months. One patient was excluded from the analyses since she did not perform the second test session, stating that she was too fatigued to continue. The final number included in the analysis were 20 patients (16 women and 4 men). Eighteen patients reported university education and two had upper secondary level education, 13 were nonsmokers, 7 had smoked in the past but discontinued, and nine reported history of depression. Twenty-one healthy subjects, not suffering from any psychiatric or neurological disorders were included as controls. One healthy control was excluded due to failure to follow instructions, and thus the final inclusion counted 20 controls (12 women and 8 men). Sixteen controls had a university degree and 4 reported upper secondary level education, 19 were nonsmokers, one had smoked in the past but discontinued, and one had a history of depression. Age range was 20–65 years. The ED group was significantly older than the control group t(38)=−2.340, p=.025, with a mean and SD of 47.5 ± 10 years for the ED group and 39.3 ± 11.9 years for the controls. We therefore used age as a covariate in the ANOVA. No differences in sex or education were found, see for demographics. All participants choose to perform the pen and paper task, the test (SAWM) and the OPATUS-CPT with their right hand.
Table 1. Demographic data of participants.
The preliminary analysis showed that only the DS, DSC and Stroop fNIRS data in the left VMC fulfilled the assumptions for repeated ANOVA. For the other test, non-parametric analyses were used as discussed in method section (Supplementary Table 1).
3.2. Fatigue
On the MFS questionnaire measuring trait mental fatigue, i.e. mental fatigue in daily life over a prolonged period, a significant difference was seen with Z = 5.40, and FDR adjusted p<.001 and Cohen’s d of 3.28. The mean score for the ED patients on the MFS was 20.6 (SD 4.5) compared to the mean score for the controls of 3.3 (SD 2.9). To measure the current mental fatigue state, a Visual analogue scale (VAS) describing the subjectively experienced energy level was performed. This was carried out before and after the study session. The ED patients rated their experienced energy level as significantly lower than the controls, both before and after the test session with Z = 3.82 and FDR adjusted p=.001 and Cohen’s d of 1.54 before the test session and Z = 5.02 and FDR adjusted p<.001 and Cohen’s d of 2.81 after the test session. Moreover, the ED group rated their experienced energy level significantly lower at the end of the test session, with Z = 3.56 and an FDR adjusted p=.007 and Cohen’s d of 2.83, whereas no difference was seen for the controls. (, Supplementary Table 2). The repeated measure of the VAS showed that the prolonged mental activity had the intended effect of increasing the acute fatigue state of the patients.
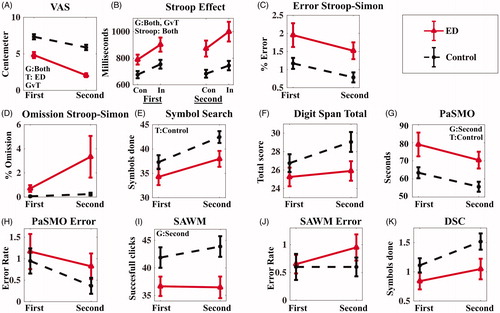
Figure 2. Comparison of the behavioral result from the first and second test sessions. Participants with exhaustion disorder (ED) in full lines with controls in dashed lines. (A) Visual Analogue Scale, (B) Stroop effect reaction time, (C) Error in percent in Stroop–Simon, (D) Omission in percent in Stroop–Simon, (E) Symbol Search, (F) Digit Span total score, (G) Parallel Serial Mental Operation (PaSMO) performance, (H) PaSMO error rate, (I) Speed, divided Attention and Working Memory test (SAWM), (J) SAWM error rate, (K) Digit Symbol Coding (DSC). In figure (B and C) Con represents the congruent stimuli, and in the incongruent stimuli. Data are presented as mean, with standard error of mean (SEM) as error bars. G: significant group effects; T: significant time effects; GvT: significant group vs. time interaction; Stroop: significant Stroop effects. Significant based on FDR adjusted p-value <.05.
3.3. Behavioral result of neuropsychological tests
The controls showed a faster reaction time during both Stroop–Simon tests, with Z = 2.557 and FDR adjusted p=.033 and Cohen’s d of 0.89 for the first test and Z = 3.157 and FDR adjusted p=.004 and Cohen’s d of 1.192 for the second test. There was also an interaction between Time and Group, or difference of difference, Z= −2.54 and FDR adjusted p=.033 and Cohen’s d of -0.90, showing that the ED group become slower than the controls during second Stroop–Simon test (, and Supplementary Table 3).
The ED patients required significantly longer time compared to controls to complete the PaSMO test during the second set of tests with Z = 2.712 and FDR adjusted p=.023 and Cohen’s d of 1.01. In the PaSMO test, the participants are asked to verbally reproduce the whole alphabet with corresponding digits as fast as possible (i.e. “A1”, “B2”, “C3”, etc.), (Supplementary Table 2 and ). Three of the ED patients were not able to complete the test during the second set stating that it was too difficult. The ED patients were also slower on the SAWM the second time Z= −2.42 and an FDR adjusted p=.043 and Cohen’s d of −0.82 ().
Both groups improved their performance on the DSC the second time, with F(1,38) = 9.253, an FDR adjusted p=.042 and a ηp2=0.2, but only the control group improved their performance on the SS with Z = 3.83and FDR adjusted p=.002 and Cohen’s d of 3.32 (). No significant difference between the groups was detected for the continuous performance test (OPATUS-CPTA) (Supplementary Table 2).
3.4. fNIRS result of neuropsychological tests
3.4.1. Stroop–Simon fNIRS
The fNIRS analysis was performed on the Stroop dimension (conflict between semantic meaning and ink color) of the Stroop–Simon test and revealed a group difference for oxy-Hb bilaterally in the FPA, the VMC and DLPFC as well as in the right VLPFC and the left DMC for both test sessions (Supplementary Table 5). In these areas, a smaller increase in oxy-Hbwas detected for the ED group, irrespectiveof the stimulus type (congruent or incongruent) compared to the controls ( and Supplementary Table 5 for the repeated ANOVA statistics). No time effect (test vs. retest) norinteraction between Time and Group for any of the ROIswas detected (Supplementary Tables 4 and 5).
Figure 3. Concentration of oxygenated hemoglobin for the Stroop element of the Stroop–Simon fNIRS task. The data are presented as averages of both the first and second test sessions combined. (A) Each diagram represents a different region of interest in the left or right hemisphere (FPA: frontal polar area; VLPFC: ventrolateral prefrontal cortex; VMC: ventral motor cortex; DLPFC: dorsolateral prefrontal cortex; DMC: dorsal motor cortex). The black bars represent the healthy control group and the red bars are from the ED group. Con represents the Stroop congruent trails, and In represents the Stroop incongruent trials, as described and in the Statistics section. (B) Correlation of oxy-Hb for the Stroop effect (i.e. difference in oxy-Hb concentration between incongruent and congruent trails) with MFS score in the left VLPFC. The error bars are standard error of mean. G: significant group effects; T: significant time effects; GvS; significant Group vs. Stroop effect interaction; S: significant Stroop effects. Significant based on FDR adjusted p-value <.05.
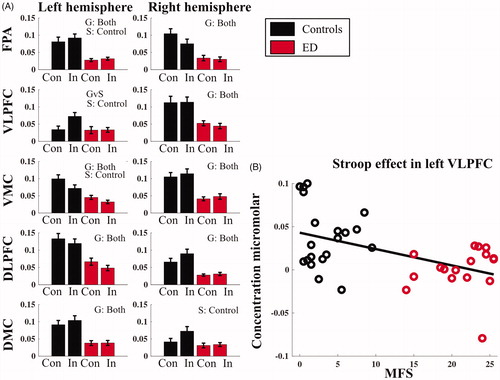
When analyzing the Stroop effecton the hemodynamic response (difference between congruent and incongruent trials), the controls showed an effect in left VLPFC with Z = 3.50 and FDR adjusted p=.002 and Cohen’s d of 2.53, left VMC F(1,35)=11.29 with an FDR corrected p=.011 and ηp2 < 0.24, right DMC Z = 3.02 and FDR adjusted p=.005 and Cohen’s d of 1.83. We also detected a reversed Stroop effect in right FPA with Z= −2.98 and FDR adjusted p=.006 and Cohen’s d of −1.79 (Supplementary Table 6). As a main effect of the ANOVA, both groups together showed a Stroop effect in the left VMC; however, the post hoc tests revealed that only the controls had a significant Stroop effect F = 9.54 and FDR adjusted p=.0.013, while the ED group did not respond to congruent or incongruent trials differently with regard to brain activation in the left VMC (F = 2.94 and FDR adjusted p=.392). There was a significant interaction between Stroop Effect and Group in left VLPFC with Z = 3.01 and FDR adjusted p=.009 and Cohen’s d of 1.14, showing that the ED group had similar oxy-Hb responses during both congruent and incongruent trials, whereas the controls had higher oxy-Hb activation in the incongruent compared to the congruent trials in the left VLPFC. The Spearman’s correlation between MFS and Stroop effect (the oxy-Hb difference between incongruent and congruent trials) in the left VLPFC was significant (rho=−0.416, FDR adjusted p=.033) (), indicating that subjects with higher MFS scores had a reduced difference in left VLPFC activity between incongruent vs. congruent tasks.
3.4.2. Symbol search and digit symbol coding
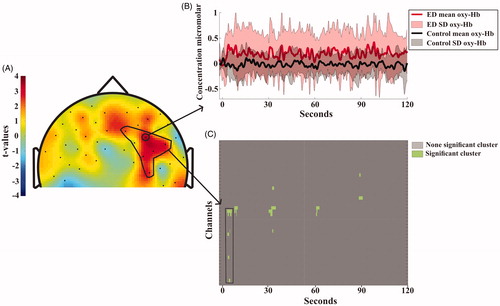
Both the SS and the DSC revealed clusters of higher activity for the ED than the controls during the first test session but not the second. During the SS task of the first test session, the ED patients had more widespread activation, i.e. larger changes of oxy-Hb in the right DLPFC during the latter part of the task, specifically in the anterior locations (). During the first DSC test the ED patients showed more activation in the right DLPFC and DMC and this continued throughout the test session ().
Figure 4. (A) Topographical visualization of activation differences after 100 seconds of the Symbol Search task. Positive t-values indicate higher concentration of oxygenated hemoglobin for ED patients compared to controls. Negative t-values indicate higher concentration of oxygenated hemoglobin for controls compared to patients. The area encircled with a black line in the right DLPFC shows the channel location of the significant cluster, (for detail, see Statistic section). (B) Shows the mean and standard deviation of oxy-Hbchange during the whole test session for each group. The full lines and light field indicate the average oxy-Hb activity and standard deviation for each of the groups. Location of the channel is indicated by the arrow in A). (C) shows the significant clusters. The cluster encircled with the black lines is also depicted in the black marked area in A).
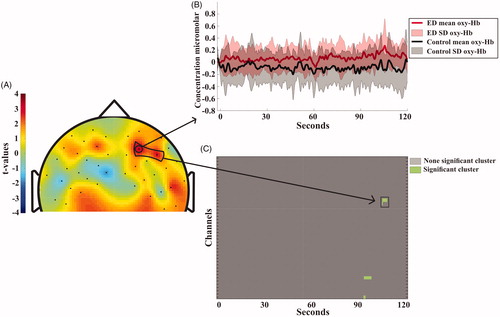
Figure 5. Topographical visualization of activation differences after 5 seconds of the Digit Symbol Coding task. Positive t-values indicate higher concentration of oxygenated hemoglobin for ED patients compared to controls. Negative t-values indicate higher concentration of oxygenated hemoglobin for controls compared to patients. The area encircled with a black line in the right DLPFC shows the channel location of the significant cluster, for detail see Statistic section. (B) Shows the mean and standard deviation of oxy-Hb change during the whole test session for each group. The full lines and light field indicate the average oxy-Hb activity and standard deviation for each of the groups. Location of the channel is indicated by the arrow in A). (C) shows the significant clusters. The cluster encircled with the black lines is also depicted in the black marked area in A).
3.4.3. SAWM, OPATUS-CPTA, PaSMO, and digit span
No significant clusters of altered oxy-Hb concentrations were found for the SAWM data or the OPATUS-CPTA, i.e. no difference between the ED group and controls was detected during the first or second session for SAWM or for the OPATUS-CPTA, which was performed only once. Since both the PaSMO and the Digit Span test required verbal responses, which created substantial motion artifacts in the fNIRS signal, the imaging data were not analyzed.
4. Discussion
The aim of this study was to explore functional activity in the frontal cortex areas in relation to cognitive performance and mental fatigue in a test-retest design in patients with stress-related ED. In line with previous research, we confirm our hypothesis showing altered functional activity in the frontal cortex among the ED patients compared to healthy controls, especially in the PFC. This was already detectable during the first test series, i.e. there was a group difference for the first Stroop–Simon, SS and DSC tasks, indicating that changes were due to the clinical exhaustion, instead of being induced by the prolonged testing procedure. The ED group was differently affected by 150 min test session compared to the healthy controls regarding changes in subjective energy levels and cognitive performance in the Stroop–Simon task. However, contrary to our other hypothesis, this was not the case for functional brain activation, i.e. no Time vs. Group interaction was detected with regard to fNIRS data. Neither the controls nor the ED group showed any difference in oxy-Hb between first and second Stroop–Simon task.
A common finding in studies and in clinical practice is that patients with ED subjectively perceive having problems with executive functions (Oosterholt et al., Citation2012). For objective measures however, the findings are more ambiguous (Deligkaris et al., Citation2014). Several studies have shown impairment in the executive function domain for ED patients, but there are inconsistencies in terms of which functions are impaired, and some studies fail to detect any deficiencies at all (Oosterholt et al., Citation2016). Problems with working memory are fairly consistently reported (Diestel et al. Citation2013; Ohman et al., Citation2007; Oosterholt et al., Citation2012; Sandstrom et al. Citation2005, Citation2011), followed by lowered executive inhibition (Diestel et al., Citation2013; Jonsdottir et al., Citation2013; Linden et al., Citation2005) or mental flexibility (Ohman et al., Citation2007; Oosterholt et al., Citation2012), but studies seldom show problems in all three areas. There are several possible explanations for these heterogenous results, such as the heterogeneity of the patient population or impairments being too subtle for the applied neuropsychological tests to detect a difference (Oosterholt et al., Citation2012). Our study indicates that functional brain imaging could provide objective measurements that validate the subjective reports of cognitive problems, by linking them to functional deviation during cognitive performance.
Functional and structural studies assessing individuals with ED have shown alterations associated with the PFC. Functional studies, using fMRI during working memory tasks report ED patients having less activation in the PFC (Sandstrom et al. Citation2012; Gavelin et al. Citation2017), while an ERP study reported increased activity (Sokka et al., Citation2016). Chou et al. used fNIRS on a verbal fluency task and found a negative association between higher occupational burnout scores and lower functional activation in the PFC during a verbal fluency task (Chou et al., Citation2016). Even though these studies point toward problems in the same brain area, the reported deviations do not necessarily match, as they evaluate different tasks with different imaging modalities on different time scales. Structural and resting-state studies have also found alterations in the PFC for ED patients, including reduction in gray matter volume in the prefrontal cortex (Blix et al., Citation2013; Savic, Citation2015; Savic et al., Citation2018), and less functional connectivity between the DLPFC, ACC, amygdala and motor cortex, compared to healthy controls (Golkar et al., Citation2014; Jovanovic et al., Citation2011).
In the Stroop–Simon test for conflict processing, we found that the ED group had comparatively lower activity (smaller surges of oxy-Hb) bilaterally in FPA, VMC, DLPFC as well as in the right VLPFC and the left DMC, both during the first and second test session(see ). This contrasts with results from our processing speed tasks (SS and DSC) where the ED group had a comparatively stronger oxy-Hb response. One plausible reason explaining this difference is that the Stroop–Simon test involving 164 trials presented during 25 minutes while the SS and DSC required maximum performance during 2 minutes. The design difference between event-response and continuous trials also required different data processing and analysis, making the results difficult to compare.
The differential impact of the Stroop effect for incongruent vs. congruent trials in the left VLPFC inpatients compared to controls ( and Supplementary Table 6) suggests that patients with ED do not have the same capacity to involve this part of the prefrontal cortex in conflict processing. Additionally, the correlation between the MFS scale and Stroop effect indicates that the ability to utilize the left VLPFC in conflict processing is reduced with higher mental fatigue () which is in line with previous findings (Chou et al., Citation2016). A complementary finding was that the control group also showed a Stroop effect in the left VMC and the right DMC, both with very large effect sizes, while the ED group did not show a Stroop effect in any of the ROIs.
Paired with the oxy-Hb results in the Stroop–Simon test, the reaction time analysis revealed that the ED group was slower in both test session, with a very large effect size for the first test and large effect size for the second test. The change in reaction time between test and retest was also different between the groups, suggesting that the ED group was affected by the prolonged mental activity in a way that the controls were not. However, we could not see any difference between the two time points when we analyzed the groups separately and adjusted for FDR, which makes it less likely that the ED group’s reaction time is affected in a different way than the controls’ by the prolonged mental activity ( and Supplementary Table 2).
Notable for the two processing speed tests, SS and DSC, there were differences in functional activity in the PFC between the groups, where the ED had stronger oxy-Hb responses in the right DLPFC, but we could not determine any statistical difference at a behavioral level. Our results are in line with previous reports, which showed that ED patients, after 1.5 to 3 years still experience cognitive problems but that cognitive impairment might be relatively subtle to the extent that standard neuropsychological test batteries are not sufficient in detecting the problems perceive by the patients (Jonsdottir et al., Citation2017; Oosterholt et al., Citation2016). It is also plausible that over commitment among the patients results in rather strong performance on test but at cost of prolonged fatigue (Krabbe et al., Citation2017). Since neither SS nor DSC have a built-in control condition, such as the “congruent vs. incongruent” conditions in the Stroop task, we can only conclude that ED patients use the DLPFC differently when solving these tasks. Thus, more functional imaging studies with ED patients are warranted in order to detect in greater detail the alterations in the cognitive processing.
Of the five tests analyzed for fNIRS, three tests (Stroop–Simon, SS and DSC) showed group difference in the fNIRS data, while only the Stroop-Simon produced differences in the behavioral response. Two tests (SAWM and OPATUS-CPTA) revealed no difference on the fNIRS data but the ED group performed slower on the second SAWM test. For the PaSMO test, which was not analyzed with fNIRS data, we detected a group difference in the second test at the behavioral level which is in accordance with previous reports (Jonsdottir et al., Citation2013). Because PaSMO imposes high demand for simultaneous working memory, updating and shifting, it could be considered more challenging compared to other tests used here. Since the average time from ED diagnosis was almost four years in our cohort, it appears that assessments using more cognitively demanding tasks may better capture the cognitive problems ED patients experience at such a long time after initial diagnosis.
ED patients experienced a higher degree of mental fatigue in their daily living, demonstrated by their high ratings on the MFS questionnaire. They also reported acutely lower energy levels, in the VAS, both at the start and at the end of the test session compared to controls, and the ED group had a decline in subjective energy levels whereas the controls showed no change, indicating that the prolonged mental activity does indeed affect patients with ED, even such a long time after being diagnosed. The results of this study highlight the potential of brain imagining studies to validate the subjective reports of cognitive problems from ED patients. Even though we could in the second test session detect difference between the groups in the SAWM and PaSMO, it was in the Stroop–Simon, SS and DSC, where we were able to identify deviation in functional activity in the DLPFC and VLPFC, areas which are important for executive function. There is a shortage of functional imaging studies in ED patients and the ease of use, low cost and portability of the fNIRS system makes it a promising candidate as a future diagnostic tool.
5. Limitations
There are several limitations to this study. We lack information concerning cerebral atrophy and anatomical variability for both groups. Since ED could be associated with structural changes in the PFC, such information could have been informative.
Since we have not performed any equivalence tests, the lack of a significant difference does not mean that they perform in a similar way. There is a chance that, due to the FDR correction, and the small sample size, that this study suffers from some type II errors. Thus, t-, Z- and F-values together with degrees of freedom and effect sizes are presented to help assessing the result of each research question.
In order to make the Stroop–Simon test manageable we chose a nine-second inter-stimulus interval. Since the hemodynamic response normally takes twelve seconds to return to baseline, we were not able to study some temporal properties of the hemodynamic response such as time to baseline and time to peak. Moreover, a coding problem in the Stroop–Simon data resulted in that we were not able to analyze the Simon effect independently in the fNIRS data as intended.
6. Conclusion
ED patients experienced a high degree of mental fatigue and showed altered functional activity in the prefrontal cortex during conflict processing and processing speed tasks. This indicates that, even though ED patients perform similarly on behavioral measurements, they process information differently in the prefrontal cortex. The clinical relevance of these differences needs to be further explored. Moreover, the cross-sectional design of this study does not allow any conclusion regarding a possible difference from before diagnosis. We were able to detect that continuous, intense cognitive performance during 150 minutes affected the ED group differently than controls in terms of increased mental fatigue and longer reaction time on the Stroop–Simon task. There was no change in functional brain activation between the first and the second time the ED group performed the Stroop–Simon test, indicating that they showed altered functional activity from start. Our results indicate that fNIRS is a promising tool that may help describe and understand the cognitive changes accompanying exhaustion disorder.
ED_Supplementory_resbmit.docx
Download MS Word (153.2 KB)Acknowledgments
BJ and HGK contributed equally to the manuscript. We wish to thank Robert Cooper at UCL for using some of his MATLAB scripts. We are very grateful to OPATUS and Petter Knagenhjelm for providing us with the OPATUS-CPTA test and for all the technical support we have received. We also wish to thank William Hedley Thompson and Niklas Klasson for their valuable input and support and Karin Nygren and Susanne Ellbin for valuable help with the recruitment of ED patients.
Disclosure statement
No potential conflict of interest was reported by the author(s).
Additional information
Funding
References
- Aasted, C. M., Yucel, M. A., Cooper, R. J., Dubb, J., Tsuzuki, D., Becerra, L., Petkov, M. P., Borsook, D., Dan, I., & Boas, D. A. (2015). Anatomical guidance for functional near-infrared spectroscopy: AtlasViewer tutorial. Neurophotonics, 2(2), 020801. https://doi.org/https://doi.org/10.1117/1.NPh.2.2.020801
- Blix, E., Perski, A., Berglund, H., & Savic, I. (2013). Long-term occupational stress is associated with regional reductions in brain tissue volumes. PLOS One, 8(6), e64065. https://doi.org/https://doi.org/10.1371/journal.pone.0064065
- Brigadoi, S., & Cooper, R. J. (2015). How short is short? Optimum source-detector distance for short-separation channels in functional near-infrared spectroscopy. Neurophotonics, 2(2), 025005. https://doi.org/https://doi.org/10.1117/1.NPh.2.2.025005
- Chou, P. H., Lin, W. H., Hung, C. A., Chang, C. C., Li, W. R., Lan, T. H., & Huang, M. W. (2016). Perceived occupational stress is associated with decreased cortical activity of the prefrontal cortex: A multichannel near-infrared spectroscopy study. Scientific Reports, 6, 39089. https://doi.org/https://doi.org/10.1038/srep39089
- Deligkaris, P., Panagopoulou, E., Montgomery, A. J., & Masoura, E. (2014). Job burnout and cognitive functioning: A systematic review. Work & Stress, 28, 107–123.
- Diestel, S., Cosmar, M., & Schmidt, K.-H. (2013). Burnout and impaired cognitive functioning: The role of executive control in the performance of cognitive tasks. Work & Stress, 27(2), 164–180. https://doi.org/https://doi.org/10.1080/02678373.2013.790243
- Egner, T. (2008). Multiple conflict-driven control mechanisms in the human brain. Trends in Cognitive Sciences, 12(10), 374–380. https://doi.org/https://doi.org/10.1016/j.tics.2008.07.001
- Egner, T., Delano, M., & Hirsch, J. (2007). Separate conflict-specific cognitive control mechanisms in the human brain. NeuroImage, 35(2), 940–948. https://doi.org/https://doi.org/10.1016/j.neuroimage.2006.11.061
- Everdell, N. L., Gibson, A. P., Tullis, I. D. C., Vaithianathan, T., Hebden, J. C., & Delpy, D. T. (2005). A frequency multiplexed near-infrared topography system for imaging functional activation in the brain. Review of Scientific Instruments, 76(9), 093705. https://doi.org/https://doi.org/10.1063/1.2038567
- Forster, S. E., & Cho, R. Y. (2014). Context specificity of post-error and post-conflict cognitive control adjustments. PLOS One, 9(3), e90281. https://doi.org/https://doi.org/10.1371/journal.pone.0090281
- Gagnon, L., Perdue, K., Greve, D. N., Goldenholz, D., Kaskhedikar, G., & Boas, D. A. (2011). Improved recovery of the hemodynamic response in diffuse optical imaging using short optode separations and state-space modeling. NeuroImage, 56(3), 1362–1371. https://doi.org/https://doi.org/10.1016/j.neuroimage.2011.03.001
- Gavelin, H. M., Neely, A. S., Andersson, M., Eskilsson, T., Jarvholm, L. S., & Boraxbekk, C. J. (2017). Neural activation in stress-related exhaustion: Cross-sectional observations and interventional effects. Psychiatry Research. Neuroimaging, 269, 17–25. https://doi.org/https://doi.org/10.1016/j.pscychresns.2017.08.008
- Glise, K., Ahlborg, G., Jr., & Jonsdottir, I. H. (2012). Course of mental symptoms in patients with stress-related exhaustion: does sex or age make a difference? BMC Psychiatry, 12, 18. https://doi.org/https://doi.org/10.1186/1471-244X-12-18
- Golkar, A., Johansson, E., Kasahara, M., Osika, W., Perski, A., & Savic, I. (2014). The influence of work-related chronic stress on the regulation of emotion and on functional connectivity in the brain. PLOS One, 9(9), e104550. https://doi.org/https://doi.org/10.1371/journal.pone.0104550
- Grossi, G., Perski, A., Osika, W., & Savic, I. (2015). Stress-related exhaustion disorder-clinical manifestation of burnout? A review of assessment methods, sleep impairments, cognitive disturbances, and neuro-biological and physiological changes in clinical burnout . Scand J Psychol, 56(6), 626–636. https://doi.org/https://doi.org/10.1111/sjop.12251
- Huppert, T. J., Diamond, S. G., Franceschini, M. A., & Boas, D. A. (2009). HomER: a review of time-series analysis methods for near-infrared spectroscopy of the brain. Applied Optics, 48(10), D280–98. https://doi.org/https://doi.org/10.1364/ao.48.00d280
- Johansson, B., & Ronnback, L. (2014). Evaluation of the Mental Fatigue Scale and its relation to Cognitive and Emotional Functioning after Traumatic Brain Injury or Stroke. International Journal of Physical Medicine & Rehabilitation, 2(1). 1–7. https://doi.org/10.4172/2329-9096.1000182
- Johansson, B., & Ronnback, L. (2015). Novel computer tests for identification of mental fatigue after traumatic brain injury. NeuroRehabilitation, 36(2), 195–202. https://doi.org/https://doi.org/10.3233/NRE-151207
- Johansson, B., Starmark, A., Berglund, P., Rodholm, M., & Ronnback, L. (2010). A self-assessment questionnaire for mental fatigue and related symptoms after neurological disorders and injuries. Brain Injury, 24(1), 2–12. https://doi.org/https://doi.org/10.3109/02699050903452961
- Jonsdottir, I. H., Nordlund, A., Ellbin, S., Ljung, T., Glise, K., Wahrborg, P., Sjors, A., & Wallin, A. (2017). Working memory and attention are still impaired after three years in patients with stress-related exhaustion. Scandinavian Journal of Psychology, 58(6), 504–509. https://doi.org/https://doi.org/10.1111/sjop.12394
- Jonsdottir, I. H., Nordlund, A., Ellbin, S., Ljung, T., Glise, K., Wahrborg, P., & Wallin, A. (2013). Cognitive impairment in patients with stress-related exhaustion. Stress (Amsterdam, Netherlands)), 16(2), 181–190. https://doi.org/https://doi.org/10.3109/10253890.2012.708950
- Jovanovic, H., Perski, A., Berglund, H., & Savic, I. (2011). Chronic stress is linked to 5-HT(1A) receptor changes and functional disintegration of the limbic networks. NeuroImage, 55(3), 1178–1188. https://doi.org/https://doi.org/10.1016/j.neuroimage.2010.12.060
- Krabbe, D., Ellbin, S., Nilsson, M., Jonsdottir, I. H., & Samuelsson, H. (2017). Executive function and attention in patients with stress-related exhaustion: perceived fatigue and effect of distraction. Stress (Amsterdam, Netherlands), 20(4), 333–340. https://doi.org/https://doi.org/10.1080/10253890.2017.1336533
- Linden, D. V. D., Keijsers, G. P. J., Eling, P., & Schaijk, R. V. (2005). Work stress and attentional difficulties: An initial study on burnout and cognitive failures. Work & Stress, 19(1), 23–36. https://doi.org/https://doi.org/10.1080/02678370500065275
- Maris, E., & Oostenveld, R. (2007). Nonparametric statistical testing of EEG- and MEG-data. Journal of Neuroscience Methods, 164(1), 177–190. https://doi.org/https://doi.org/10.1016/j.jneumeth.2007.03.024
- MATLAB. (2014). MATLAB. Massachusetts, MA: The MathWorks, Inc.
- Ohman, L., Nordin, S., Bergdahl, J., Slunga Birgander, L., & Stigsdotter Neely, A. (2007). Cognitive function in outpatients with perceived chronic stress. Scandinavian Journal of Work, Environment & Health, 33(3), 223–232. https://doi.org/https://doi.org/10.5271/sjweh.1131
- Oosterholt, B. G., Maes, J. H. R., Van der Linden, D., Verbraak, M., & Kompier, M. A. J. (2016). Getting better, but not well: A 1.5 year follow-up of cognitive performance and cortisol levels in clinical and non-Clinical burnout. Biological Psychology, 117, 89–99. https://doi.org/https://doi.org/10.1016/j.biopsycho.2016.02.009
- Oosterholt, B. G., Van der Linden, D., Maes, J. H., Verbraak, M. J., & Kompier, M. A. (2012). Burned out cognition–cognitive functioning of burnout patients before and after a period with psychological treatment. Scandinavian Journal of Work, Environment & Health, 38(4), 358–369. https://doi.org/https://doi.org/10.5271/sjweh.3256
- Österberg, K., Karlson, B., & Hansen, Å. M. (2009). Cognitive performance in patients with burnout, in relation to diurnal salivary cortisol. Stress, 12(1), 70–81. https://doi.org/https://doi.org/10.1080/10253890802049699
- Osterberg, K., Karlson, B., Malmberg, B., & Hansen, A. M. (2012). A follow-up of cognitive performance and diurnal salivary cortisol changes in former burnout patients. Stress, 15(6), 589–600. https://doi.org/https://doi.org/10.3109/10253890.2011.648972
- Plichta, M. M., Herrmann, M. J., Baehne, C. G., Ehlis, A‐C., Richter, M. M., Pauli, P., & Fallgatter, A. J. (2007). Event‐related functional near‐infrared spectroscopy (fNIRS) based on craniocerebral correlations: Reproducibility of activation? Human Brain Mapping, 28(8), 733–741. https://doi.org/https://doi.org/10.1002/hbm.20303
- Plichta, M. M., Herrmann, M. J., Baehne, C. G., Ehlis, A. C., Richter, M. M., Pauli, P., & Fallgatter, A. J. (2006). Event-related functional near-infrared spectroscopy (fNIRS): Are the measurements reliable? NeuroImage, 31(1), 116–124. https://doi.org/https://doi.org/10.1016/j.neuroimage.2005.12.008
- Reitan, R. M. W. (1985). The Halstead-Reitan neuropsychological test battery. AZ Neuropsychology Press.
- Reitan, R. M., & Wolfson, D. (1985). The Halstead–Reitan neuropsychological test battery: theory and clinical interpretation. Neuropsychology Press.
- Sandstrom, A., Peterson, J., Sandstrom, E., Lundberg, M., Nystrom, I. L., Nyberg, L., & Olsson, T. (2011). Cognitive deficits in relation to personality type and hypothalamic-pituitary-adrenal (HPA) axis dysfunction in women with stress-related exhaustion. Scandinavian Journal of Psychology, 52(1), 71–82. https://doi.org/https://doi.org/10.1111/j.1467-9450.2010.00844.x
- Sandstrom, A., Rhodin, I. N., Lundberg, M., Olsson, T., & Nyberg, L. (2005). Impaired cognitive performance in patients with chronic burnout syndrome. Biological Psychology, 69(3), 271–279. https://doi.org/https://doi.org/10.1016/j.biopsycho.2004.08.003
- Sandstrom, A., Sall, R., Peterson, J., Salami, A., Larsson, A., Olsson, T., & Nyberg, L. (2012). Brain activation patterns in major depressive disorder and work stress-related long-term sick leave among Swedish females. Stress (Amsterdam, Netherlands)), 15(5), 503–513. https://doi.org/https://doi.org/10.3109/10253890.2011.646347
- Sato, H., Yahata, N., Funane, T., Takizawa, R., Katura, T., Atsumori, H., Nishimura, Y., Kinoshita, A., Kiguchi, M., Koizumi, H., Fukuda, M., & Kasai, K. (2013). A NIRS-fMRI investigation of prefrontal cortex activity during a working memory task. NeuroImage, 83, 158–173. https://doi.org/https://doi.org/10.1016/j.neuroimage.2013.06.043
- Savic, I. (2015). Structural changes of the brain in relation to occupational stress. Cerebral Cortex (New York, N.Y.: 1991), 25(6), 1554–1564. https://doi.org/https://doi.org/10.1093/cercor/bht348
- Savic, I., Perski, A., & Osika, W. (2018). MRI shows that exhaustion syndrome due to chronic occupational stress is associated with partially reversible cerebral changes. Cerebral Cortex, 28(3), 894–906. https://doi.org/https://doi.org/10.1093/cercor/bhw413]
- Singh, A. K., Okamoto, M., Dan, H., Jurcak, V., & Dan, I. (2005). Spatial registration of multichannel multi-subject fNIRS data to MNI space without MRI. NeuroImage, 27(4), 842–851. https://doi.org/10.1016/j.neuroimage.2005.05.019
- Singh, A., Clowney, L., Okamoto, M., Cole, J., & Dan, I. (2008). Scope of resampling-based tests in fNIRS neuroimaging data analysis. Statistica Sinica, 18, 1519–1534.
- Singh, A. K., & Dan, I. (2006). Exploring the false discovery rate in multichannel NIRS. NeuroImage, 33(2), 542–549. https://doi.org/https://doi.org/10.1016/j.neuroimage.2006.06.047
- Sokka, L., Leinikka, M., Korpela, J., Henelius, A., Ahonen, L., Alain, C., Alho, K., & Huotilainen, M. (2016). Job burnout is associated with dysfunctions in brain mechanisms of voluntary and involuntary attention. Biological Psychology, 117, 56–66. https://doi.org/https://doi.org/10.1016/j.biopsycho.2016.02.010
- Uludağ, K., Steinbrink, J., Villringer, A., & Obrig, H. (2004). Separability and cross talk: optimizing dual wavelength combinations for near-infrared spectroscopy of the adult head. NeuroImage, 22(2), 583–589. https://doi.org/https://doi.org/10.1016/j.neuroimage.2004.02.023
- Wechsler, D. (2010). Wechsler Adult Intelligence Scale – fourth edition. Stockholm.
- Ye, J. C., Tak, S., Jang, K. E., Jung, J., & Jang, J. (2009). NIRS-SPM: statistical parametric mapping for near-infrared spectroscopy. NeuroImage, 44(2), 428–447. https://doi.org/https://doi.org/10.1016/j.neuroimage.2008.08.036
- Yucel, M. A., Selb, J., Cooper, R. J., & Boas, D. A. (2014). Targeted principle component analysis: a new motion artifact correction approach for near-infrared spectroscopy. J Innov Opt Health Sci, 1;7(2):1350066. https://doi.org/10.1142/S1793545813500661