
 ?Mathematical formulae have been encoded as MathML and are displayed in this HTML version using MathJax in order to improve their display. Uncheck the box to turn MathJax off. This feature requires Javascript. Click on a formula to zoom.
Abstract
Posttraumatic stress disorder (PTSD) is triggered by traumatic events in 10–20% of exposed subjects. N-linked glycosylation, by modifying protein functions, may provide an important environmental link predicting vulnerability. Our goals were (1) to find alterations in plasma N-glycome predicting stress-vulnerability; (2) to investigate how trauma affects N-glycome in the plasma (PGP) and in three PTSD-related brain regions (prefrontal cortex, hippocampus and amygdala; BGP), hence, uncover specific targets for PTSD treatment. We examined male (1) controls, (2) traumatized vulnerable and (3) traumatized resilient rats both before and several weeks after electric footshock. Vulnerable and resilient groups were separated by z-score analysis of behavior. Higher freezing behavior and decreased social interest were detected in vulnerable groups compared to control and resilient rats. Innate anxiety did not predict vulnerability, but pretrauma levels of PGP10(FA1G1Ga1), PGP11(FA2G2), and PGP15(FA3G2) correlated positively with it, the last one being the most sensitive. Traumatic stress induced a shift from large, elaborate N-glycans toward simpler neutral structures in the plasma of all traumatized animals and specifically in the prefrontal cortex of vulnerable rats. In plasma trauma increased PGP17(A2G2S) level in vulnerable animals. In all three brain regions, BGP11(F(6)A2B) was more abundant in vulnerable rats, while most behavioral correlations occurred in the prefrontal cortex. In conclusion, we found N-glycans (especially PGP15(FA3G2)) in plasma as possible biomarkers of vulnerability to trauma that warrants further investigation. Posttrauma PGP17(A2G2S1) increase showed overlap with human results highlighting the utility and relevance of this animal model. Prefrontal cortex is a key site of trauma-induced glycosylation changes that could modulate the behavioral outcome.
Introduction
Posttraumatic stress disorder (PTSD) is a complicated, debilitating psychiatric disorder triggered by exposure to trauma. Its lifetime prevalence varies significantly with 8% in the United States (Kilpatrick et al., Citation2013) and 18% in Croatia several years after the end of the Homeland War (1991–1995) (Priebe et al., Citation2010). “Only” 10–20% of exposed subjects develop PTSD, depending on the presence of various risk and protective factors (Machisa Machisa et al., Citation2018). Unfortunately, the underlying neurobiological mechanisms are still not clear, available treatment options are not sufficient and 40% of patients are non-responsive. PTSD, as a multifactorial and polygenic psychiatric disorder, induces a great suffering in patients and their families, carrying an enormous mental health-, societal-, and financial-burden to the whole society. Therefore, identifying biomarkers of vulnerability and resilience and providing new treatment options for PTSD is imperative.
Glycans are enzymatic post-translational modificators of proteins and lipids (Ohtsubo & Marth, Citation2006). N-linked glycosylation is the most common type (Pivac et al., Citation2011) and it can modulate the function of a protein to be able to adapt to the constantly changing environment (Lauc et al., Citation2016). Dysregulation of glycosylation is associated with a wide range of diseases, including cancer, diabetes, cardiovascular and immunological disorders (Ohtsubo & Marth, Citation2006). About 80% of the glycosylation-related disorders affect the nervous system, providing a plausible and comprehensive explanation for the diverse pathomechanisms. It might be explained by the existence of the perineuronal net composed of glycans, serving as a regulatory factor for interneuronal communication (Wen et al., Citation2018). Recent technological advances allow reliable, high-throughput quantification of glycans (Pivac et al., Citation2011). In relation to psychiatric disorders, changes in glycan-related processes were found in attention deficit hyperactivity disorder (ADHD) (Pivac et al., Citation2011), Alzheimer’s disease, Parkinson’s disease (Shi et al., Citation2013), autism and schizophrenia (Barone et al., Citation2012). However, glycan alterations in relation to PTSD were not extensively studied so far. A small case report failed to find alteration (Moreno-Villanueva et al., Citation2013), while our recent human study on 543 male war veterans found 6 plasma N-glycans to be associated with PTSD (Tudor et al., Citation2019). There is no information on glycosylation patterns in animal models of PTSD, however, there are few studies on stressed animals (Konjevod et al., Citation2019).
Plasma N-glycans, synthetized in the liver (Lauc et al., Citation2010), have been shown to be an excellent biochemical variable to detect early signs of morbidity (e.g. ADHD; Pivac et al., Citation2011) with high sensitivity and specificity in an easily accessible bio-fluid. However, PTSD is a psychiatric disorder with brain disturbances affecting mainly the prefrontal cortex (PFC), hippocampus (HC) and amygdala (Amy) (Baldi & Bucherelli, Citation2015). So far, there are no data available on glycome changes in the brains of PTSD subjects and it has yet to be confirmed that changes in the plasma glycome reflect changes in brain glycosylation. This is especially important as brain glycoproteins have been shown to include a variety of hybrid- and complex-type structures, that are not common in other organs and, therefore, have been classified as “brain-specific” (Albach et al., Citation2001).
We aimed to establish a suitable animal model to predict resilience or vulnerability to PTSD and find relevant glycomic biomarkers. Due to the importance and widespread occurrence of N-glycans, we assumed that there may be a correlation between serum N-glycan levels or brain glycoproteins and the severity of PTSD. To enhance translational values we used the same technique performed in the same laboratory that determined the N-glycome profile in human PTSD subjects in our earlier study (Tudor et al., Citation2019). To confirm that our animal model is valid, and to identify vulnerable and resilient subjects, we conducted a series of behavioral tests and also measured platelet serotonin and plasma glucocorticoid concentrations. Platelet serotonin concentrations were reported to be altered in PTSD (Kovacic Petrovic et al., Citation2019) and previous studies confirmed disturbances in stress regulation with higher hair cortisol levels in vulnerable than resilient individuals (van den Heuvel et al., Citation2020).
Methods
Animals
Adult, male Long-Evans (14–18 weeks old) and juvenile (approx. 25 days old) male Wistar (as stimulus animals) rats were obtained from a local colony (Institute of Experimental Medicine, Budapest, Hungary), starting from breeder rats originating from Charles River. The animals were housed 4/group under a standard 12 h light/dark cycle (lights on at 19.00 h) with food and water available ad libitum, and their body weights were recorded weekly. The experiments conducted on the animals were approved by the local committee for animal health and care (PE/EA/43-4/2019) and were performed according to the European Communities Council Directive recommendations for the care and use of laboratory animals (2010/63/EU).
Experimental design
Trauma was induced by electric footshocks (Zelena et al., Citation2016; ). We previously confirmed that after this type of stress exposure 14–28 days are required for the development of PTSD-like symptoms (Tulogdi et al., Citation2012). The behavior of non-shocked controls (n = 10) was compared with that of traumatized rats (n = 50). In humans, the probability of developing PTSD after traumatic life events is 20–30% (Shalev et al., Citation2017). Similarly, 20–30% of the animals are extremely vulnerable and another 20–30% are resilient to trauma, based on their behavior. Therefore, shocked animals were classified into two subcategories: trauma susceptible/vulnerable (n = 10) and resilient (n = 10), based upon their cumulative behavioral z-score (see statistical analysis).
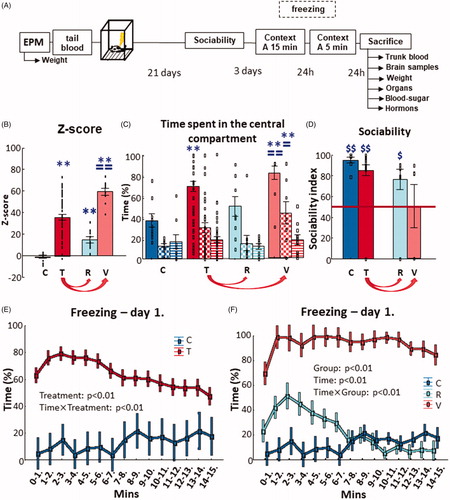
Figure 1. Experimental design and results of behavioral tests. (A) The timeline of the experimental design used to induce PTSD-like symptoms in adult, male Long-Evans rats. The EPM was used to prescreen the animals for their innate anxiety-like behavior. Tail blood–plasma was taken to measure N-glycans for identification of possible pretrauma biomarkers of resilience or vulnerability to trauma. PTSD-like behavior was induced by footshocks. Twenty-one days later behavioral screening started: sociability (mobility, social interest, and social memory) and contextual fear (within and between section extinction). When the animals were sacrificed, trunk blood–plasma and brain samples were collected to measure the possible changes in N-glycans and plasma corticosterone and platelet serotonin levels. (B) z-scores of each groups. Traumatization of the animals (N = 50) resulted in the elevation of z-scores compared to the control group (N = 10) (two-sample t-test). Based on the z-scores, which were calculated from their overall PTSD-like behavior exhibited during the various behavioral tests, two subgroups (N = 10/group) were formed within the traumatized group: a resilient and a vulnerable, which also significantly differed from each other (one-way ANOVA with Fisher LSD posthoc). (C) Sociability and social discrimination tests 3 weeks after trauma. The consecutive columns of time spent in central compartment represent the consecutive 10 min of the tests (full: habituation; checkers: sociability; striped: social discrimination). The traumatized animals spent more time in the central compartment compared to the control during habituation (full column), while the vulnerable group spent more time in the central compartment compared to the control and resilient group during habituation (full column) and sociability (checkers column) (repeated-measures ANOVA with Fisher LSD post-hoc). (D) Sociability index based on the time spent sniffing an empty holder vs one containing a stimulus animal. Control, traumatized and resilient groups showed intact sociability index (that is, over random chance 50%), but not the vulnerable animals (single sample t-test). (E) Contextual fear 1 month after trauma. The minute-bin breakdown of the time spent with freezing on day 1 showed that the traumatized animals elicited more immobility at every given time point compared to the control, and at first it increased (2–6th min), then decreased (from 7th min) compared to previous time points (repeated-measures ANOVA with Fisher LSD post-hoc). (F) When visualizing resilient and vulnerable groups separately, there is a clear separation between them. The resilient group showed more freezing compared to the control only until the 7th minute, but did not differ after that. On the contrary, the vulnerable animals froze more throughout the 15 min compared to both control and resilient groups (repeated-measures ANOVA with Fisher LSD post-hoc). Data are expressed as average SEM. Empty squares represent individual values. EPM: elevated plus-maze; PTSD: posttraumatic stress disorder; C: control; T: traumatized; R: resilient; V: vulnerable. **p < 0.01 versus control; ==p < 0.01, =p < 0.05 versus resilient; $p < 0.05, $$p < 0.01 versus random 50%
Here we used Long-Evans rat strain despite previous studies with Wistars (Zelena et al., Citation2016), because this strain has superior cognitive capacity (Gökçek-Saraç et al., Citation2015), and learning and memory are core abilities in developing fear memory, consequently leading to PTSD (Torok et al., Citation2019). Besides that, previously we kept all animals individually to avoid possible curative effect of social support (Westenbroek et al., Citation2003). However, – based upon recent ethical concerns – in the present study the animals were kept in groups. In a preliminary experiment, we successfully confirmed that the trauma induced long lasting consequences even in group housed animals. Previously, our main goal was to use pharmacological treatment in all animals (Zelena et al., Citation2016), therefore it was imperative to use a strong stress paradigm in which all rats developed PTSD-like symptoms. In the present study we aimed to separate vulnerable and resilient population, therefore, the shock intensity (current and number of shocks) used was lower than in our previous studies.
As PTSD is a complex disorder with a wide array of symptoms, we also concentrated on a battery of behavioral tests instead of a single symptom. The z-score analytical method was used to effectively combine data with different modalities (e.g. percentage, frequency). Before trauma, the elevated plus maze (EPM) was used to evaluate whether innate anxiety determines PTSD vulnerability or resilience. Next, blood samples were taken from the tail vein to determine pre-stressor plasma parameters. Twenty-one days after trauma (see ) exploratory behavior and impaired social interest was studied in a three-chamber sociability test. Classical examination of PTSD-like symptoms includes measuring contextual freezing in the trauma environment (Torok et al., Citation2019). The extinction of this phenomenon was studied within a period (15 min) and between periods (24 h apart) 24 and 25 days after trauma, respectively.
Blood (using citrate dextrose solution [ACD; Sigma Aldrich, St. Louis, MO] and water-ice) and brain samples (PFC, HC, and Amy) were collected 24 h after the last behavioral examination from decapitated animals. Heads were flushed with saline through the a. carotis, and after that brains were removed from the skull and different areas were dissected and immediately frozen on dry ice in Eppendorf tubes and stored at −80 °C until processing. Plasma and platelets were separated by sequential centrifugation (6 min 1100 rcf for platelet-rich-plasma [PRP] followed by a further 15 min at 5000 rcf) and the supernatant was stored for glycome analysis; 500 μL saline was added to the sediment containing platelets for washing and centrifugated for 15 min 5000 rcf again and stored at −20 °C until analysis.
The adrenal glands, thymus and spleen were collected, and their weight was measured to observe physiological consequences of a possible chronic stress state. The length of the intestine can reflect inflammatory processes (Hirata et al., Citation2007), thus, this was also measured.
Behavioral analysis
All tests and sampling were conducted during the early dark phase, between 9 and 12 a.m. Each rat was transferred from the housing room to the adjacent test room in a holder box. The boxes were cleaned between sessions with soap and tap water.
The behavior of the animals was recorded by a video camera and analyzed later by EthoVision XT version 13 (Noldus Information Technology b.v., Netherlands) (conditioned fear: freezing, sociability: distance traveled, velocity, frequencies to enter into the central area, elevated plus maze (EPM): distance traveled) or by an observer blind to the treatment groups using a computer-based event recorder (EPM: open and closed arm frequencies [Solomon coder, Budapest, Hungary]).
Elevated Plus maze (EPM)
The elevated plus-maze (EPM) was made of dark metal (arms 50 × 17 cm, wall height: 30 cm; platform height: 80 cm) (Aliczki et al., Citation2016). Red light was used during the test. Immediately after arrival to the test room, the rat was placed in the central area of the apparatus heading to a closed arm. Distance traveled was calculated automatically as a sign of locomotion. Open arm exploration (% open-arm entries [open-arm entries/total arm entries × 100]) was used as an indicator of anxiety, being negatively correlated with it. Open/total (open + closed) arm entries × 100 was considered as the parameter of locomotor independent anxiety.
Trauma
Stress was induced in a separate, dedicated experimental room among bright lighting conditions. Rats were placed in a Plexiglas chamber (30 × 30 × 30 cm) and after 3 min of habituation, shocks of 2 mA were administered via the grid floor of the Plexiglas cage. Five shock trains were administered per 5 min (i.e. each subject received 5 shocks). Each shock train was 1 s long at 50 Hz (Tulogdi et al., Citation2012, Zelena et al., Citation2016). Control, non-shocked rats were placed into a similar box for 8 min, but shocks were not delivered.
Three-chamber sociability test
This test was conducted 21 days after trauma under red light illumination. The test arena was made of transparent Plexiglas and divided into three compartments (center 30 × 50 cm and laterals 50 × 50 cm, wall height: 40 cm). The lateral compartments contained a circular holder (15 cm diameter) with perforated walls. The animal could visit any compartment through the center zone separated with open gates. Each rat was placed into the center zone and after a 10 min habituation period an unknown juvenile stimulus rat intruder was put behind the perforated wall that prevented physical contact. After another 10 min, the stimulus animal was placed into the opposite side-chamber, while a new, unknown stimulus animal was placed into the other compartment (social discrimination, SD). The traveling distance (cm) was determined by Ethovision 13 XT program for locomotor activity. Sociability index (SI) (time spent sniffing conspecific/(time spent with conspecific + empty holder) × 100) as well as discrimination index (DI) (time spent with new juvenile/(time spent with new + old juvenile) × 100) were also calculated.
Contextual fear
Rats were exposed to the trauma context for 15 min in the same experimental room and lighting conditions 24 days after the trauma and on the following day for 5 min without presentation of footshocks (Context A). The time spent freezing (no active movements except for breathing) was measured automatically by EthoVision 13 XT software.
Platelet serotonin measurement
Platelet serotonin (5-HT) concentration was determined in platelets by the spectrofluorimetric method (Pivac et al., Citation2004), while platelet protein concentration was measured in triplicates using the method of Lowry (Lowry et al., Citation1951). Briefly, platelets were destroyed by sonication (20 kHz, amplitude 8 × 10⁻³ mm for 60 s). Specimens of standard, blank (water) and platelet sonicates were analyzed in duplicates. All samples were deproteinized with 1 mL of 10% ZnSO4 and 0.5 mL of 1 N NaOH. For the preparation of fluorophore, 0.2 mL of l-cysteine (0.1%) and 1.2 mL of orthophtalaldehyde (0.05%) were added to deproteinized samples. The measurement of the 5-HT fluorescence was performed on a fluorescence spectrophotometer Varian Cary Eclipse using an excitation wavelength of 345 nm and emitted wavelength of 485 nm. The detection limit of the method was 10.0 ng/sample, with intra- and inter-assay coefficients of variation 3.66 and 8.69%, respectively.
Hormone measurements
Corticosterone was measured in 10 μL unextracted plasma by a radioimmunoassay (RIA) using a specific antibody developed in our institute as described earlier (see in details: Acs et al., Citation1982; Zelena et al., Citation2003). The intra-assay coefficient of variation was 7.5%. All the samples from a particular experiment were measured in one RIA.
Determination of the N-glycome profile
Sample preparation
Enzymatic N-glycan release using PNGase F (Promega, San Luis Obispo, CA) along with subsequent fluorescent labeling and clean-up using 0.2 µm GHP filter plates (Pall Corporation, Port Washington, NY) was performed on plasma (Akmacic et al., Citation2015) and brain (Klaric & Gudelj, Citation2017) samples as previously described, except they were labeled with an equimolar amount of procainamide instead of 2-aminobenzamide. Prior to ultra-performance liquid chromatography (UPLC) analysis, N-glycans were additionally purified using cotton hydrophilic interaction liquid chromatography (HILIC) solid phase extraction (SPE) (Selman et al., Citation2011). Briefly, 10 µL of labeled N-glycans was mixed with 50 µL acetonitrile (ACN), vortexed, and centrifuged. The solid phase was prepared by packing cotton into pipette tips and wetting the cotton by pipetting and expelling water (40 µL, 3×) through the tip. Using a volume of 40 µL, three consecutive rounds of SPE were performed per sample using the same tip as follows: equilibration (85% ACN, 3×); binding (N-glycan sample in 83% ACN, 20×); first wash (85% ACN + 1% trifluoroacetic acid, 3×); second wash (85% ACN, 3×); elution (18 µL water, 10×). For equilibration and washing steps solutions are expelled to waste while for the binding and elution steps the solution is expelled into the same tube.
Ultra-performance liquid chromatography (UPLC)
Procainamide-labeled N-glycans were separated on a Waters Acquity UPLC H-class system (Waters, Milford, MA) consisting of a quaternary solvent manager, sample manager, and a fluorescence (FLR) detector set with excitation and emission wavelengths of 310 nm and 370 nm, respectively. The instrument was under the control of Empower™ 3 software, build 3471 (Waters). N-glycan separation was achieved through an Acquity UPLC Glycan BEH Amide column (130 Å, 1.7 μm, 2.1 mm × 150 mm), using ammonium formate (100 mM, pH 4.4) as solvent A and ACN (100%, LC-MS grade) as solvent B. Purified N-glycans (18 μL) were diluted with ACN (100%, 42 μL), and separated using a linear gradient: for plasma N-glycans 0.561 mL/min, 28.4% → 29.5% v/v solvent A in the first 6 min and 29.5 → 36.5% v/v solvent A for the next 60 min, and for brain N-glycans 0.561 mL/min, 27 → 29.5% v/v solvent A in the first 15 min, and 29.5 → 38.7% v/v solvent A for the next 80 min. Samples were maintained at 5 °C before injection, and the column temperature was 40 °C for plasma N-glycan samples and 55 °C for brain N-glycan samples. System calibration and chromatographic run quality control were carried out using water (blank), an external standard of procainamide-labeled hydrolyzed glucose oligomers, and appropriate positive control samples, which were created by pooling different procainamide-labeled N-glycome samples of the same type and routinely employed as representative of a typical rat serum or brain N-glycan profile.
Analysis
All 60 animals were exposed to the same behavioral experimental protocol, but only the samples of 10 control, 10 resilient, and 10 vulnerable rats were used for N-glycome analysis. In all stages from sample preparation up to and including integration of chromatograms the experimenter was blind to the sample group. Samples were randomized prior to analysis to avoid batch effects. Due to the complexity of the chromatograms, data processing was performed manually to reproduce the same integration pattern on all samples. All chromatograms of the same type were integrated equally, subdividing them into 39 (plasma samples) or 52 (brain samples) N-glycan peaks (PGP and BGP, respectively), and the proportion of N-glycans inside each fraction was expressed as a percentage of the total integrated area. Each peak was assigned to a glucose unit (GU) value based on its retention time relative to glucose oligomers of known length from the external dextran ladder standard, as described before (Guile et al., Citation1996). Chromatograms were annotated with proposed N-glycan structures based on GU values of the glycan peaks using the GlycoStore database (Zhao et al., Citation2018), expert knowledge of glycobiology, and evidence from the literature (Chen et al., Citation1998; Gao et al., Citation2015; Vacchini et al., Citation2020; Zamze et al., Citation1998). Supplementary Figure 1 shows representative chromatograms of control animals. N-glycan structures were drawn using GlycoWorkbench (Ceroni et al., Citation2008) according to the standard symbol nomenclature for representation of glycan structure proposed by the Consortium for Functional Glycomics (Varki et al., Citation2009). For consistency of presentation and simplicity, outer arm modifications are depicted as in the study by Nairn et al. (Citation2012). Certain peaks lack a proposed structure as currently we do not possess enough information about them to make an informed inference.
The measured N-glycans were also grouped into derived traits to more closely reflect enzymatic activity (see Supplementary Table 1) (Keser et al., Citation2017). The corresponding value of a given derived trait was the sum of the values of appropriate N-glycan peaks. Seven blood–plasma and nine brain derived traits were investigated.
Statistical analysis
For the statistical analysis, StatSoft 13.4 software (StatSoft, Inc., Tulsa, OK) was used. Levene’s test was used to evaluate the homogeneity of variance which was not significantly different between groups. Control and traumatized animals were compared using two-sample t-test and the control-resilient-vulnerable groups using one-way ANOVA (effect of group) in the case of behavioral parameters, organs, serotonin and corticosterone levels. SI and DI were tested with single-sample t-test compared to random 50. The comparison of sides during habituation (left versus right), social preferences in sociability (rat versus holder), social discrimination (old versus new) tests (effect of treatment for the control-traumatized comparison, effect of group for the control-resilient-vulnerable comparison, effect of choice), and minute-breakdown of the fear conditioning test (effect of treatment/group, effect of time) were done with repeated-measures ANOVA. Comparison of glycan derived traits and species in blood–plasma (effect of group, time and trait/PGP) and brain (effect of group, area, and trait/BGP) was conducted by general linear module (GLM). Fisher LSD was used as a post-hoc analysis in the case of ANOVA, while Bonferroni correction in the case of GLM.
We applied z-normalization across anxiety level in different behavioral tests. Integrated z-scores were calculated according to Guilloux et al. (Citation2011) as described earlier (Balazsfi et al., Citation2018). Briefly, the z-scores of each test were calculated as (individual value minus mean of control group)/(standard deviation of control group) and averaged. The directionality of scores was adjusted so that increased scores reflected increased PTSD-like behavior. Rats were put in numerical order based on their scores and different subgroups were defined: the first 10 traumatized rats with the highest scores (reflecting stronger PTSD-like behavior) were chosen as the vulnerable group, while the last ten with the lowest scores (reflecting weaker PTSD-like behavior) were selected as the resilient group (the availability/quality of samples was also taken into consideration resulting in minor modifications).
Correlation analyses between the EPM behavior, glycan peaks, and the z-scores were done with Pearson’s correlation. Only those correlations are mentioned in the article which were statistically significant.
The N-glycan values were further analyzed by t-Distributed Stochastic Neighbor Embedding (t-SNE) analysis with log-10-transformation on normalized N-glycan data using BioVinCi version 1.1.5 for Windows, developed by BioTuring Inc., San Diego, CA, www.bioturing.com. Parameters were as follows: theta: 0.5, perplexity: 5, seed state: 1, learning rate: 200, and number of iterations: 1000. We also conducted a receiver operating characteristic (ROC) curve analysis on three PGPs, which seemed to be reliable biomarkers during previous analysis. For this purpose GraphPad Prism software (GraphPad Software, La Jolla, CA) was used. Data were expressed as mean SEM and p < 0.05 was considered as statistically significant effect.
Results
Z-scores
Z-scores showed a significant effect of treatment (t(58) = −6.003, p < 0.01) and effect of group (F(2,27) = 146.370, p < 0.01). Post-hoc analysis revealed that the average scores of both resilient and vulnerable groups were higher compared to the control group (p < 0.01 for both), but, additionally, the vulnerable group was also higher compared to the resilient one (p < 0.01) ().
General parameters
General conditions of the animals (body weight, blood sugar, weight of the brown adipose tissue) as well as chronic stress-related organ weights (thymus, adrenal gland, spleen) and intestinal length (reflecting inflammation) were assessed.
There were no differences between the control and traumatized groups in any studied parameters (Supplementary Table 2). However, during comparison of control, resilient, and vulnerable groups both the absolute (F(2,27) = 3.571, p < 0.05) and relative weight of the thymus (F(2,27) = 4.920, p < 0.05) showed a significant effect of group: the vulnerable group had bigger thymus compared to the control (absolute weight: p = 0.08; relative weight: p < 0.05) and resilient groups (absolute weight: p < 0.05; relative weight: p < 0.01).
There were no significant differences in platelet serotonin or plasma corticosterone concentrations between the studied groups (Supplementary Table 2) and there was no correlation between their corresponding concentrations and z-scores of the animals.
Behavioral tests
Elevated plus-maze test
The EPM was used to show that the animals did not differ in their locomotion before the shock and to assess whether innate anxiety predicts vulnerability to PTSD. There were no differences in the distance moved or number of closed arm entries (both representing locomotion) between any groups. The open/total % between control and soon-to-be-traumatized animals was not different either. Although there was no correlation between N-glycan levels and any EPM parameters, we found a weak correlation between the time spent (%) in the open arm and z-scores in the traumatized group (p = 0.08; r2 = 0.059) (data not shown).
Sociability test
First, the time spent in the compartments was analyzed. In relation to the central chamber during habituation, there was a significant effect of treatment (t(56) = −2.828, p < 0.01), since traumatized animals spent more time in the central chamber compared to controls (, first column of each color).
When comparing the resilient and vulnerable groups, there was a significant effect of group (F(2,26) = 10.475, p < 0.01) in the time spent in the center: vulnerable rats spent more time there compared to control (p < 0.01) and resilient (p < 0.01) group ().
During sociability (the second 10 min of the test), the difference between control and traumatized groups disappeared in the time spent in the center (, second, checkered column of each color). Both groups preferred the social chamber, which is supported by the significant effect of treatment in comparing social-non-social chambers (F(1,56) = 11.480, p < 0.01; data not shown), time spent with empty holder (F(1,17) = 57.204, p < 0.01; data not shown) and the significant differences of SI compared to the random chance level of 50% (control: t(6) = 15.590, p < 0.01; traumatized: t(34) = 6.728, p < 0.01) (). However, there was no difference between control and traumatized rats.
When comparing resilient and vulnerable groups, there was a significant effect of group (F(2,26) = 4.992, p < 0.05) in the time spent in the center (). Post-hoc analysis showed that the vulnerable animals spent more time in the center compared to both control (p < 0.01) and resilient (p < 0.05) groups. The time spent in social–non-social compartments had a significant effect of group (F(2,26) = 5.078, p < 0.05) and choice (F(1,26) = 7.554, p = 0.01) without interaction. According to the post hoc analyses, vulnerable animals spent less time in the side-compartments compared to both control (p < 0.01) and resilient (p < 0.05) groups, but all three groups preferred the social chamber (p < 0.05 for all; data not shown). The time spent with the conspecific-empty holder showed a significant effect of group (F(2,21) = 3.906, p < 0.05), choice (F(1,21) = 47.046, p < 0.01), and group choice interaction (F(1,21) = 3.775, p < 0.05). Post-hoc analysis showed that both control (p < 0.01) and resilient (p < 0.01) group preferred the stimulus animal, but not the vulnerable groups. Moreover, the vulnerable animals spent less time with the conspecific compared to both control (p < 0.01) and resilient (p < 0.01) groups (data not shown). This was reflected by the significant differences in SI compared to random chance (50%) for the control (t(6) = 15.590, p < 0.01) and resilient (t(8) = 3.196, p = 0.01) groups, but not for the vulnerable group. However, there was no difference between the SI of the groups in direct comparison ().
During the third 10 min of the sociability test (social discrimination), there was no difference between control and traumatized animals: they spent an equal amount of time in the center (, third, striped column of each color) and none of them differentiated between the compartments containing the new or the old stimulus animals. Accordingly, the DI of the groups did not differ significantly from random chance (50%) or from each other (data not shown).
Similarly, there was no difference between the time spent in center (), in the compartments and with the animals for the resilient-vulnerable groups. Accordingly, DI did not differ significantly from random chance (50%) and there were no differences between the groups, either (data not shown).
Contextual fear
One month after trauma, there was a significant difference between control and traumatized animals during a contextual reminder: traumatized animals spent more time freezing (t(55) = −4.945, p < 0.01) (Supplementary Figure 2(A)), in accordance with our expectations. The number of feces boli in the box used previously for traumatizing the rat was also significantly higher in this group (t(57) = –3.248, p < 0.01) (Supplementary Figure 2(B)). When comparing the time spent freezing in minute-bins (), there was a significant effect of treatment (F(1,55) = 24.803, p < 0.01) and time treatment interaction (F(14,770) = 2.919, p < 0.01). Post-hoc analysis of the interaction showed that traumatized animals spent more time freezing at every time point (p < 0.01 for all). Moreover, while the behavior of the control group did not change throughout the 15 min, there was an increase in the 2–6th minutes compared to the first one, then a decrease from the 7th minute compared to the first 6 min in traumatized rats (p < 0.01 for all). On the second day, the difference in the time spent freezing still existed (t(55) = −4.546, p < 0.01) (Supplementary Figure 2(A)).
When analyzing the resilient-vulnerable groups separately, during the 15 min extinction period there was a significant effect of group on the time spent freezing (F(2,26) = 108.358, p < 0.01). Post hoc test revealed that the vulnerable animals froze more compared to control and resilient groups (p < 0.01 for both) (Supplementary Figure 2(A)). A significant effect of group was detected on the number of feces (F(2,27) = 9.552, p < 0.01). According to the post-hoc analysis, the resilient group defecated more compared to the control group (p < 0.05), while vulnerable group defecated more compared to both control (p < 0.01) and resilient (p = 0.05) groups (Supplementary Figure 2(B)). The minute-bin analysis showed a significant effect of group (F(2,26) = 103.103, p < 0.01), time (F(14,364) = 2.773, p < 0.01), and time group interaction (F(28,364) = 3.294, p < 0.01) (). According to the post-hoc analysis, the time spent freezing decreased for the resilient group from the 8th minute (p < 0.01 for all). Additionally, until the 7th minute, these values were significantly higher compared to values in the control group (p < 0.05 for all). On the other hand, the vulnerable group showed more freezing compared to the first minute and to both control and resilient groups throughout the observation period (p < 0.01 for all). On the second day, the significant difference between the groups still existed (F(2,26) = 21.467, p < 0.01). Post-hoc analysis showed that the resilient group spent more time freezing compared to the control group (p < 0.01), while the vulnerable group spent more time freezing compared to both control (p < 0.01) and resilient (p < 0.01) groups (Supplementary Figure 2(A)).
Glycome profile
Blood-plasma samples
A representative profile is presented in Supplementary Figure 1(A,B).
GLM analysis of the plasma N-glycan derived traits (Supplementary Table 1) showed a significant time trait interaction (F(6,156) = 52.262, p < 0.01) and a time
trait
group interaction (F(12,156) = 4.439, p < 0.01) (and an effect of trait). Post-hoc analysis of time
trait
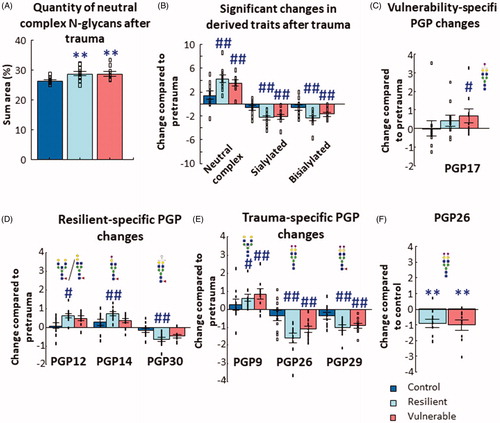
group interaction revealed that before trauma the three groups did not differ from each other. Moreover, the values of the derived traits in the control group did not differ after 1 month (effect of time). However, post-trauma the abundance of neutral complex N-glycans (PGP1 +PGP2 +PGP4 +PGP5 +PGP7 +PGP8 +PGP9 +PGP10 +PGP11 +PGP12 +PGP15) increased in both resilient and vulnerable groups (p < 0.01 for both) compared to control () and respective pretrauma levels. Additionally, in comparison to pretrauma levels, the concentration of sialylated (PGP13 +PGP14 +PGP16 +PGP17 +PGP19 +PGP20 +PGP21 +PGP23 +PGP26 +PGP29 +PGP30) and bisialylated (PGP23 +PGP26 +PGP29) N-glycans decreased in these groups (p < 0.05 for all) ().
Figure 2. Results of blood-plasma N-glycan analysis. (A) The abundance of neutral complex N-glycans increased after trauma in both resilient and vulnerable groups compared to control animals. (B) Three groups of derived traits changed compared to their respective pretrauma abundances in the resilient and vulnerable, but not in the control groups. (C) One PGP changed after trauma specifically in the vulnerable group, while three other (D) were altered only in the resilient group. (E) Three PGPs changed similarly in a trauma specific manner (that is, similarly in both resilient and vulnerable groups). Individual data on (B, C, D, and E) are expressed as changes compared to their respective tail samples. (F) PGP26 showed a significant decrease compared to the control group after shock (individual data are expressed as change compared to the average of the control trunk/posttrauma samples). Note the different scales on the y-axes of the figures. All analysis was done with GLM and Bonferroni correction. Data are expressed as average SEM. Empty squares represent individual values. PGP: glycan peak in the blood–plasma. #p < 0.05, ##p < 0.01 versus pretrauma; **p < 0.01 versus control.
GLM analysis of the individual PGPs in plasma samples (Supplementary Figure 3) revealed a significant effect of group (F(2,26) = 5.147, p < 0.05), a time peak interaction (F(38,988) = 18.977, p < 0.01), and a time
PGP
group interaction (F(38,988) = 2.048, p < 0.01). Post-hoc analysis of time
PGP
group interaction revealed numerous significant results.,
There were no differences between tail (pertrauma) and trunk (posttrauma) plasma samples collected 1 month apart (effect of time) in control group, but the abundance of multiple PGPs changed with time/trauma in the resilient and vulnerable groups. In the vulnerable group, PGP17 (p < 0.05) increased (). In the resilient group, PGP12 (p < 0.05) and PGP14 (p < 0.01) increased, while PGP30 (p < 0.01) decreased over time (). In traumatized groups (both in vulnerable and resilient), PGP9 increased (resilient: p < 0.05; vulnerable: p < 0.01), while PGP26 (p < 0.01 for both) and PGP29 (p < 0.01 for both) decreased in the resilient and vulnerable groups compared to their respective pretrauma (e.g. tail) samples ().
No significant differences were found between groups in the baseline, pretrauma plasma N-glycome profile. However, there was a significant difference between traumatized and control animals in PGP26 1 month after trauma: the abundance of PGP26 in both the resilient and vulnerable (p < 0.01 for both) groups was lower compared to the control group ().
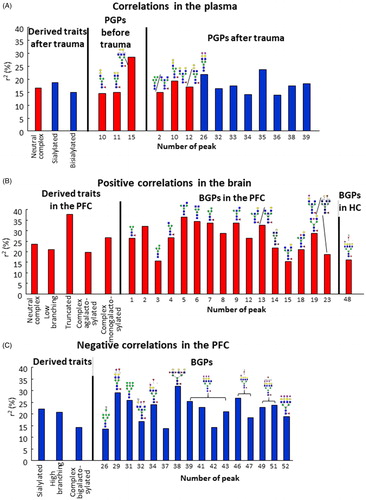
Several derived traits and individual PGPs correlated significantly with the z-scores (p < 0.05 for all) (Supplementary Table 3). In general, in post-trauma plasma samples higher levels of neutral complex N-glycans correlated with vulnerability to trauma while a greater abundance of sialylated and bisialylated (complex) N-glycans correlated with resilience (p < 0.05 for all) (Supplementary Figure 4(A–C)). At the level of individual PGPs, increased abundance of PGP10, PGP11 and PGP15 pretrauma correlated with vulnerability (Supplementary Figure 5(A–C)), which in the case of PGP10 also remained significant after trauma (Supplementary Figure 5(E)). After trauma, higher levels of PGP2 and PGP12 correlated with vulnerability, while PGP26, PGP32, PGP33, PGP34, PGP35, PGP36, PGP38, and PGP39 correlated with resilience (Supplementary Figure 5(D–N)) (see the respective equations, r-, r2-, and p-values on the figures, under the graphs). PGP15 before trauma (r2 = 0.286), PGP26 after trauma (r2 = 0.2198), and PGP35 after trauma (r2 = 0.2380) showed the strongest correlations ().
Figure 3. Coefficients of determination (r2) of all significant correlations. R2 values of (A) blood-plasma and (B: positive, C: negative) brain samples representing correlations between z-score and N-glycan levels. R2 values were multiplied by 100 to result in percentage (%) values. Red columns represent positive, while blue columns negative correlations. For peaks without structures we did not have enough knowledge to adequately propose one. PFC: prefrontal cortex; HC: hippocampus; PGP: glycan peak in the blood–plasma; BGP: glycan peak in the brain.
Brain samples
A representative N-glycome profile of a control animal can be found in Supplementary Figure 1(C–E).
GLM analysis of the derived traits (Supplementary Table 1) in the brain samples showed a significant trait group interaction (F(16,200) = 1.948, p < 0.05) and area
trait interaction (F(16,400) = 5.119, p < 0.01). Unfortunately, post-hoc analysis of trait
group interaction revealed no differences between the groups. However, post-hoc analysis of area
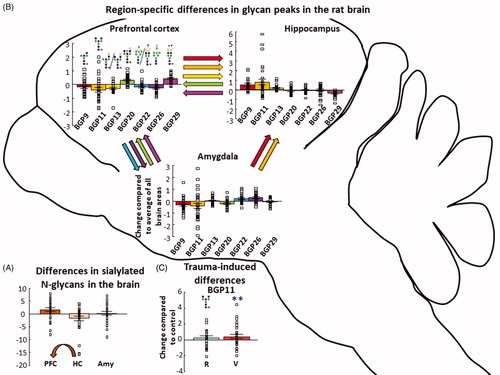
trait interaction revealed that the amount of sialylated N-glycans was increased in the PFC compared to the HC (p < 0.01) ().
Figure 4. N-glycan quantity differences between the three brain areas. (A) Seven BGPs were different between the three studied brain regions. The color of the arrow represents which BGP differed, while the direction points to the brain region having a greater abundance of that peak. BGPs are in consecutive order: BGP9; BGP11; BGP13; BGP20; BGP22; BGP26; BGP29. Individual data are expressed as change compared to the average of all brain areas. (B) In all brain region, BGP11 showed an increase in the vulnerable group compared to the control. (C) Sialylated N-glycans were more abundant in the PFC compared to the hippocampus. Individual data are expressed as change compared to the average of all brain areas. The arrow indicates significant difference between PFC and HC. Individual data are expressed as change compared to the average of all the control brain samples at the three brain regions. All analysis was done with GLM and Bonferroni correction. Data are expressed as average ± SEM. Empty squares represent individual values. Note the different scales on the y-axes of the figures. BGP: glycan peak in the brain; PFC: prefrontal cortex; HC: hippocampus; Amy: amygdala. **p < 0.01 versus control.
GLM analysis of the individual BGPs (Supplementary Figure 6) showed a significant effect of the brain region (F(2,50) = 3.051, p = 0.05), a brain region peak interaction (F(102,2550) = 7.844, p < 0.01) and a group
peak interaction (F(102,1275) = 1.490, p < 0.01).
Post-hoc analysis of the brain region BGP interaction reflects differences between the brain regions, regardless of the groups. BGP20 and BGP29 were more abundant in PFC samples compared to HC and Amy samples (p < 0.01 for all). In the case of the HC, BGP9 and BGP11 were more abundant compared to the other two brain regions (p < 0.01 for all), while BGP13 of the HC was only higher compared to the PFC samples (p < 0.01). BGP22 (p = 0.05) and BGP26 (p < 0.01) of the Amy samples were higher compared to the PFC (see all: ). Post-hoc analysis of group
peak interaction revealed that BGP11 (including all three brain regions) in the vulnerable group was higher compared to the corresponding control (p < 0.01) ().
Numerous glycan peaks showed significant correlations with the z-scores (Supplementary Table 4). In PFC neutral complex N-glycans, low branching, truncated, complex agalactosylated and complex monogalactosylated N-glycans correlated significantly with vulnerability, while sialylated, high branching and complex bigalactosylated N-glycans (specific BGPs are described in Supplementary Table 1) correlated with resilience ( and Supplementary Figure 4(D–K)). Truncated N-glycans (BGP23 +BGP26 +BGP29) showed the strongest correlation with z-score (r2 = 0.3805). The levels of 33 BGPs correlated with z-score in the PFC: 16 correlated with vulnerability (BGP1, BGP2, BGP3, BGP4, BGP5, BGP6, BGP7, BGP8, BGP9, BGP12, BGP13, BGP14, BGP15, BGP18, BGP19, and BGP23) (Supplementary Figure 7(A–P)), while another sixteen correlated with resilience (BGP26, BGP29, BGP31, BGP32, BGP34, BGP37, BGP38, BGP39, BGP41, BGP42, BGP43, BGP46, BGP48, BGP49, BGP51, and BGP52) (Supplementary Figure 8). BGP48 correlated positively with resilience in the HC (Supplementary Figure 7(Q)) (see the respective equations, r-, r2-, and p-values on the figures, under the graphs). The strongest correlations (0.300r2
0.400) were in the cases of PFC BGP2, BGP5, BGP6, BGP7, BGP9, BGP13, and BGP38 (). No correlations between N-glycan abundance and z-scores were found in the Amy samples.
T-SNE analysis
T-SNE analysis of pretrauma PGPs showed no separation between the groups (Supplementary Figure 9(A)). On the other hand, in the posttrauma blood samples, resilient and vulnerable groups were clearly separated from the control animals ().
Figure 5. T-SNE and ROC curve analyzis of N-glycan results. (A) N-glycan posttrauma blood samples separated based on the treatment. Traumatized animals (resilient and vulnerable samples) formed a separate cluster from the control group, indicating that trauma induces specific changes in the N-glycome of the blood. (B) In the samples of the PFC, vulnerable animals show a trend for separating from the intermixing control and resilient groups. This shows subtle changes in the N-glycolysation pattern in the PFC of the vulnerable animals. (C) Separation of brain samples from the control (untraumatized) group based on the examined brain areas. There was a clear PFC cluster compared to the intermixed HC and Amy samples, showing that PFC have a unique N-glycosylation pattern compared to the other two brain area. (D) Average relative area SEM of PGP15 in pretrauma blood samples. Red dashed line is the cutoff value for PGP15 area (i.e. >1.285%) which gives the best tradeoff between sensitivity and specificity. The proportion of PGP15 is expressed as a percentage of the total integrated area of the chromatogram. Empty squares represent individual values. (E) ROC curve analysis of PGP15(FA3G2). With the highest area under the ROC curve (0.8 with standard error of 0.102; 95% confidence interval: 0.599–1.000; p = 0.02), PGP15(FA3G2) was classified as a candidate biomarker in a rat model of PTSD with a “good” discriminative ability. Note the different scales on the y-axes of the figures. T-SNE: t-Distributed Stochastic Neighbor Embedding; PFC: prefrontal cortex; HC: hippocampus; Amy: amygdala; ROC: receiver operating characteristic; PGP: glycan peak in the blood-plasma; PTSD: posttraumatic stress disorder; C: control; R: resilient; V: vulnerable.
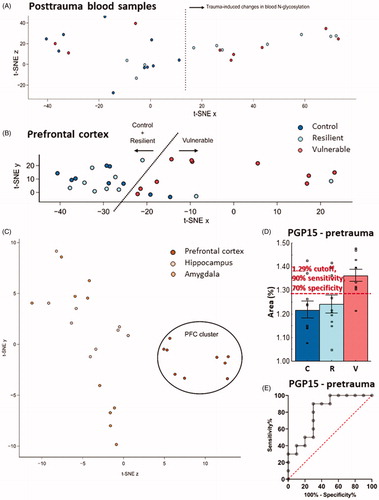
In the case of the different brain areas, we found that the samples from the PFC formed a clear cluster, away from the samples from the HC and Amy (). Moreover, when we analyzed the brain areas separately, detachment between control, resilient and vulnerable groups was detectable only in the PFC (), but not in the other two brain areas (Supplementary Figure 9(B,C)). In the PFC, the samples of vulnerable rats were separated from most of the control and resilient animals.
ROC analysis
Analyzing the possible utility of the three PGPs (PGP10, PGP11, and PGP15) as possible biomarkers we found that PGP15 had the highest area under ROC curve (0.8 with standard error of 0.102; 95% confidence interval: 0.599–1.000; p = 0.02), having a ‘good’ discriminative ability with rather high sensitivity and specificity (at 1.29% ROC cutoff the sensitivity was 90%, while the specificity 70%) ().
Discussion
In accordance with our previous results (Zelena et al., Citation2016), we were able to detect the development of PTSD-like symptoms in our rat model. Moreover, based on z-score analysis of different domains (anxiety, locomotor, and social domain) vulnerable animals were clearly separated from the resilient ones ().
Table 1. Summary of the main results
With respect to the N-glycan profile in rats, the following observations were made: (1) in control animals N-glycan content of blood-plasma taken from the tail was not significantly different from the values determined in the trunk plasma samples collected one month later, but in traumatized rats stress induced specific changes leading to a greater abundance of neutral complex N-glycans compared to both the controls and pretrauma levels (); (2) the abundance of one N-glycan peak, PGP26, containing the bisialylated structure A2G2S2, was specifically affected by traumatic stress and was reduced in the plasma of traumatized animals (both resilient and vulnerable) compared to both control and pretrauma levels (), while PGP17(A2G2S) level increased in vulnerable animals in comparison to pretrauma levels (); (3) three pretrauma PGPs correlated significantly with vulnerability to stress (PGP10(FA1G1Ga1), PGP11(FA2G2), and PGP15(FA3G2)), while after trauma this correlation was detected for eleven PGPs ( and Supplementary Table 3); (4) the three examined brain regions (PFC, HC, Amy) showed specific BGP alterations in seven glycan peaks (), primarily with regard to the proportion of sialylated N-glycans (); (5) in all three brain regions BGP11(FA2B) was more abundant in vulnerable rats compared to controls 1 month after trauma (); (6) in the brain, numerous BGP quantities and derived traits correlated with the severity of the PTSD-like behavior, mostly in the PFC ( and Supplementary Table 4).
There were no differences between the three groups (control, resilient, vulnerable) in platelet serotonin and plasma corticosterone concentrations.
Separation of resilient and vulnerable groups has great translational importance, since biomarkers for vulnerability could be used to detect high risk individuals and help them in avoiding trauma (e.g. suggesting non-traumatizing professions) or provide early interventions. There are several methods in the literature to dissect vulnerable and resilient rodent populations (Alexander et al., Citation2019), but most of them are based upon a single measured parameter e.g. freezing to odor, forced swim test, startle response (Rasmussen et al., Citation2008), or an array of behavioral elements, but taking them into consideration with similar importance (Le Dorze & Gisquet-Verrier, Citation2016). Because PTSD is a highly complex disorder showing diverse symptomatology, we combined these diverse symptoms into a single variable, the z-score, which is a parameter without any dimension, thus, additive within and between tests (Guilloux et al., Citation2011). As expected (Torok et al., Citation2019), higher freezing behavior and less social interest were detected in vulnerable groups compared to control and resilient rats. However, pretrauma elevated plus maze behavior, as a sign of innate anxiety, did not predict vulnerability to trauma. It is not surprising as brain circuitry regulating innate and learned fear are only partially overlapping (Çalışkan & Stork, Citation2019).
In control animals, plasma N-glycan profile was highly stable as we could not detect any differences between the two samples taken one month apart even though the method of sampling was different. It is coherent with a previous human study on five healthy individuals showing high stability during a prolonged period (years), which makes intraindividual comparison and long-term follow-ups of a disease development possible (Kosinski, Citation1981).
Although in pretrauma plasma samples we could not detect significant differences among control, vulnerable, and resilient groups, the quantity of three peaks containing core fucosylated bigalactosylated neutral N-glycans (PGP10(FA1G1Ga1), PGP11(FA2G2), and PGP15(FA3G2)) positively correlated with the severity of PTSD-like behavior exhibited later (, Supplementary Figure 5(A–C), and Supplementary Table 3). Based on ROC curve analysis (), PGP15 was the best predictors of vulnerability. Moreover, it showed a relatively strong (r2 = 0.286) correlation as well. Therefore, we propose that its abundance in plasma might predict vulnerability, and that it can be a candidate for further research.
As alternative stress-related biomarkers, we examined platelet serotonin and plasma corticosterone concentrations. Despite previous suggestions (see Introduction) in traumatized rats, we were not able to dissect any vulnerability-related changes in these parameters. There are no data on platelet serotonin concentration in rodents models, while serotonin content was mostly unaffected in PFC and Amy and decreased in HC in another animal model of PTSD (Lisieski et al., Citation2018). Furthermore, platelet serotonin concentration did not differ between veterans with PTSD and veterans without PTSD (Pivac et al., Citation2002), and was not associated with severity of PTSD (Kovacic Petrovic et al., Citation2016; Pivac et al., Citation2002). Plasma corticosterone were also unaltered both in rodent models (Lisieski et al., Citation2018) and human subjects (Speer et al., Citation2019).
Trauma-induced biochemical changes might be a target for intervention. We found that trauma causes significant changes in the plasma N-glycome that are detectable 1 month after the event. Some PGPs were similarly altered in both the vulnerable and resilient groups, which is not surprising as resilient animals also showed some behavioral consequences of trauma (see significant difference in z-score from controls). In general, exposure to a traumatic event resulted in a decrease in the relative abundance of sialylated (mainly bisialylated) N-glycans and a corresponding increase in the abundance of neutral complex N-glycans ( and ), which was seen both at the level of derived traits and individual PGPs. Regarding the latter, the abundance of PGP9(A2BG2) was increased, while the abundance of PGP26(A2G2S2) and PGP29(FA2G2S2) was decreased in both groups after trauma (). Nevertheless, there were also changes that were specific to each of the traumatized subgroups: in the vulnerable group, PGP17(A2G2S) was more abundant, whereas in the resilient group PGP12(FA2GGa) and PGP14(FA2GS) were more, while PGP30(FA2G2Sg) was less abundant (). These data suggest that traumatic stress induces a shift in the plasma N-glycoprofile from sialylated N-glycans toward simpler neutral structures. Furthermore, stress differentially affects specific plasma N-glycans in vulnerable and resilient animals, which points to possible differences in their N-glycan biosynthesis. This was further confirmed by the t-SNE analysis ( and Supplementary Figure 9(A)). However, since the resilient and vulnerable groups did not separate clearly from each other, it suggests that the changes are subtle and sensitive measurements are needed to detect them.
To the best of our knowledge, this is the first study to examine the correlation of resilience and vulnerability to trauma and N-glycan status in an animal model of PTSD. It is possible that the animal model reflects only a subset of behavioral changes that occur in individuals with PTSD. We might also assume that most of the human findings could be associated with comorbid disorders such as depression, alcohol abuse or other pathological conditions that commonly coincide with PTSD (e.g. inflammation). Indeed, in our previous human study N-glycome alterations were similar to those that are changed in inflammatory diseases, schizophrenia or depression (Tudor et al., Citation2019). However, this type of comorbidity did not develop in our animal model during the 1 month observation period. In line with thymus enlargement of vulnerable individuals suggesting some immunological disturbances (Archana & Namasivayam, Citation2000), our vulnerable rats had enlarged thymus compared to control and resilient rats. Indeed, inflammation, a possible contributor to PTSD development (Kim et al., Citation2020), might induce alterations in the plasma glycosylation profile (Reiding et al., Citation2017). One of the difficulties with using animal models to learn more about human glycobiology is that the composition of the human plasma N-glycome is radically different from that of rodents indicating a vast divergence in the way N-glycans are synthesized across species. This is largely due to the presence of N-glycolylneuraminic acid (Neu5Gc) and other epitopes that do not appear in the human plasma N-glycome, such as O-acetylated sialic acid, branching sialic acids, and the alpha galactose anomer (Gao et al., Citation2015; Reiding et al., Citation2016; Thall & Galili, Citation1990; Yoshida et al., Citation2016). In addition, the relative distribution of various N-glycan classes, particularly the neutral complex and hybrids types, differs considerably between species (Gao et al., Citation2015; Yoshida et al., Citation2016).
The present animal study was based on our previous human study (Tudor et al., Citation2019), which reported specific differences between patients with PTSD (determined long after trauma exposure) and control subjects in plasma N-glycans. In that study, four plasma N-glycans were significantly higher (A2G2S1, A3G3S3, A4G4S3, and A4F1G4S4), while two PGPs (FA2G2S1, M9) were significantly lower in PTSD subjects compared to controls. Another article examining 40 traumatized professional soldiers found a positive correlation between stress intensity and the highly-sialyated glycoprotein (stressin) plasma concentration (Lauc et al., Citation1998). Comparing these results with the present study, the general posttrauma trend of reduced sialylation in favor of neutral N-glycans that was observed in rats did not mirror the changes seen in human studies, where many of the upregulated N-glycans were highly sialylated. This may signify that there are fundamental differences in the way stress impacts the plasma N-glycome globally in rats and humans. However, it is interesting to note that the only significant change that was unique to the vulnerable group, an increase in the abundance of GP17(A2G2S1) (), matches the increase observed for the same N-glycan in human PTSD patients (Tudor et al., Citation2019) and, thus, provides evidence that the rat model replicates at least some aspects of the human condition. Thus, we propose that this N-glycan, A2G2S1 (in human: GP14), deserves further attention and may represent a common point of overlap between the two species that could be exploited in the animal model to investigate some aspects of the human disorder.
The N-glycoprofiles of the three brain regions showed specific inter-region differences in the abundance of various N-glycans under baseline conditions (i.e. control animals) (). On a t-SNE plot, PFC samples formed a cluster distinct from the other regions () indicating that on a global level the PFC N-glycoprofile differs from that of the limbic structures which were more similar to each other. At the level of individual peaks, in total, the abundance of seven BGPs varied significantly across the three brain regions. Notably, the PFC was found to have a greater abundance of sialylated N-glycans compared to the hippocampus () in large part due to an increased abundance of BGP29(FA2FG2S1).
Despite being more complex and containing many more BGPs than the PGPs, far fewer trauma-related changes were seen in the brain N-glycome, which may indicate that it is more stable than that of the plasma or generally more resistant to changes elicited by external psychological stimuli. Nevertheless, BGP11 (FA2B) was significantly more abundant in the vulnerable group compared to the control group () providing evidence that traumatic stress can lead to enduring changes in brain glycosylation in susceptible, but not resilient animals. Furthermore, this increased abundance was observed in all three regions examined indicating that this may be a widespread effect in the brain. In addition, numerous derived traits and 33 BGPs (Supplementary Table 4) were correlated with z-score. Of these, only one BGP showed a significant correlation in the HC, all the remaining correlations occurred in the PFC. Moreover, the t-SNE analysis of PFC, but not HC or Amy samples, showed divergence of vulnerable animals from control and resilient ones at a global level (). These results suggest that PFC is a key region of trauma-induced changes in brain glycosylation that could potentially modulate behavioral phenotypes in response to stress.
Strikingly, the trend seen in the brain N-glycome was very similar to the one observed in the plasma. Interestingly, higher levels of rudimentary mono- and bi-antennary neutral complex N-glycans having either one or no galactose (Gal) residues were correlated with a vulnerable behavior phenotype (i.e. a higher z-score). This group of N-glycans was also generally adorned with core fucose and bisecting N-acetylglucosamine (GlcNAc). Among them truncated N-glycans (BGP4(FA1), BGP5(A1B), BGP9(FA1B), and BGP13(FM4A1B)) showed the strongest correlation. In contrast, the N-glycans correlating with resilient behavior were of the high-branching and/or sialylated complex type and invariably exhibited core fucose. We hypothesize, therefore, that a shift in the biosynthesis of N-glycans, especially in PFC, from large, multi-antennary, and sialylated structures to more rudimentary neutral complex types is an underlying biochemical factor in the manifestation of vulnerability to stress. This consistent trauma-induced shift in N-glycosylation from large, elaborate N-glycans to more rudimentary structures may indicate that this is a general effect of stress that affects N-glycosylation globally across the whole organism.
The design of this study has some limitations that should be taken into consideration. (1) The small sample size (n = 10/group) makes hard to detect minor differences between groups. However, laboratory animals are rather homogenous and even in case of such highly variable parameter as behavior, normally n = 8–10 animals/group are enough to detect changes. Moreover, previous studies found lower interindividual variability in mice than in humans (Yoshida et al., Citation2016). (2) It is possible that more extensive changes in N-glycosylation are happening, but at a different time point or in different brain regions that were not examined in this study. However, both the results of the N-glycan analyses in the two plasma samples and three brain regions were highly similar suggesting a stable glycome profile through time (first and second blood sampling were taken 1 month apart) and within the whole brain. (3) The change in N-glycome pattern could also depend on the type of trauma and although electric footshock induces behavioral changes in all clusters of PTSD (Torok et al., Citation2019), this might not correspond closely to PTSD. (4) The N-glycan structures assigned to the chromatographic peaks are proposed structures assigned primarily based on their GU values and therefore must be validated by orthogonal methods, such as mass spectrometry, in subsequent studies. (5) While we have only investigated quantitative changes in N-glycan abundance using UPLC, it is possible that additional qualitative changes are also occurring in the plasma or brain N-glycome as a result of trauma.
Conclusion
In rats N-glycans are rather stabile during time, while there are specific BGP differences between brain regions. PFC is a key region of trauma-induced changes in brain glycosylation. We identified three N-glycan peaks in the pretrauma plasma containing neutral N-glycans (PGP10(FA1G1Ga1), PGP11(FA2G2), and PGP15(FA3G2)), that correlated with vulnerability to stress and therefore might be a suitable biomarker that warrants further investigation. In particular, PGP15 deserves special attention. Trauma induced a shift in N-glycosylation from large, elaborate N-glycans to more rudimentary structures in the plasma of traumatized animals and also specifically in the PFC of vulnerable animals. In rats exposed to traumatic stress, PGP17(A2G2S1) and BGP11(FA2B) N-glycan changes were strongly associated with vulnerability. The PGP17(A2G2S1) changes were similar to human findings.
Revision_Suppl._Table_4_20200519.docx
Download MS Word (19.4 KB)Revision_Suppl._Table_3_20200519.docx
Download MS Word (14.9 KB)Revision_Suppl._Table_2_20200519.docx
Download MS Word (20.8 KB)Revision_Suppl._Table_1_20200519.docx
Download MS Word (14.1 KB)Suppl.Fig.9.TIF
Download TIFF Image (83 KB)Suppl._Fig.8.TIF
Download TIFF Image (191.3 KB)Suppl._Fig.7.TIF
Download TIFF Image (181.1 KB)Suppl._Fig.6.TIF
Download TIFF Image (99.8 KB)Suppl._Fig.5.TIF
Download TIFF Image (159.5 KB)Suppl._Fig.4.TIF
Download TIFF Image (114.8 KB)Suppl._Fig.3.TIF
Download TIFF Image (102.1 KB)Suppl._Fig.2.TIF
Download TIFF Image (61.8 KB)Suppl._Fig.1.TIF
Download TIFF Image (343.1 KB)Disclosure statement
The authors declare that there are no conflicts of interest in the conduct and reporting of research.
Additional information
Funding
References
- Acs, Z., Antoni, F.A., & Makara, G.B. (1982). Corticoliberin and somatoliberin activity in the pituitary stalk median eminence of rats after neonatal treatment with monosodium glutamate. The Journal of Endocrinology, 93(2), 239–245. https://doi.org/10.1677/joe.0.0930239
- Akmacic, I.T., Ugrina, I., Stambuk, J., Gudelj, I., Vuckovic, F., Lauc, G., & Pucic-Bakovic, M. (2015). High-throughput glycomics: Optimization of sample preparation. Biochemistry. Biokhimiia, 80(7), 934–942. https://doi.org/10.1134/S0006297915070123
- Albach, C., Klein, R.A., & Schmitz, B. (2001). Do rodent and human brains have different N-glycosylation patterns? Biological Chemistry, 382(2), 187–194. https://doi.org/10.1515/BC.2001.026
- Alexander, K.S., Nalloor, R., Bunting, K.M., & Vazdarjanova, A. (2019). Investigating individual pre-trauma susceptibility to a PTSD-like phenotype in animals. Frontiers in Systems Neuroscience, 13, 85. https://doi.org/10.3389/fnsys.2019.00085
- Aliczki, M., Barna, I., Till, I., Baranyi, M., Sperlagh, B., Goldberg, S.R., & Haller, J. (2016). The effects anandamide signaling in the prelimbic cortex and basolateral amygdala on coping with environmental stimuli in rats. Psychopharmacology, 233(10), 1889–1899. https://doi.org/10.1007/s00213-016-4219-8
- Archana, R., & Namasivayam, A. (2000). Acute noise-induced alterations in the immune status of albino rats. Indian Journal of Physiology and Pharmacology, 44(1), 105–108.
- Balazsfi, D., Fodor, A., Torok, B., Ferenczi, S., Kovacs, K.J., Haller, J., & Zelena, D. (2018). Enhanced innate fear and altered stress axis regulation in VGluT3 knockout mice. Stress (Amsterdam, Netherlands), 21(2), 151–161. https://doi.org/10.1080/10253890.2017.1423053
- Baldi, E., & Bucherelli, C. (2015). Brain sites involved in fear memory reconsolidation and extinction of rodents. Neuroscience and Biobehavioral Reviews, 53, 160–190. https://doi.org/10.1016/j.neubiorev.2015.04.003
- Barone, R., Sturiale, L., Palmigiano, A., Zappia, M., & Garozzo, D. (2012). Glycomics of pediatric and adulthood diseases of the central nervous system. Journal of Proteomics, 75(17), 5123–5139. https://doi.org/10.1016/j.jprot.2012.07.007
- Çalışkan, G., & Stork, O. (2019). Hippocampal network oscillations at the interplay between innate anxiety and learned fear. Psychopharmacology, 236(1), 321–338. https://doi.org/10.1007/s00213-018-5109-z
- Ceroni, A., Maass, K., Geyer, H., Geyer, R., Dell, A., & Haslam, S.M. (2008). GlycoWorkbench: A tool for the computer-assisted annotation of mass spectra of glycans. Journal of Proteome Research, 7(4), 1650–1659. https://doi.org/10.1021/pr7008252
- Chen, Y.J., Wing, D.R., Guile, G.R., Dwek, R.A., Harvey, D.J., & Zamze, S. (1998). Neutral N-glycans in adult rat brain tissue-complete characterisation reveals fucosylated hybrid and complex structures. European Journal of Biochemistry, 251(3), 691–703. https://doi.org/10.1046/j.1432-1327.1998.2510691.x
- Gao, W.N., Yau, L.F., Liu, L., Zeng, X., Chen, D.C., Jiang, M., Liu, J., Wang J.R., & Jiang, Z.H. (2015). Microfluidic chip-LC/MS-based glycomic analysis revealed distinct N-glycan profile of rat serum. Scientific Reports, 5, 12844. https://doi.org/10.1038/srep12844
- Gökçek-Saraç, Ç., Wesierska, M., & Jakubowska-Doğru, E. (2015). Comparison of spatial learning in the partially baited radial-arm maze task between commonly used rat strains: Wistar, Spargue-Dawley, Long-Evans, and outcrossed Wistar/Sprague-Dawley. Learning & Behavior, 43(1), 83–94. https://doi.org/10.3758/s13420-014-0163-9
- Guile, G.R., Rudd, P.M., Wing, D.R., Prime, S.B., & Dwek, R.A. (1996). A rapid high-resolution high-performance liquid chromatographic method for separating glycan mixtures and analyzing oligosaccharide profiles. Analytical Biochemistry, 240(2), 210–226. https://doi.org/10.1006/abio.1996.0351
- Guilloux, J.P., Seney, M., Edgar, N., & Sibille, E. (2011). Integrated behavioral z-scoring increases the sensitivity and reliability of behavioral phenotyping in mice: Relevance to emotionality and sex. The Journal of Neuroscience Methods, 197(1), 21–31. https://doi.org/10.1016/j.jneumeth.2011.01.019
- Hirata, I., Yasumoto, S., Toshina, K., Inoue, T., Nishikawa, T., Murano, N., Murano, M., Wang, FY., & Katsu, K. (2007). Evaluation of the effect of pyrrolidine dithiocarbamate in suppressing inflammation in mice with dextran sodium sulfate-induced colitis. World Journal of Gastroenterology, 13(11), 1666–1671. https://doi.org/10.3748/wjg.v13.i11.1666
- Keser, T., Gornik, I., Vuckovic, F., Selak, N., Pavic, T., Lukic, E., Gudelj, I., Gasparovic, H., Biocina, B., Tilin, T., Wennerstrom, A., Mannisto, S., Salomaa, V., Havulinna, A., Wang, W., Wilson JF., Chaturvedi, N., Perola, M., Campbell, H., Chaturvedi, N., Perola, M., Campbell, H., Lauc, G., & Gornik, O. (2017). Increased plasma N-glycome complexity is associated with higher risk of type 2 diabetes. Diabetologia, 60(12), 2352–2360. https://doi.org/10.1007/s00125-017-4426-9
- Kilpatrick, D.G., Resnick, H.S., Milanak, M.E., Miller, M.W., Keyes, K.M., & Friedman, M.J. (2013). National estimates of exposure to traumatic events and PTSD prevalence using DSM-IV and DSM-5 criteria. Journal of Traumatic Stress, 26(5), 537–547. https://doi.org/10.1002/jts.21848
- Kim, T.D., Lee, S., & Yoon, S. (2020). Inflammation in Post-Traumatic Stress Disorder (PTSD): A review of potential correlates of PTSD with a neurological perspective. Antioxidants ( Antioxidants), 9(2), 107. https://doi.org/10.3390/antiox9020107
- Klaric, T., & Gudelj, I. (2017). HILIC-UPLC analysis of brain tissue N-glycans. Methods in Molecular Biology (Clifton, N.J.), 1503, 207–216. https://doi.org/10.1007/978-1-4939-6493-2_16
- Konjevod, M., Tudor, L., Svob Strac, D., Nedic Erjavec, G., Barbas, C., Zarkovic, N., Nikolac Perkovic, M. ,Uzun, S. ,Kozumplik, O., Lauc, G., & Pivac, N. (2019). Metabolomic and glycomic findings in posttraumatic stress disorder. Progress in Neuro-Psychopharmacology & Biological Psychiatry, 88, 181–193. https://doi.org/10.1016/j.pnpbp.2018.07.014
- Kosinski, S. (1981). Participation of the immunological system cells in the graft vs host reaction. (Postepy Hig Med Dosw) Postepy Higieny I Medycyny Doswiadczalnej, 35, 101–112.
- Kovacic Petrovic, Z., Nedic Erjavec, G., Nikolac Perkovic, M., Peraica, T., & Pivac, N. (2016). No association between the serotonin transporter linked polymorphic region polymorphism and severity of posttraumatic stress disorder symptoms in combat veterans with or without comorbid depression. Psychiatry Research, 244, 376–381. https://doi.org/10.1016/j.psychres.2016.08.017
- Kovacic Petrovic, Z., Nedic Erjavec, G., Nikolac Perkovic, M., Svob Strac, D., Peraica, T., Tudor, L., & Pivac, N. (2019). The association between serotonin transporter polymorphism, platelet serotonin concentration and insomnia in non-depressed veterans with posttraumatic stress disorder. Psychiatria Danubina, 31(1), 78–87. https://doi.org/10.24869/psyd.2019.78
- Lauc, G., Dabelic, D.J., & Flogel, M. (1998). Stressin and natural killer cell activity in professional soldiers. Annals of the New York Academy of Sciences, 851, 526–530. https://doi.org/10.1111/j.1749-6632.1998.tb09031.x
- Lauc, G., Essafi, A., Huffman, J.E., Hayward, C., Knezevic, A., Kattla, J.J., Polasek, O., Gornik, O., Vitart, V., Abrahams, JL., Pucic, M. ,Novokmet, M., Redzic, I., Campbell, S., Wild, SH., Borovecki, F. ,Wang, W., Kolcic, I., Zgaga, L., … Rudan, I. (2010). Genomics meets glycomics-the first GWAS study of human N-Glycome identifies HNF1α as a master regulator of plasma protein fucosylation. PLoS Genetics, 6(12), e1001256. https://doi.org/10.1371/journal.pgen.1001256
- Lauc, G., Pezer, M., Rudan, I., & Campbell, H. (2016). Mechanisms of disease: The human N-glycome. Biochimica et Biophysica Acta, 1860(8), 1574–1582. https://doi.org/10.1016/j.bbagen.2015.10.016
- Le Dorze, C., & Gisquet-Verrier, P. (2016). Effects of multiple brief exposures to trauma-associated cues on traumatized resilient and vulnerable rats. Brain Research, 1652, 71–80. https://doi.org/10.1016/j.brainres.2016.10.002
- Lisieski, M.J., Eagle, A.L., Conti, A.C., Liberzon, I., & Perrine, S.A. (2018). Single-prolonged stress: A review of two decades of progress in a rodent model of post-traumatic stress disorder. Frontiers in Psychiatry, 9, 196. https://doi.org/10.3389/fpsyt.2018.00196
- Lowry, O.H., Rosebrough, N.J., Farr, A.L., & Randall, R.J. (1951). Protein measurement with the Folin phenol reagent. The Journal of Biological Chemistry, 193(1), 265–275.
- Machisa, M.T., Christofides, N., & Jewkes, R. (2018). Social support factors associated with psychological resilience among women survivors of intimate partner violence in Gauteng, South Africa. Global Health Action, 11 (Suppl 3), 1491114. https://doi.org/10.1080/16549716.2018.1491114
- Moreno-Villanueva, M., Morath, J., Vanhooren, V., Elbert, T., Kolassa, S., Libert, C., Burkle, A., & Kolassa, I.T. (2013). N-glycosylation profiling of plasma provides evidence for accelerated physiological aging in post-traumatic stress disorder. Translational Psychiatry, 3, e320. https://doi.org/10.1038/tp.2013.93
- Nairn, A.V., Aoki, K., Dela Rosa, M., Porterfield, M., Lim, J.M., Kulik, M., Pierce, J.M., Wells, L. ,Dalton, S. ,Tiemeyer, M., & Moremen, K.W. (2012). Regulation of glycan structures in murine embryonic stem cells: Combined transcript profiling of glycan-related genes and glycan structural analysis. The Journal of Biological Chemistry, 287(45), 37835–37856. https://doi.org/10.1074/jbc.M112.405233
- Ohtsubo, K., & Marth, J.D. (2006). Glycosylation in cellular mechanisms of health and disease. Cell, 126(5), 855–867. https://doi.org/10.1016/j.cell.2006.08.019
- Pivac, N., Knežević, A., Gornik, O., Pučić, M., Igl, W., Peeters, H., Crepel, A., Steyaert, J., Novokmet, M., Redzic, I, Nikolac, M, Hercigonja, V.N., Curkovic, K.D., Curkovic, M., Nedic, G., Muck-Seler, D., Borovecki, F., Rudan, I., & Lauc, G. (2011). Human plasma glycome in attention-deficit hyperactivity disorder and autism spectrum disorders. Molecular & Cellular Proteomics, 10(1), M110 004200. https://doi.org/10.1074/mcp.M110.004200
- Pivac, N., Muck-Seler, D., Mustapic, M., Nenadic-Sviglin, K., & Kozaric-Kovacic, D. (2004). Platelet serotonin concentration in alcoholic subjects. Life Sciences, 76(5), 521–531. https://doi.org/10.1016/j.lfs.2004.06.024
- Pivac, N., Muck-Seler, D., Sagud, M., & Jakovljevic, M. (2002). Platelet serotonergic markers in posttraumatic stress disorder. Progress in Neuro-Psychopharmacology & Biological Psychiatry, 26(6), 1193–1198. https://doi.org/10.1016/s0278-5846(02)00261-0
- Priebe, S., Bogic, M., Ajdukovic, D., Franciskovic, T., Galeazzi, G.M., Kucukalic, A., Wang, D., & Schützwohl, M. (2010). Mental disorders following war in the Balkans: A study in 5 countries. Archives of General Psychiatry, 67(5), 518–528. https://doi.org/10.1001/archgenpsychiatry.2010.37
- Rasmussen, D.D., Crites, N.J., & Burke, B.L. (2008). Acoustic startle amplitude predicts vulnerability to develop post-traumatic stress hyper-responsivity and associated plasma corticosterone changes in rats. Psychoneuroendocrinology, 33(3), 282–291. https://doi.org/10.1016/j.psyneuen.2007.11.010
- Reiding, K.R., Hipgrave Ederveen, A.L., Rombouts, Y., & Wuhrer, M. (2016). Murine plasma N-glycosylation traits associated with sex and strain. Journal of Proteome Research, 15(10), 3489–3499. https://doi.org/10.1021/acs.jproteome.6b00071
- Reiding, K.R., Ruhaak, L.R., Uh, H.W., El Bouhaddani, S., van den Akker, E.B., Plomp, R., McDonnell, L.A., Houwing-Duistermaat, J.J. ,Slagboom, P.E. ,Beekman, M., & Wuhrer, M. (2017). Human plasma N-glycosylation as analyzed by matrix-assisted laser desorption/ionization-Fourier transform ion cyclotron resonance-MS associates with markers of inflammation and metabolic health. Molecular & Cellular Proteomics: Mcp, 16(2), 228–242. https://doi.org/10.1074/mcp.M116.065250
- Selman, M.H., Hemayatkar, M., Deelder, A.M., & Wuhrer, M. (2011). Cotton HILIC SPE microtips for microscale purification and enrichment of glycans and glycopeptides. Analytical Chemistry, 83(7), 2492–2499. https://doi.org/10.1021/ac1027116
- Shalev, A., Liberzon, I., & Marmar, C. (2017). Post-traumatic stress disorder. The New England Journal of Medicine, 376(25), 2459–2469. https://doi.org/10.1056/NEJMra1612499
- Shi, M., Hwang, H., & Zhang, J. (2013). Quantitative characterization of glycoproteins in neurodegenerative disorders using iTRAQ. Methods in Molecular Biology (Clifton, N.J.), 951, 279–296. https://doi.org/10.1007/978-1-62703-146-2_19
- Speer, K.E., Semple, S., Naumovski, N., D'Cunha, N.M., & McKune, A.J. (2019). HPA axis function and diurnal cortisol in post-traumatic stress disorder: A systematic review. Neurobiology of Stress, 11, 100180. https://doi.org/10.1016/j.ynstr.2019.100180
- Thall, A., & Galili, U. (1990). Distribution of Gal alpha 1–3Gal beta 1–4GlcNAc residues on secreted mammalian glycoproteins (thyroglobulin, fibrinogen, and immunoglobulin G) as measured by a sensitive solid-phase radioimmunoassay. Biochemistry, 29(16), 3959–3965. https://doi.org/10.1021/bi00468a024
- Torok, B., Sipos, E., Pivac, N., & Zelena, D. (2019). Modelling posttraumatic stress disorders in animals. Progress in Neuro-Psychopharmacology & Biological Psychiatry, 90, 117–133. https://doi.org/10.1016/j.pnpbp.2018.11.013
- Tudor, L., Nedic Erjavec, G., Nikolac Perkovic, M., Konjevod, M., Svob Strac, D., Uzun, S., Kozumplik, O., Jovanovic, T., Lauc, G., & Pivac, N. (2019). N-glycomic profile in combat related post-traumatic stress disorder. Biomolecules, 9(12), 834. https://doi.org/10.3390/biom9120834
- Tulogdi, A., Soros, P., Toth, M., Nagy, R., Biro, L., Aliczki, M., Klausz, B., Mikics, E. ,Haller, J. & (2012). Temporal changes in c-Fos activation patterns induced by conditioned fear. Brain Research Bulletin, 88(4), 359–370. https://doi.org/10.1016/j.brainresbull.2012.04.001
- Vacchini, M., Cipolla, L., Gornik, O., Lauc, G., & Klarić, T. (2020). A precise and versatile platform for rapid glycosylation analysis of brain tissue. Analytical Methods, 12(13), 1786–1797. https://doi.org/10.1039/C9AY02596K
- van den Heuvel, L.L., Stalder, T., Du Plessis, S., Suliman, S., Kirschbaum, C., & Seedat, S. (2020). Hair cortisol levels in posttraumatic stress disorder and metabolic syndrome. Stress, 18, 1–13. https://doi.org/10.1080/10253890.2020.1724949
- Varki, A., Cummings, R.D., Esko, J.D., Freeze, H.H., Stanley, P., Marth, J.D., Bertozzi, C.R. ,Hart, G.W., Etzler, M.E. (2009). Symbol nomenclature for glycan representation. Proteomics, 9(24), 5398–5399. https://doi.org/10.1002/pmic.200900708
- Wen, T.H., Binder, D.K., Ethell, I.M., & Razak, K.A. (2018). The perineuronal 'Safety' net? Perineuronal net abnormalities in neurological disorders. Frontiers in Molecular Neuroscience, 11, 270. https://doi.org/10.3389/fnmol.2018.00270
- Westenbroek, C., Ter Horst, G.J., Roos, M.H., Kuipers, S.D., Trentani, A., & den Boer, J.A. (2003). Gender-specific effects of social housing in rats after chronic mild stress exposure. Progress in Neuro-Psychopharmacology & Biological Psychiatry, 27(1), 21–30. https://doi.org/10.1016/s0278-5846(02)00310-x
- Yoshida, Y., Furukawa, J.I., Naito, S., Higashino, K., Numata, Y., & Shinohara, Y. (2016). Quantitative analysis of total serum glycome in human and mouse. Proteomics, 16(21), 2747–2758. https://doi.org/10.1002/pmic.201500550
- Zamze, S., Harvey, D.J., Chen, Y.J., Guile, G.R., Dwek, R.A., & Wing, D.R. (1998). Sialylated N-glycans in adult rat brain tissue-a widespread distribution of disialylated antennae in complex and hybrid structures. European Journal of Biochemistry, 258(1), 243–270. https://doi.org/10.1046/j.1432-1327.1998.2580243.x
- Zelena, D., Mergl, Z., & Makara, G.B. (2003). Maternal genotype influences stress reactivity of vasopressin-deficient brattleboro rats. Journal of Neuroendocrinology, 15(12), 1105–1110. https://doi.org/10.1111/j.1365-2826.2003.01101.x
- Zelena, D., Mikics, E., Balazsfi, D., Varga, J., Klausz, B., Urban, E., Sipos, E., Biro, L., Miskolczi, C., Kovacs, K., Ferenczi, S., & Haller, J. (2016). Enduring abolishment of remote but not recent expression of conditioned fear by the blockade of calcium-permeable AMPA receptors before extinction training. Psychopharmacology, 233(11), 2065–2076. https://doi.org/10.1007/s00213-016-4255-4
- Zhao, S., Walsh, I., Abrahams, J.L., Royle, L., Nguyen-Khuong, T., Spencer, D., Fernandes, D.L., Packer, N.H., Rudd, P.M., & Campbell, M.P. (2018). GlycoStore: A database of retention properties for glycan analysis. Bioinformatics (Oxford, England), 34(18), 3231–3232. https://doi.org/10.1093/bioinformatics/bty319