
Abstract
How sleep regulates physiological stress in healthy individuals is not well understood. We explored the associations between naturally occurring pre-sleep physiological arousal and EEG power spectral density together with rapid eye movement sleep (REMS) continuity. One hundred and fifty-four individuals (mean age 16.9, SD 0.1 years) collected five samples of saliva between the evening (mean time 18:20) and bedtime (mean 23:00) by using swabs, and underwent an overnight in-home polysomnography. We calculated spectral density for REMS and non-rapid eye movement sleep (non-REMS), and the number and duration of REMS arousals (<15 s) during sleep. An observational design allowed for measurement of natural variation in physiological and sleep arousal. Increasing cortisol levels toward bedtime were associated with higher EEG power spectral density at all frequency ranges in frontal locations, the highest association being for the beta1 frequency band. In central locations, the associations were pronounced for beta1 and beta2 bands. Higher overall cortisol levels in the evening were associated with less fragmented REMS. Presleep arousal was not associated with sleep staging. Physiological arousal toward bedtime was associated with EEG power spectral density values during sleep specifically at high EEG frequencies. This may represent a compensatory mechanism that serves as an adaptation to stress, since the REMS was more continuous along a higher physiological arousal level in the evening. Although causality cannot be inferred, a design with nonmanipulated physiological stress followed by naturally timed sleep at home provides new insights into stress regulation homeostasis.
Introduction
Pre-sleep hyperarousal refers to an elevated state of vigilance before sleep onset, and it may manifest as somatic or cognitive arousal – or both. Physiological hyperarousal refers to a state of arousal that can imply heightened autonomic nervous system activity and/or hormonal activity, such as increased hypothalamic-pituitary-adrenal (HPA) axis activity. Cognitive arousal may refer to a heightened subjective experience of stress, and increased rumination of worries. Pre-sleep hyperarousal is also often linked with insomnia symptoms (Sidani et al., Citation2018), and it has been reported to be one of the premorbid characteristic of insomnia (Fernández-Mendoza et al., Citation2010). Both physiological and cognitive pre-sleep hyperarousal have shown to mediate the relationship between daytime stress and worsened sleep (Winzeler et al., Citation2014).
Only polysomnographic studies can reveal how pre-sleep hyperarousal is associated with sleep architecture and quality per se. This information would be particularly important in order to understand how stress experienced before sleep onset affects sleep itself, not just the subjective experience of it. A body of evidence suggests that individuals with insomnia exhibit elevated levels of high-frequency EEG activity, such as increased beta power (Feige et al., Citation2013; Perrier et al., Citation2015). One study demonstrated that high frequency sleep EEG activity in children is longitudinally associated with insomnia symptoms in adolescence (Fernandez-Mendoza et al., Citation2019). A history of childhood maltreatment may further intensify cortical arousal in adults suffering from primary insomnia, as those with a trauma had a higher beta frequency in non-rapid eye movement sleep (NREMS) and rapid eye movement sleep (REMS) EEG compared to those without a trauma history (Bader et al., Citation2013).
Recently, the role of REMS has been increasingly emphasized in response to stress (Nollet et al., Citation2019). It has been presented that REMS contributes to maintaining optimal emotional homeostasis by decreasing accumulation of negative reactivity (Gujar et al., Citation2011; van der Helm et al., Citation2011). REMS deprivation, in turn, has been associated with increased emotional reactivity compared to NREMS deprivation (Rosales-Lagarde et al., Citation2012). These views are supported by animal studies: new compelling evidence shows that stress increases the amount of REMS in particular, and the consolidation of REMS may be a potential compensatory mechanism for daytime stress (Nollet et al., Citation2019). An increased percentage of REMS has been associated with the impairment of corticosterone regulation (Nollet et al., Citation2019).
High frequency EEG activity during sleep in the high-beta and gamma range may indicate that there is an inability to disengage from cognitive processing during sleep (Perlis et al., Citation1997) and that individuals continually resume the stress experience even when asleep. Since the abovementioned studies have been conducted in insomniacs, little is known of the effect of pre-sleep hyperarousal on sleep in generally healthy individuals without significant symptoms of insomnia. These investigations are particularly important for understanding the association between pre-sleep hyperarousal and sleep characteristics without the confounding effect of the inability to maintain sleep, as is often experienced in insomnia.
We explored the associations between naturally occurring pre-sleep arousal, as measured from repeated samples of evening cortisol, and REMS and REMS EEG power spectral density in a community cohort of generally healthy adolescents. We used an observational design reflecting natural living conditions, where we measured nonmanipulated physiological arousal from salivary cortisol repeatedly prior to and at bedtime, and allowed the participants to sleep in their own beds with their own chosen sleep rhythm. We expected to find a positive association with evening cortisol and increased activity at high EEG frequencies specifically during REMS among those with higher evening cortisol levels. In addition, based on the compensatory mechanisms of REMS, we hypothesized to find a similar increase in the consolidation of REM periods as observed in experimental mice models (Nollet et al., Citation2019).
Methods
The participants were from an urban community-based cohort composed of 1049 healthy adolescent singletons (Strandberg et al., Citation2001), all of Finnish origin. The consecutive sample was born between March and November 1998 in Helsinki, Finland. We invited the participants from the cohort as their 17th birthday approached, resulting in a very narrow age range (M = 16.9, SD = 0.1; range 16.6–17.2 years). We invited adolescents who had participated in the previous follow-up at the age of 12 years (Kuula et al., Citation2018; Pesonen et al., Citation2014), and who lived within a 30 km radius of Helsinki and had given consent for further contact (N = 278). In total, 196 adolescents participated (71% of the invited, 74% of those contacted by phone, 61% girls), of which 154 had valid sleep EEG, and cortisol data available (55% girls), with a mean age of 16.9 years (SD = 0.1). Due to original research interests, the flow of participation since the 8-year follow-up (Räikkönen et al., Citation2009, 2017) was weighted on those whose mothers reported higher licorice consumption during pregnancy. The analytic sample in this study did not differ significantly from the rest of the participants in the initial cohort regarding mother’s age or body mass index (BMI) at birth, gestational age, birth weight, length at birth, or maternal alcohol or licorice consumption during pregnancy in T-tests (all p>.5). The Ethics Committee of the Children's Hospital in Helsinki University Central Hospital approved the study protocol (177/13/03/03/2014). Informed written consent was obtained from the participants.
Cortisol
Five samples of saliva were collected using swabs (Salivette; Sarstedt, Nümbrecht, Germany) prior to the sleep EEG, the same evening. The participants were asked to abstain from caffeine and other stimulants from 16:00 onwards. The samples were collected starting on average at 18:20 to bedtime (mean 23:00) with approximately 40 min intervals from sample 1 to sample 4, the last fifth sample being individually adjusted to bedtime (mean interval from sample 4 to 5 was 2 h 40 min). Cortisol concentrations were log-transformed to attain normality. We used the following parameters: area under the curve (AUC; calculated as the time-weighted AUC above zero under trapezoidal rule from all values), the decrease of cortisol from baseline to bedtime and cortisol at bedtime. The samples were stored at −20 °C and salivary cortisol concentrations were determined by use of a competitive solid-phase, time-resolved fluorescence immunoassay with fluorometric end point detection (DELFIA; Wallac, Turku, Finland). Cortisol concentrations were measured in duplicate (University of Trier, Trier, Germany) and their mean was used in the analyses.
PSG protocol and REMS arousal detection
Participants underwent overnight polysomnography (PSG) in their own home, and received a monetary compensation (50€) for their time. The PSG measurements were arranged according to the participants’ schedules, and were conducted over the school year from January to December (excluding July due to summer holidays), and 90% of all recordings were completed on school nights. According to simultaneous actigraphy recording for one week, the PSG night did not differ from their habitual sleep schedule. All recordings were performed using SOMNOscreen plus (SOMNOmedics GmbH, Randersacker, Germany) PSG device. A trained research nurse attached gold cup electrodes at six 10–20 locations (frontal (F) hemispheres: F3, F4; central (C) hemispheres: C3, C4; occipital (O) hemispheres: O1, O2) and two for the mastoids (A1, A2). The electro-oculogram (EOG) and the electromyogram (EMG) were measured by using disposable adhesive electrodes (Ambu Neuroline 715, Ambu A/S, Ballerup, Denmark), two locations for EOG and three locations for EMG. In addition, an online reference (Cz) and a ground electrode in the middle of forehead were used. The sampling rate was 256 Hz (the hardware filters for SOMNOscreen plus are 0.2–35 Hz).
All signals were digitally filtered offline with pass band of 0.5–35 Hz (Hamming windowed sinc zero-phase FIR filter, cutoff (–6 dB) 0.25 Hz and 39.3 Hz, respectively) and re-referenced to the average signal of A1 and A2 electrodes. PSG data were scored manually using the DOMINO software (v2.7; SOMNOmedics GmbH, Randersacker, Germany) in 30-s epochs into stage 1, stage 2, SWS, and REMS according to American Academy of Sleep Medicine (AASM) guidelines (The AASM Manual for the Scoring of Sleep and Associated Events). Percentages of each stage were calculated based on total sleep time.
REMS parameters
REMS fragmentation during sleep was scored manually during visual inspection of pre-staged REMS epochs within the DOMINO software. Fragmentation was defined as an arousal or an abrupt interruption of REMS, which lasts less than 15 s. As a main outcome measure, we calculated REM fragmentation percent (“sum of the duration of REM fragmentation epochs/the duration of REMS during the night”)×100).
Power spectral density analysis
Electrodes located at F3, F4, C3, C4, O1, and O2 were included in the analysis. In addition to hemisphere-specific measures, we calculated overall frontal and central measures as means from both hemispheres. All analysis steps were done using Matlab R2017b (The Mathworks Inc., Novi, MI) and functions of EEGlab 14.1.2b (Delorme & Makeig, Citation2004).
The preprocessed signals were epoched with a 30 s window length. Only epochs free of visually inspected artifacts were included in the analysis. Signals at channel locations where contact impedance was equal or lower than 10 kOhm within the epoch were included. Power spectral density was calculated for each valid channel in each epoch using “spectopo” function of EEGlab with a window length of 1024 samples (4 ms) and overlap of 50% resulting in bins with 0.25 Hz resolution. Power spectral density values were extracted and averaged in five frequency bands: (1) 0.5–3 Hz (delta), (2) 4–7 Hz (theta), (3) 8–12.5 Hz (alpha), (4) 16–24 Hz (beta1), and (5) 25–35 (beta2). The mean values were further averaged across the epochs (REM and NREM) for each electrode location separately.
Potential confounders
In addition to adjusting for sex and age, we considered depressive symptoms, sleep complaints, and the phase of menstrual cycle as potential confounders.
Depressive symptoms were self-reported with the Beck Depression Inventory (BDI-II) (Beck & Steer, Citation1996). The BDI-II is a self-administered measure comprising 21 items which cover a range of depressive symptoms that have been present over the past 2 weeks and each item is rated on a four-point scale (0–3) in terms of intensity of the symptoms, yielding a total score which can vary from 0 to 63. In this study, internal consistency was excellent (Cronbach’s α = 0.92). The sample consisted of 12% mild (≥14 points) and 7% moderate (≥20 points) depression. The form was filled in the same night as the PSG measurement took place.
We used the Pittsburgh Sleep Quality Index (PSQI) (Buysse et al., Citation1989) in assessing subjective sleep complaints. The PSQI is a self-report questionnaire consisting of 19 items. The global score ranges from 0 to 21, with lower scores indicating better sleep quality. The form was filled in the same night than the PSG measurement took place.
Girls reported days passed from their last menstruation start to define the phase of their cycle as a continuous measure. We also checked whether maternal prenatal licorice consumption (high and moderate vs. none) which was self-reported at the maternity hospital after child birth (Räikkönen et al., Citation2010) and that has previously been associated with diurnal cortisol in this sample at the age of 8 (Räikkönen et al., Citation2010), but not at 11–12 years (Räikkönen et al., 2017), would be associated with evening cortisol at the age of 17 years.
Statistical analyses
First, we examined the unadjusted Pearson r-correlations between each of the five evening cortisol samples and power spectral density values and presented the results in a heat map plot. Second, we correlated the time-weighted AUC of evening cortisol and power spectral density variables, and adjusted the correlations for age and sex. Third, we performed linear mixed model analyses with random intercept, maximum likelihood method, and unstructured covariance matrix to examine whether the trajectories of the evening cortisol from the first to the last measure were associated with any of the power spectral density variables and REMS consolidation. For these analyses, we calculated main effects and interactions between the cortisol value and its sampling time, and applied false discovery rate (FDR) calculation to adjust for the multiple testing. Final models were adjusted for age and sex, sampling time and additionally for mood and sleep complaints as well as maternal prenatal licorice consumption, if they were found to correlate with physiological arousal. We present the data in figures comparing the highest quintile with others. All analyses were conducted in SPSS (v25) (SPSS Inc., Chicago, IL).
Results
Initial analyses
displays the basic descriptive statistics for the sample. Girls had significantly more N2 and REMS minutes, but the percentage of these stages of the total sleep time was not significantly different between girls and boys (mean difference for N2 (MD)=2%, standard error (SE)=1.1; MD for REMS = 1.3, SE = 0.9). Girls displayed lower power spectral density in REMS at central alpha, beta1 and beta2 frequencies compared to boys (p values<.03).
Table 1. Sample characteristics – mean, standard deviation and the significance of sex difference.
Age of the participant did not correlate significantly with the basic sleep variables (all p values>.05). However, older age was associated significantly with a higher power spectral density in all frequency bands in both REMS (Pearson’s r range 0.18–0.41, p values<.04, except for central delta power, p=.11) and NREMS (Pearson’s r range 0.17–0.44, p values<.05).
Evening cortisol AUC was associated with menstrual phase in girls, with the more advanced menstrual phase being associated with higher AUC (r = 0.26, p=.01). The cortisol AUC was statistically not different in girls and boys (p=.46), and did not correlate with the age of the participant (p=.44). Cortisol AUC, baseline vs. bedtime ratio, or cortisol at bedtime were not significantly associated with sleep duration (p>.15), REMS percentage (p>.26), NREMS percentage (p>.14), or wake after sleep onset (WASO) minutes (p>.25). Further, cortisol AUC, baseline vs. bedtime ratio, or cortisol at bedtime were not significantly associated with subjective sleep complaints (PSQI) (p>.18), depressive symptoms (BDI-II) (p>.10), or maternal prenatal licorice consumption (p>.09), and therefore were not included in the following analyses.
The associations between evening cortisol and spectral power density
displays the heat maps of the raw correlations between REMS and NREMS power spectral densities and the five evening cortisol samples. Both panels (REMS and NREMS) indicate that associations between evening cortisol and power spectral density strengthens along later measurement point of cortisol in the evening, the strongest associations being with the bedtime sample.
Figure 1. Heat maps of the correlations between cortisol values at five time points before sleep (time 1–time 5 (bedtime)) and sleep EEG power spectral density in REM and NREM sleep at frontal and central locations.
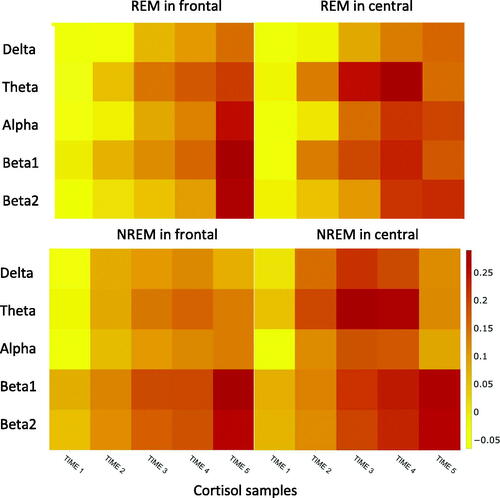
The heat map for REMS shows that an increasing cortisol level toward the bedtime is associated with higher EEG power spectral density at all frequency ranges in the frontal locations. The highest association was for beta1 band. In central locations, the associations were stronger for beta1 and beta2 bands. The heat map for NREMS shows a similar pattern for frontal and central locations. The strongest associations were found for the activity at beta1 and beta2 bands at both locations.
shows the unadjusted and adjusted correlations between cortisol AUC during the evening and the power spectral density variables. With regard to REMS, higher AUC was significantly associated with higher activity in frontal locations at all frequency bands, except for delta. At the central locations, there were no significant associations. With regard to NREMS, higher AUC was significantly associated with higher activity at both beta bands in frontal and central locations, and higher activity at the theta band in frontal locations.
Table 2. The associations between evening cortisol with spectral power density in REM and NREM sleep.
also shows the results from the mixed models where all the frontally measured power spectral density values, but none of the centrally measured values in REMS were associated with higher overall cortisol level in the evening. In NREMS, frontal activity at all frequency bands, except alpha, and central activity at both beta1 and beta2 bands were associated with higher cortisol levels in the evening. Interactions “time × cortisol value” were significant for almost all frequency bands. After correction of multiple testing, most of the associations remained significant ().
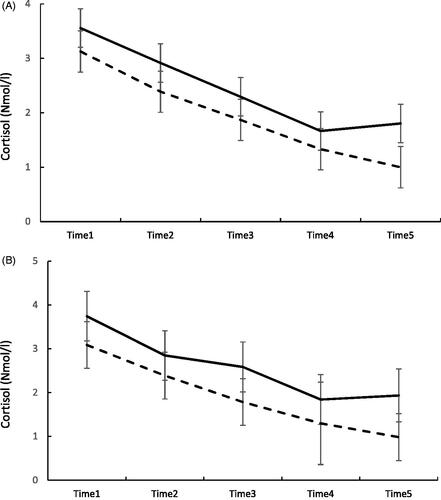
displays the most prominent associations in the mixed models, where both the main effect and the interaction were significant at p<.01. We present the data with a cut off between the highest quintile in EEG power density vs. others. shows the trajectories of evening cortisol according to groups defined by their frontal beta1 activity in REMS and NREMS. Both panels show that individuals with a level of frontal beta1 activity belonging to the highest 80th percentile (N = 28) display higher overall cortisol levels than those below the cutoff, and their trajectory of cortisol first declines, but toward bedtime it increases, whereas in others (N = 114) it continues steadily declining.
Figure 2. Panel A shows the evening cortisol levels and standard errors from time 1 to time 5 (bedtime) in individuals belonging to the highest 80th percentile in beta1 band activity in REMS (continuous line) and those below the 80th percentile (dashed line). p<.03 for the main effect and p<.012 for the interaction “binary frontal beta1 power in REMS × sample number” in mixed model analyses. Panel B shows the evening cortisol levels from time 1 to time 5 (bedtime) in individuals belonging to the highest 80th percentile in beta1 band activity in NREMS (continuous line) and those below the 80th percentile (dashed line). p<.001 for the main effect and p<.10 for the interaction “frontal beta1 power in NREMS*sample number” in mixed model analyses.
The associations between evening cortisol and REMS consolidation
REMS fragmentation was negatively associated with EEG power spectral density in REMS and NREMS in all frequency ranges (r range −0.14 to −0.33, p>.07). The strongest negative associations were seen between beta1 and beta2 band activity and REMS fragmentation: more fragmented REMS was associated with reduced beta1 and beta2 activity (r range −0.25 to −0.33, all p<.003).
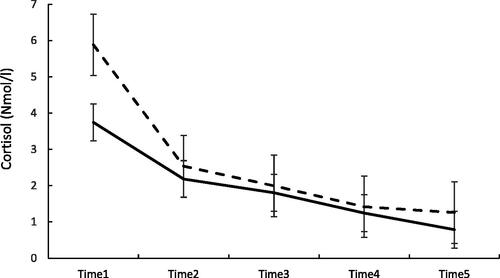
In the mixed model analyses, higher overall cortisol level in the evening was associated with less fragmented REM (B= −.14; 95% CI −.25 to −.03, p=.01), and the associations were moderated by time of the cortisol sample (p=.01 for the interaction). displays the trajectories of evening cortisol according to groups defined by their REMS fragmentation. We present the data with a cut off between the highest quintile in REM fragmentation vs. others. It shows that those belonging to the highest 80th percentile in REMS fragmentation (N = 30) displayed a lower baseline (first cortisol sample) of evening cortisol than individuals below that cutoff (N = 121), and the difference decreased toward bedtime.
Figure 3. Evening cortisol levels and standard errors from time 1 to time 5 (bedtime) in individuals belonging to the highest 80th percentile in REMS fragmentation (continuous line) and those below the 80th percentile (dashed line). p=.75 for the main effect and p=.056 for the “binary REMS fragmentation × sample number” in mixed model analyses.
Discussion
This is, as far as we know, the first study to show how pre-sleep physiological arousal is associated with sleep EEG power spectral densities and REMS consolidation in a healthy sample of young individuals. Examining the relationships between stress and sleep in a non-clinical population is informative, since the inability to maintain sleep due to insomnia may be a major confounding factor (Feige et al., Citation2013). Although the observational design precludes any causal interpretations, a design measuring individual variation in naturally occurring physiological stress prior to bedtime, followed by naturally timed sleep at home, provided new hypotheses regarding stress regulation homeostasis via sleep.
The raw associations for REMS indicated that a higher cortisol value toward bedtime is associated with higher EEG spectral density in all frequency ranges (delta–beta) at all, but mostly in theta and beta1 range at frontal locations, whereas in central locations, the power spectral density at theta, beta1 and beta2 bands was increased. For the NREMS, the pattern resembled to that of REMS, with power spectral density at higher frequencies (beta1 and beta2) being emphasized along a higher cortisol level at bedtime. The emphasis in our findings on high frequency ranges (beta1 and beta2) following pre-sleep physiological arousal, is similar to what has been reported in the few previous insomnia studies (Fernandez-Mendoza et al., Citation2019; Sidani et al., Citation2018).
When we looked at all the five evening values in a repeated mixed model, a higher overall cortisol level in the evening was associated with higher activity at frontal locations in REMS, but not in NREMS. With respect to NREMS, a higher overall cortisol level in the evening was associated with higher activity at frontal locations and at all frequency bands except alpha. The association was found at beta1 and beta2 bands only in central locations. Since the secretion of cortisol displays a clear diurnal rhythm, the highest values appearing after awakening, and thereafter declining toward bedtime (Bhake et al., Citation2019), the current associations were moderated by time. The time-dependent analysis show that the individuals with the highest beta1 band activity in REMS and/or NREMS had a higher level of cortisol throughout the evening, although declining toward the bedtime as assumed. Interestingly, the steady decline toward bedtime ceased after the fourth sample, and a slight increase was observed toward the last sample at bedtime in the individuals belonging to the high activity beta1 and beta2 group. This may indicate that these individuals were not able to calm down before sleep onset as efficiently as the others. We did not include measures to estimate whether this is due to psychological arousal and rumination taking place at the last minute, but this remains a compelling hypothesis (Zoccola et al., Citation2017).
With regard to REMS fragmentation, a higher overall cortisol level in the evening was associated with less fragmented REMS. This finding, although observational, is the first in humans that echoes the experimental mouse work (Nollet et al., Citation2019) which showed that unpredictable chronic mild stress in mice had a positive impact specifically on REMS consolidation and increased theta activity in REMS – both associations observed in our study as well. These findings point to the role of REMS as an adaptation mechanism to stress experienced during the waking hours. It has been suggested that REMS consolidation may function to de-potentiate emotional load; a function that is disrupted when REMS is fragmented by brief arousals. It is thus likely that REMS promotes both reactivation of previously acquired affective experiences in the limbic system and their integration to semantic memory, leading to reduced amygdala activity and affective memory trace over time (Walker & van der Helm, Citation2009). In support of this, it has been shown how rapid eye movements in REMS cause transient, time-locked activation of the amygdala (Corsi-Cabrera et al., Citation2016), confirming the role of the limbic system in reprocessing and consolidation of emotional experiences during REMS.
An experimental fMRI study (van der Helm et al., Citation2011) showed that when REMS was characterized by lower gamma power at the prefrontal region there was a greater overnight de-potentiation of neural and behavioral responsivity to affective stimuli. Insomnia severity and an experience of distress lasting overnight has also been associated with nocturnal hyperarousal and REM discontinuity (Wassing et al., Citation2016).
From the clinical perspective, our results offer new insights into the link between pre-sleep physiological arousal, and sleep characteristics. Current theories of primary insomnia highlight the role of cognitive, emotional, and physiological hyperarousal as playing a decisive role in the pathophysiology of insomnia (Feige et al., Citation2013). Here, we show in generally healthy individuals, who do not have difficulties in sleep maintenance, that naturally occurring physiological arousal in the evening associates with heightened sleep EEG activity most strongly for the beta bands, that is generally interpreted as a marker of cortical hyperarousal (Feige et al., Citation2013). However, pre-sleep physiological arousal did not have an effect on the general sleep architecture (percent of sleep stages) or with sleep latency. These results show, however, that even subtle differences in the physiological arousal levels in the evening are followed by robust changes in the sleep microarchitecture, alterations that cannot be easily measured other than by PSG. The intriguing finding is related to the twofold process following pre-sleep arousal: while cortical arousal is enhanced, potentially referring to the processing of information during sleep (Llinas & Ribary, Citation1993), the consolidation of REMS is enhanced as well. These processes together may then also be interpreted as adaptive responses to stress. However, we also found evidence that these processes have a moderate inverse relationship: a more fragmented REMS was associated with lower beta1 and beta2 activity in both REMS and NREMS. It could be speculated that in cases where REMS is more fragmented, as seen in mild depression (Pesonen et al., Citation2019) and in post-traumatic stress (Habukawa et al., Citation2018), the potential to resolve stress through neural processes, seen as high frequency EEG, may be lost. Thus, the question of w/hether higher cortical arousal in sleep, often observed in insomnia as a negative sign, can actually be an adaptive process coupled with solid, continuous REMS, remains an open question.
Notably, stress is a broad concept that encompasses cognitive, emotional, and neurobiological functions. Neuroimaging studies have suggested that insomnia may be the result of a relative overactivity in corticolimbic areas interfering with sleep initiation and sleep maintenance (Spiegelhalder et al., Citation2015). The great majority of insomnia research, on the other hand, focuses exclusively on the subjective experience of hyperarousal and the accompanying sleep reactivity in insomnia (Drake et al., Citation2004; Feige et al., Citation2013; Kalmbach et al., Citation2018). These and related studies have implications for the current observations though. For example, it has been suggested that there is heterogeneity in terms of different presleep hyperarousal qualities in terms of their comorbidities, such that specifically self-reported somatic presleep arousal would be an index of co-morbid clinical anxiety in individuals with insomnia (Puzino et al., Citation2019). Noteworthy, Fernandez-Mendoza et al. studied a subgroup of insomniacs and controls from a population-based cohort of the same age as the current cohort (Fernandez-Mendoza et al., Citation2016). They found increased beta frequencies in NREMS (REMS frequencies were not reported) and while initiating sleep in the insomnia group, but this was specifically characteristic of those with a short sleep duration (Fernandez-Mendoza et al., Citation2016). Our study showed similar patterns of cortical arousal in response to normal variation in physiological presleep stress in individuals without insomnia. In our study, the raw associations were not very robust though, which can indicate the heterogeneity of the sample. It is likely that some individuals display both HPA hyperactivity and cortical hyperarousal during sleep, while others may have normal HPA axis activity but still cortical have hyperarousal during sleep.
The strength of this study is a relatively large sleep EEG sample of individuals in late adolescence, with repeated salivary cortisol data available in the evening time. Limitations of the study include the measurement of only one single night. Since our study is observational, no causal inferences can be drawn. It is equally possible that heightened evening cortisol and specific sleep characteristics reflect a common underlying factor. Also, the participants slept in their home environment, which may have introduced uncontrollable elements, but may also be a more ecologically valid and less stress-prone environment than a sleep lab. Also, both EEG power and cortisol release are affected by the endogenous circadian phase that we were not able to measure. Importantly, we did not measure the subjective experience of stress or cognitive arousal from the same period as the cortisol samples. This would have provided valuable information of the physiological arousal as experienced psychologically by the individuals. We are not familiar with any other PSG study that has repeated samples of cortisol in the evening available; therefore, a replication cohort to confirm our findings is lacking. Finally, our PSG device did not allow us to measure higher gamma EEG frequency bands, which may more clearly show events of cortical arousal.
To conclude, this observational study showed how pre-sleep physiological arousal is associated with higher cortical arousal and more continuous REMS in healthy, young individuals. In contrast to previous studies in individuals with insomnia with significant challenges in sleep maintenance, this study was able to characterize the function of sleep in stress regulation in individuals with a normal variation in sleep quality. These findings show how stress experienced at wake prior to bedtime is associated with higher cortical arousal during the night, as well as with more consolidated REMS in healthy adolescents. To what degree these two parallel changes observed in this study can be considered as adaptive reactions to stress remains to be solved.
Disclosure statement
No potential conflict of interest was reported by the author(s).
Additional information
Funding
Notes on contributors
Anu-Katriina Pesonen
AKP designed the study follow-up and KR designed the initial cohort study. LK and RH collected data. AKP, TM and ME analyzed the data. AKP wrote the first draft of the manuscript. All authors contributed to the revision of the manuscript.
References
- Bader, K., Schäfer, V., Nissen, L., & Schenkel, M. (2013). Heightened beta EEG activity during nonrapid eye movement sleep in primary insomnia patients with reports of childhood maltreatment. Journal of Clinical Neurophysiology, 30(2), 188–198. https://doi.org/https://doi.org/10.1097/WNP.0b013e3182767c4a
- Beck, A. T., & Steer, R. A. E. A. (1996). Manual for the Beck Depression Inventory-II. San Antonio, TX: Psychological Corporation.
- Bhake, R., Kluckner, V., & Stassen, H. (2019). Continuous free cortisol profiles – Circadian rhythms in healthy men. Journal of Clinical Endocrinology and Metabolism, 104(12), 5935–5947. https://doi.org/https://doi.org/10.1210/jc.2019-00449
- Buysse, D. J., Reynolds, C. F., Monk, T. H., Berman, S. R., & Kupfer, D. J. (1989). The Pittsburgh Sleep Quality Index: A new instrument for psychiatric practice and research. Psychiatry Research, 28(2), 193–213. [Database] https://doi.org/https://doi.org/10.1016/0165-1781(89)90047-4
- Corsi-Cabrera, M., Velasco, F., Del Río-Portilla, Y., Armony, J. L., Trejo-Martínez, D., Guevara, M. A., & Velasco, A. L. (2016). Human amygdala activation during rapid eye movements of rapid eye movement sleep: An intracranial study. Journal of Sleep Research, 25(5), 576–582. https://doi.org/https://doi.org/10.1111/jsr.12415
- Delorme, A., & Makeig, S. (2004). EEGLAB an open source toolbox for analysis of single-trial EEG dynamics. Journal of Neuroscience Methods, 134(1), 9–21. https://doi.org/https://doi.org/10.1016/j.jneumeth.2003.10.009
- Drake, C., Richardson, G., Roehrs, T., Scofield, H., & Roth, T. (2004). Vulnerability to stress-related sleep disturbance and hyperarousal. Sleep, 27(2), 285–291. https://doi.org/https://doi.org/10.1093/sleep/27.2.285
- Feige, B., Baglioni, C., Spiegelhalder, K., Hirscher, V., Nissen, C., & Riemann, D. (2013). The microstructure of sleep in primary insomnia: An overview and extension. International Journal of Psychophysiology, 89(2), 171–180. https://doi.org/https://doi.org/10.1016/j.ijpsycho.2013.04.002
- Fernandez-Mendoza, J., Li, Y., Fang, J., Calhoun, S. L., Vgontzas, A. N., Liao, D., & Bixler, E. O. (2019). Childhood high-frequency EEG activity during sleep is associated with incident insomnia symptoms in adolescence. Journal of Child Psychology and Psychiatry, and Allied Disciplines, 60(7), 742–751. https://doi.org/https://doi.org/10.1111/jcpp.12945
- Fernandez-Mendoza, J., Li, Y., Vgontzas, A. N., Fang, J., Gaines, J., Calhoun, S. L., Liao, D., & Bixler, E. O. (2016). Insomnia is associated with cortical hyperarousal as early as adolescence. Sleep, 39(5), 1029–1036. https://doi.org/https://doi.org/10.5665/sleep.5746
- Fernández-Mendoza, J., Vela-Bueno, A., Vgontzas, A. N., Ramos-Platón, M. J., Olavarrieta-Bernardino, S., Bixler, E. O., & De la Cruz-Troca, J. J. (2010). Cognitive-emotional hyperarousal as a premorbid characteristic of individuals vulnerable to insomnia. Psychosomatic Medicine, 72(4), 397–403. https://doi.org/https://doi.org/10.1097/PSY.0b013e3181d75319
- Gujar, N., Yoo, S.-S., Hu, P., & Walker, M. P. (2011). Sleep deprivation amplifies reactivity of brain reward networks, biasing the appraisal of positive emotional experiences. The Journal of Neuroscience, 31(12), 4466–4474. https://doi.org/https://doi.org/10.1523/JNEUROSCI.3220-10.2011
- Habukawa, M., Uchimura, N., Maeda, M., Ogi, K., Hiejima, H., & Kakuma, T. (2018). Differences in rapid eye movement (REM) sleep abnormalities between posttraumatic stress disorder (PTSD) and major depressive disorder patients: REM interruption correlated with nightmare complaints in PTSD. Sleep Medicine, 43, 34–39. https://doi.org/https://doi.org/10.1016/j.sleep.2017.10.012
- Kalmbach, D. A., Cuamatzi-Castelan, A. S., Tonnu, C. V., Tran, K. M., Anderson, J. R., Roth, T., & Drake, C. L. (2018). Hyperarousal and sleep reactivity in insomnia: Current insights. Nature and Science of Sleep, 10, 193–201. https://doi.org/https://doi.org/10.2147/NSS.S138823
- Kuula, L., Pesonen, A.-K., Merikanto, I., Gradisar, M., Lahti, J., Heinonen, K., Kajantie, E., & Räikkönen, K. (2018). Development of late circadian preference: Sleep timing from childhood to late adolescence. The Journal of Pediatrics, 194, 182–189.e1. https://doi.org/https://doi.org/10.1016/j.jpeds.2017.10.068
- Llinas, R., & Ribary, U. (1993). Coherent 40-Hz oscillation characterizes dream state in humans. Proceedings of the National Academy of Sciences of the United States of America, 90(5), 2078–2081. https://doi.org/https://doi.org/10.1073/pnas.90.5.2078
- Nollet, M., Hicks, H., McCarthy, A. P., Wu, H., Möller-Levet, C. S., Laing, E. E., Malki, K., Lawless, N., Wafford, K. A., Dijk, D.-J., & Winsky-Sommerer, R. (2019). REM sleep's unique associations with corticosterone regulation, apoptotic pathways, and behavior in chronic stress in mice. Proceedings of the National Academy of Sciences of the United States of America, 116(7), 2733–2742. https://doi.org/https://doi.org/10.1073/pnas.1816456116
- Perlis, M. L., Giles, D. E., Mendelson, W. B., Bootzin, R. R., & Wyatt, J. K. (1997). Psychophysiological insomnia: The behavioural model and a neurocognitive perspective. Journal of Sleep Research, 6(3), 179–188. https://doi.org/https://doi.org/10.1046/j.1365-2869.1997.00045.x
- Perrier, J., Clochon, P., & Bertran, F. (2015). Specific EEG sleep pattern in the prefrontal cortex in primary insomnia. PLoS One, 10(1), e0116864. https://doi.org/https://doi.org/10.1371/journal.pone.0116864
- Pesonen, A.-K., Gradisar, M., Kuula, L., Short, M., Merikanto, I., Tark, R., Räikkönen, K., & Lahti, J. (2019). REM sleep fragmentation associated with depressive symptoms and genetic risk for depression in a community-based sample of adolescents. Journal of Affective Disorders, 245, 757–763. https://doi.org/https://doi.org/10.1016/j.jad.2018.11.077
- Pesonen, A.-K., Martikainen, S., Heinonen, K., Wehkalampi, K., Lahti, J., Kajantie, E., & Räikkönen, K. (2014). Continuity and change in poor sleep from childhood to early adolescence. Sleep, 37(2), 289–297. https://doi.org/https://doi.org/10.5665/sleep.3400
- Puzino, K., Frye, S. S., LaGrotte, C. A., Vgontzas, A. N., & Fernandez-Mendoza, J. (2019). Am I (hyper)aroused or anxious? Clinical significance of pre-sleep somatic arousal in young adults. Journal of Sleep Research, 28(4), e12829. https://doi.org/https://doi.org/10.1111/jsr.12829
- Räikkönen, K., Martikainen, S., Pesonen, A.-K., Lahti, J., Heinonen, K., Pyhälä, R., Lahti, M., Tuovinen, S., Wehkalampi, K., Sammallahti, S., Kuula, L., Andersson, S., Eriksson, J. G., Ortega-Alonso, A., Reynolds, R. M., Strandberg, T. E., Seckl, J. R., & Kajantie, E. (2017). Maternal licorice consumption during pregnancy and pubertal, cognitive, and psychiatric outcomes in children. American Journal of Epidemiology, 185(5), 317–328. https://doi.org/https://doi.org/10.1093/aje/kww172
- Räikkönen, K., Seckl, J. R., Heinonen, K., Pyhälä, R., Feldt, K., Jones, A., Pesonen, A.-K., Phillips, D. I. W., Lahti, J., Järvenpää, A.-L., Eriksson, J. G., Matthews, K. A., Strandberg, T. E., & Kajantie, E. (2010). Maternal prenatal licorice consumption alters hypothalamic-pituitary-adrenocortical axis function in children. Psychoneuroendocrinology, 35(10), 1587–1593. https://doi.org/https://doi.org/10.1016/j.psyneuen.2010.04.010
- Räikkönen, K., Pesonen, A.-K., Heinonen, K., Lahti, J., Komsi, N., Eriksson, J. G., Seckl, J. R., Jarvenpaa, A.-L., & Strandberg, T. E. (2009). Maternal licorice consumption and detrimental cognitive and psychiatric outcomes in children. American Journal of Epidemiology, 170(9), 1137–1146. https://doi.org/https://doi.org/10.1093/aje/kwp272
- Rosales-Lagarde, A., Armony, J. L., Del Río-Portilla, Y., Trejo-Martínez, D., Conde, R., & Corsi-Cabrera, M. (2012). Enhanced emotional reactivity after selective REM sleep deprivation in humans: An fMRI study. Frontiers in Behavioral Neuroscience, 6, 25. https://doi.org/https://doi.org/10.3389/fnbeh.2012.00025
- Sidani, S., Ibrahim, S., Lok, J., O’Rourke, H., Collins, L., & Fox, M. (2018). Comparing the experience of and factors perpetuating chronic insomnia severity among young, middle-aged, and older adults. Clinical Nursing Research. https://doi.org/https://doi.org/10.1177/1054773818806164
- Spiegelhalder, K., Regen, W., Baglioni, C., Nissen, C., Riemann, D., & Kyle, S. D. (2015). Neuroimaging insights into insomnia. Current Neurology and Neuroscience Reports, 15(3), 9. https://doi.org/https://doi.org/10.1007/s11910-015-0527-3
- Strandberg, T. E., Järvenpää, A. L., & Vanhanen, H. (2001). Birth outcome in relation to licorice consumption during pregnancy. American Journal of Epidemiology, 153(11), 1085–1088. https://doi.org/https://doi.org/10.1093/aje/153.11.1085
- van der Helm, E., Yao, J., Dutt, S., Rao, V., Saletin, J. M., & Walker, M. P. (2011). REM sleep depotentiates amygdala activity to previous emotional experiences. Current Biology, 21(23), 2029–2032. https://doi.org/https://doi.org/10.1016/j.cub.2011.10.052
- Walker, M. P., & van der Helm, E. (2009). Overnight therapy? The role of sleep in emotional brain processing. Psychological Bulletin, 135(5), 731–748. https://doi.org/https://doi.org/10.1037/a0016570
- Wassing, R., Benjamins, J. S., Dekker, K., Moens, S., Spiegelhalder, K., Feige, B., Riemann, D., van der Sluis, S., Van Der Werf, Y. D., Talamini, L. M., Walker, M. P., Schalkwijk, F., & Van Someren, E. J. W. (2016). Slow dissolving of emotional distress contributes to hyperarousal. Proceedings of the National Academy of Sciences of the United States of America, 113(9), 2538–2543. https://doi.org/https://doi.org/10.1073/pnas.1522520113
- Winzeler, K., Voellmin, A., Schäfer, V., Meyer, A. H., Cajochen, C., Wilhelm, F. H., & Bader, K. (2014). Daily stress, presleep arousal, and sleep in healthy young women: A daily life computerized sleep diary and actigraphy study. Sleep Medicine, 15(3), 359–366. https://doi.org/https://doi.org/10.1016/j.sleep.2013.09.027
- Zoccola, P. M., Manigault, A. W., & Figueroa, W. S. (2017). Trait rumination predicts elevated evening cortisol in sexual and gender minority young adults. International Journal of Environmental Research and Public Health, 14(11), 1365. https://doi.org/https://doi.org/10.3390/ijerph14111365