
Abstract
Corticotropin releasing hormone (CRH) neurons located in the nucleus of hippocampal commissure (NHpC) have been proposed to be involved in the avian neuroendocrine regulation of stress and appeared to respond prior to CRH neurons in the hypothalamic paraventricular nucleus (PVN) when food deprivation stress was applied. Since the response of the NHpC was rapid and short-lived, was it regulated differentially from CRH neurons in the PVN? We, therefore, applied immobilization stress to test whether the NHpC response was stressor specific. Gene expression of CRH and stress-related genes in the NHpC, PVN, anterior pituitary (APit) as well as plasma corticosterone (CORT) were determined. Furthermore, brain derived neurotrophic factor (BDNF) and glucocorticoid receptor (GR) were examined regarding their possible roles in the regulation of CRH neurons. Data showed that rapid activation of CRH mRNA in the NHpC occurred and preceded a slower gene activation in the PVN, upregulation of proopiomelanocortin (POMC) transcripts in the APit and significant increases of CORT concentrations. Results suggested BDNF’s role in negative feedback between CRH and CRHR1 in the NHpC and positive feedback between CRH and CRHR1 in the PVN. In the APit, V1bR activation appeared responsible for sustaining CORT release when stress persisted. Overall, data suggest that the NHpC functions as part of the HPA axis of birds and perhaps a comparable extra-hypothalamic structure occurs in other vertebrates.
The nucleus of the hippocampal commissure, a structure outside of the hypothalamus, shows rapidly increased neural gene expression that appears to contribute to the early activation of the traditional hypothalamic-pituitary-adrenal (HPA) axis responsible for the production of stress hormones.
Lay Summary
1. Introduction
Activation of parvocellular neurons within the avian hypothalamic paraventricular nucleus (PVN) resulted in an increase of corticotropin releasing hormone (CRH) and arginine vasotocin (AVT) (Kuenzel & Jurkevich, Citation2010). When CRH and AVT reach the anterior pituitary (APit), CRH binds to two G-protein coupled receptors, CRHR1 and CRHR2; AVT or AVP binds to the V1aR and V1bR. They, in turn, stimulate proopiomelanocortin (POMC) synthesis that is further processed to adrenocorticotropic hormone (ACTH) (Bonfiglio et al., Citation2011). In adrenal glands, ACTH activates the avian interrenal tissue to produce the stress hormone, corticosterone (CORT) (Herman et al., Citation2016; Romero, Citation2004). Stress hormone binds to glucocorticoid receptors (GRs) located on different tissues to provide energy for immediate use (McEwen, Citation2007) as well as to induce a negative feedback that regulates hypothalamic-pituitary-adrenocortical (HPA) axis activity (Keller-Wood, Citation2015; Chrousos, Citation2009; Vandenborne et al., Citation2005). Additionally, CRH neurons were identified in the nucleus of the hippocampal commissure (NHpC), an extra-hypothalamic structure, suggesting that the NHpC may be involved in the regulation of the stress response (Nagarajan et al., Citation2017a, Citation2014; Xie et al., Citation2010).
Utilizing food deprivation (FD) showed that the NHpC was activated prior to the PVN indicating that CRH neurons in the NHpC could be early responders initiating the stress response (Nagarajan et al., Citation2017b). Recently, utilizing FD showed that CRH gene expression peaked early in the NHpC. In contrast, a steady increase in gene expression of CRH and CRHR1 occurred in the PVN suggesting a positive feedback (Kadhim et al., Citation2019). A similar, positive relationship was found with AVT and its receptors in the PVN, but not in the NHpC (Kadhim et al., Citation2020). Furthermore, it has been found that specifically brain derived neurotrophic factor (BDNF) (Bath et al., Citation2013) and CRH neurons (Jeanneteau et al., Citation2012) could be involved in the regulation of stress, since the BDNF gene promotor site has many binding sites for cyclic adenosine monophosphate (cAMP) response element protein (CREB) (Blendy, Citation2006; Tardito et al., Citation2006). Research addressing the sequence of activation of CRH and AVT neurons and their receptors within the avian NHpC and PVN has to date only involved a single stressor, FD. We, therefore, utilized a different stressor, immobilization, to determine whether the neuroendocrine stress response sequence followed the same pattern showing an early activation of CRH mRNA within the NHpC. The previous stressor examined, FD, affected the energetic state of animals and intensified with time. In contrast, immobilization appears to be psychogenic, having a more profound effect initially. Applying this stressor over a short time span would be a valid test to determine whether the sequence of a panel of stress genes persists and includes an early activation of genes within the NHpC structure. Our hypothesis is that CRH neurons in the NHpC would be the first responders to immobilization stress thereby suggesting a role in the avian neuroendocrine regulation of stress.
2. Material and methods
2.1. Animals and immobilized stress procedure
Male Cobb 500 chicks (Gallus gallus) one day old, were raised in brooder batteries for ten days provided with food and water ad libitum. A light program of 16 h of light (L): 8 h of dark (D) was initiated (LD 16:8) after 3 days with lights on at 6:00 AM. Heat provided to the chicks was initially 32 °C that was reduced 2.5 °C weekly until reaching 24 °C. On day 10, birds were distributed randomly to cages (3 birds/cage) in room #1. At 5 weeks of age, experiments were initiated, and sampling occurred between 8:00 AM and 4:00 PM over a two-day period. Room #2 served as the immobilization room. It had individual cages with Styrofoam blocks lining each side wall. Each bird was wrapped in a cloth followed by sealing Velcro straps around its body and feet. The procedure prevented the bird’s wings from flapping and its feet from moving under its body. Thereafter, the bird was placed head-first, ventral side down between the Styrofoam blocks. Each bird faced the wall of the room, unable to see other birds. Water was provided for each bird. Two birds were taken out of the same cage each time from room #1 by the animal care person and quickly brought to room #2 where a second person was available so that both birds could be wrapped and properly positioned in each cage and the initial time of restraint recorded. All sampling time points were randomized and one bird at a time was brought to the surgical room where blood, brain and pituitary gland were sampled. All procedures utilized were approved by the University of Arkansas Institutional Animal Care and Use Committee.
2.2. Experimental design and sample collection for gene expression
A stressor, immobilization, was initiated on week 5. Chicks were randomly assigned to one of six treatment groups (n = 12/treatment): control (no stress), 15 m (m = minutes), 30 m, 60 m, 90 m, and 120 m. Directly following restraint, blood samples were collected from the brachial vein in heparinized tubes for each bird. After cervical dislocation, brain and APit were rapidly dissected. Each brain sample was immediately immersed in two-methyl butane at −30 °C for 15 s, placed in dry ice along with APit and both structures stored at −80 °C until processed. Coronal sections of brain samples were cut at 100 µm using a cryostat (Leica CM3050 S). Targeted structures were micro-dissected by punching a circular area (brain punch, Palkovits, Citation1973) using a glass pipette including (1) the NHpC, 1.4 mm diameter from atlas plates A8.2–A7.6; (2) the PVN, 1.4 mm diameter including atlas plates A8.0–A6.4 (Kuenzel & Masson, Citation1988). For the NHpC dissection, the anterior commissure (AC) was used as a landmark immediately ventral to the NHpC. The dissected NHpC and PVN were transferred to Trizol and stored at −20 °C until processed for RNA extraction.
2.3. Antibody production against chicken CRH receptor 1 and antigen specificity control
Polyclonal antibodies to a sequence of the chicken CRHR1 were produced in guinea pigs by a commercial company (21st Century Biochemicals Inc., Marlboro, MA, USA). Briefly, guinea pigs (n = 4) were injected with synthetic peptides comprising 13 or 14 amino acids from the 1st extracellular domain of chicken CRHR1 (residues 180-193; TMNPEVHESNVVWC). The amino acid sequence of the protein was probed against the nonredundant GenBank protein database using NCBI-BLAST software (NCBI reference sequence: NP_989652.1) and was specific to the chicken CRHR1. Two versions of the same peptide sequence were used. To enhance the immune system, KLH (keyhole limpet hemocyanin) was conjugated to a cysteine residue that was added to either the N-terminus or the C-terminus. The peptides were mixed and injected with complete Freund’s adjuvant at day zero, with boosts on days 14, 28, 42 and 63 using incomplete Freund’s adjuvant. Production bleeds were taken on days 49, 70 and 77. The final bleed from one of the guinea pigs was affinity purified. The peptide sequence was confirmed using tandem mass spectrophotometry (MS).
The Western blot technique was utilized to validate the custom-made chicken CRHR1 antibody. First protein extracts of micro-dissected punches of the NHpC from frozen chick brain slices were used (refer to Section Western blot experiment). A pre-absorption assay including protein extracts of the NHpC and the synthetic peptide sequence of the chicken CRHR1 used to immunize guinea pigs were designed to test the specificity of the antibody produced. A working concentration of the antibody (1:5,000) and 2.5 μg of the peptide sequence (antigen) used to generate the CRHR1 antibody provided by the company were incubated for 3 h at room temperature. A second incubation procedure for 3 h was utilized for the working concentration of the CRHR1 antibody (1:5,000) solution including the peptide sequence of the antigen at twice its normal concentration (5.0 μg). Thereafter, each solution was centrifuged at 25,000 g for 30 min. The supernatant of each solution served as the primary antibody solution and applied to the origin of the Western blot along with a ladder showing molecular weight markers. To verify that an equal amount of protein (60 μg) was added to each membrane, the membrane was stripped and re-blotted with a reference protein (GAPDH).
2.4. Radioimmunoassay (RIA)
Plasma was obtained from heparinized blood (n = 12/treatment) via centrifugation at 3000 rpm for 20 m at 4 °C and stored at −20 °C until analysis of CORT concentrations by RIA (Kadhim et al., Citation2020; Madison et al., Citation2008; Proudman & Opel, Citation1989). Hemolyzed samples (1-2 samples/group) were excluded. Briefly, primary antibody (100 μl, polyclonal rabbit anti-CORT # 377, kindly provided by Dr. Proudman) and 125I corticosterone tracer (100 μl, MP Biomedicals Inc., Orangeburg, NY, US477A) were incubated with each sample for at least 24 h at 4 °C. Sheep anti-rabbit antibody (200 μl) was used as the secondary antibody (MP Biomedicals Inc., Orangeburg, NY, USA). Counts/tube were determined using a Perkin Elmer Wizard gamma-counter. Samples were assayed in duplicate. After statistical analysis, data were expressed as the mean ± SEM for each group. In all studies, p < 0.05 was considered statistically significant. Intraexperimental coefficient of variance was less than 11%.
2.5. RNA extraction from collected samples
RNA extraction from frozen micro-dissected brain tissue and APit (n = 12 birds/group) was described previously (Kadhim et al., Citation2019, Citation2020). Briefly, Trizol-chloroform (Life Technologies) was used to extract total RNA followed by a treatment with RNase-free DNase I (Ambion, Austin, TX, USA). After purification using an RNeasy mini kit (Qiagen), an RNA concentration was estimated using a micro plate reader (BioTek). Samples with insufficient RNA amounts (1-3 samples) were excluded. First-strand cDNA was synthesized in 60 μl from total RNA (400 ng of NHpC, 600 ng of PVN, and 600 ng of APit) using Superscript® III reverse transcriptase (Invitrogen). The best primer pair was chosen depending on past studies in our lab (Kadhim et al., Citation2020, Citation2019). The assay was run in triplicate and achieved in 30 μl using the following conditions: 1 cycle at 95 °C for 10 m and amplified for 40 cycles at 95 °C for 30 s, 60 °C for 1 m, and 72 °C for 30 s. The chicken glyceraldehyde-3-phosphate dehydrogenase (GAPDH) or beta actin (βA) were used as internal controls to normalize the mRNA levels. Relative gene expression levels of each specific gene were determined by the 2−ΔΔCt method (Schmittgen & Livak, Citation2008). Relative expression of control groups was set to 1.
2.6. Western blot experiment
Protein content analysis was conducted for APit and brains collected from birds subjected to different time lengths of immobilization (n = 6 birds/group). Brain and APit samples were handled as described in previous section 2.5. Total proteins were extracted from NHpC, PVN, and APit using RIPA Lysis and Extraction Buffer mixed with protease and phosphatase inhibitor cocktails (Thermo Fisher Scientific). After homogenization using glass beads, samples were centrifuged at 14000 rpm/20m at 4 °C, and the supernatant was taken. Thereafter, a Bradford protein assay (Bio-Rad protein assay kit) was utilized to determine the protein concentration using Synergy HT multimode microplate reader. Total protein from the NHpC (40 µg), PVN (60 µg) and APit (60 µg) were diluted in loading lithium dodecyl sulfate sample buffer containing a reducing agent. Samples were heated for 10 m at 70 °C before loading onto a NuPAGE™ 4-12% Bis-Tris protein gel and separated at 150v until reaching the ends of the gel. Proteins were then transferred to an Amersham hybond P 0.2 PVDF membrane (GE Healthcare Life Sciences) by applying a current of 30v for 75 m in tris-glycine HCl buffer (pH 7.6). Nonspecific binding was blocked by nonfat milk (5%) for 2 h/RT. The membrane was then incubated overnight with primary antibody guinea pig anti-chicken CRHR1 (polyclonal, dilution 1:5,000) or mouse anti-GR (polyclonal, dilution 1:200, sc-393232, Santa Cruz Biotechnology, Inc.). After washing the membrane twice in Tris-buffered saline with 0.1% Tween-20 (TBS-T), the membrane was incubated with horseradish peroxidase-conjugated anti-mouse, or anti-guinea-pig IgG (1:5,000, Cell Signaling Technology) for 1 h at RT. After rinsing twice with TBS-T, an enhanced Chemiluminescence Kit (Immun-star™ Western C™ Kit, Bio-Rad) was used to visualize the signal and captured by FluorChem M MultiFluor system (protein sample). Rabbit anti-GAPDH (dilution 1:5,000, NB300-327, Novus Biologicals) was used as the reference protein. Image acquisition and analysis of band densities were performed by alpha view software (Version 3.4.0, 1993-2011).
2.7. Statistical analysis
Statistical analyses were performed using JMPR pro 14.0 (SAS Institute Inc., NC). A normal distribution was first tested. Thereafter, differences among six independent groups for each variable within the NHpC, PVN, APit, and plasma concentration were analyzed separately using one-way analysis of variance (ANOVA). An F- value and degrees of freedom for each structure (NHpC, PVN, and APit) and CORT concentration were provided. Comparisons for all pairs using Tukey’s Kramer HSD test were used to evaluate plasma CORT concentration, changes in protein levels, and relative changes of gene expression between the control (0 m sampling group) and each immobilized time group. Data are presented as the mean ± SEM. A probability level of p < 0.05 was considered statistically significant.
3. Results
3.1. Specificity of the CRHR1 antiserum using Western blot analysis
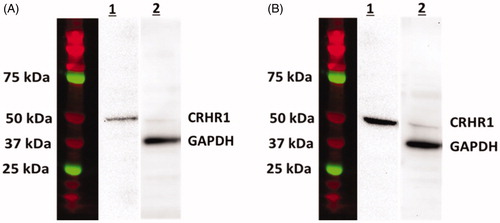
Using the Western blot technique, the custom-made antibody displayed a single band located close to 50 kDa of the molecular ladder in protein extracted from the NHpC from frozen slices of chick brain (). The molecular weight of the chicken (c) CRHR1 was calculated to be 49 kDa. When the cCRHR1 was pre-absorbed for 3 h with 5 μg of the peptide used to generate the antibody, results are seen in lane A1 (). When the peptide concentration was reduced to 2.5 μg a much more robust band was observed in lane B1 (). Hence the density of the band was increased as the concentration of the peptide decreased. Additionally, to verify that a similar amount of protein (60 μg) was loaded on both membranes, each membrane was stripped and re-blotted with the reference protein (GAPDH). Note that a similar band density occurred in the position of 37 kDa, equivalent to the molecular weight of cGAPDH (lanes A2 and B2, ). Data suggest that the cCRHR1 antibody is specific for the ligand cCRHR1.
Figure 1. Specificity of the CRHR1 antiserum using Western blot analysis. A1, B1: The antiserum shows a single band around 49 kDa, as determined by molecular weight markers (colored lanes), in extracts from the NHpC. The antibody at 1:5,000 dilution was pre-absorbed with 5 µg (lane A1) or 2.5 µg (lane B1) of immunogenic peptide prior to application in a Western blot. The density of the band was increased as the concentration of peptide decreased. GAPDH was the reference protein.
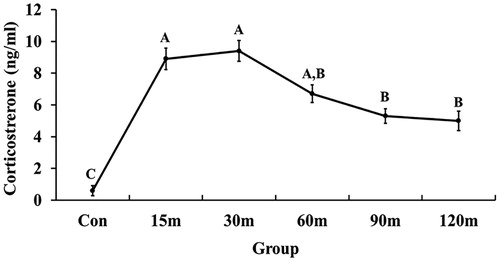
3.2. Immobilization induced CORT increases in blood plasma
During immobilization, there was a robust and rapid increase of CORT concentration in the blood plasma (). Specifically, the first significant increase of CORT concentration was observed at 15 m (p < 0.001) and peaked at 30 m (p < 0.001). Thereafter, CORT level declined at 60 m compared with 15 m and 30 m, although it remained significantly higher than controls until the end of all treatments. The overall significance of the change in CORT concentration between immobilized groups compared to the control group was [F (5, 47) = 14.48, p < 0.001].
Figure 2. Changes in plasma corticosterone concentration in response to different times of immobilization stress. The values are shown as mean ± SEM. Significant differences (p < 0.05) among the treatment groups were indicated by different letters above each time point.
3.3. Gene expression in the NHpC and PVN during immobilization stress
3.3.1. CRH, CRHR1, and CRHR2
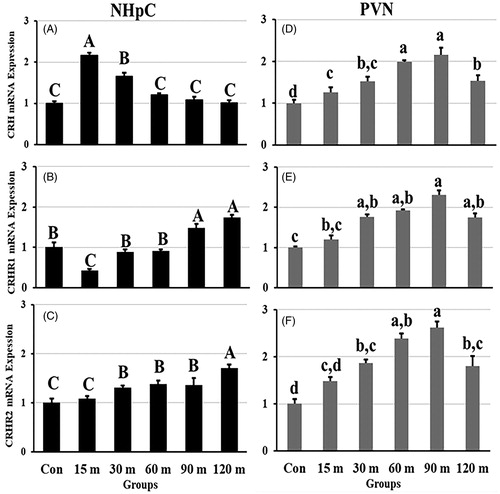
The overall gene expression data for CRH showed significant differences among treatment groups compared with controls [F (5, 48) = 34.18, p < 0.001 in the NHpC; F (5, 48) = 21.08, p < 0.001 in the PVN]. In the NHpC, CRH mRNA levels increased rapidly and significantly at 15 m of stress initiation by over 100% of the control value and remained significantly higher at 30 m of restraint stress. Thereafter, at 60 m, 90 m, and 120 m of immobilization, CRH gene expression returned to control levels (). In contrast, gene expression of CRH in the PVN displayed a gradual upregulation by less than 30% at 15 m. A peak level of mRNA occurred at 90 m of immobilization stress followed by more than a 50% decline by 120 m, although it remained significantly higher than controls (). In terms of receptors, gene expression of CRHR1 compared to CRHR2 within the NHpC demonstrated different patterns and showed a significant treatment effect [F (5, 48) = 30.17, p < 0.001 for CRHR1 and F (5, 48) = 28.88, p < 0.001 for CRHR2]. Specifically, CRHR1 mRNA expression in the NHpC showed a significant downregulation at 15 m of immobilization stress, followed by a rapid recovery to basal, control levels at 30 m and 60 m, and then significant increases at 90 m and 120 m of stress (). In contrast, CRHR2 mRNA expression in the NHpC did not change in the 15 m period of stress. Thereafter, the first significant upregulation was seen at 30 m and persisted at that level of expression through 90 m with a second upregulation at 120 m of treatments (). Similarly, in the PVN, mRNA expression of CRHR1 and CRHR2 was upregulated significantly matching the increase of their ligand, CRH [F (5, 48) = 39.37, p < 0.001 for CRHR1 and F (5, 48) = 48.10, p < 0.001 for CRHR2]. Of interest, CRHR1 and CRHR2 mRNA were first significantly increased at 30 m of immobilization stress, peaked at 90 m, then decreased at 120 m, however, remained significantly higher than controls ().
Figure 3. Effects of immobilization stress on relative mRNA expression levels of CRH (A), CRHR1 (B), and CRHR2 (C), in the NHpC and CRH (D), CRHR1 (E), and CRHR2 (F) in the PVN. Fold changes of relative expression levels were found using 2−ΔΔCt method after normalization with internal controls (GAPDH or β-actin). Means ± SEM were determined for each gene. Significant differences (p < 0.05) among groups were specified by different letters above each bar or histogram.
3.3.2. AVT and V1aR
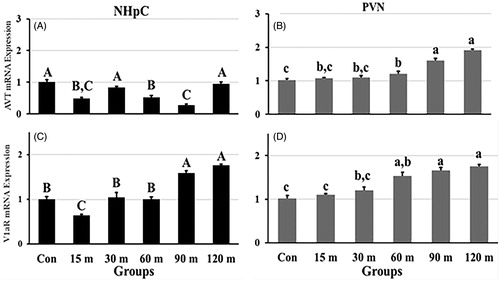
Different patterns of AVT mRNA expression occurred over treatment times [F (5, 48) = 18.38, p < 0.001 in the NHpC; F (5, 48) = 32.37, p < 0.001 in the PVN]. Specifically, AVT mRNA levels in the NHpC decreased significantly throughout the stress period (). In contrast, AVT mRNA expression in the PVN displayed no significant change until 60 m of immobilization. At 60, 90, and 120 m, there occurred a consistent, step up in gene expression that peaked at the end of the stress treatments (). In the NHpC, an initial, significant decrease of V1aR gene expression was similar to the AVT response. Thereafter, however, its gene expression significantly increased from the low level at 15 m and displayed its peak gene expression at 120 m. In contrast, within the PVN, gene expression of the V1aR matched nearly perfectly expression of AVT throughout sampling periods (). The V1aR gene expression displayed an overall significant effect among treatment groups [F (5, 48) = 13.72, p < 0.01 in the NHpC and F (5, 48) =16.51, p < 0.01 in the PVN].
Figure 4. Fold changes in the relative gene expression of AVT (A) and its major receptor, V1aR (C), in the NHpC, and AVT (B) and V1aR (D) in the PVN during immobilization stress were found using 2−ΔΔCt method after normalization with GAPDH or β-actin. Means ± SEM were determined for each gene. Significant differences (p < 0.05) among groups were specified by different letters above each bar.
3.3.3. BDNF and GR
Gene expression of BDNF in the NHpC and PVN showed significant differences among groups [F (5, 48) = 11.38, p < 0.01 in the NHpC; F (5, 48) = 17.17, p < 0.01 in the PVN]. BDNF mRNA levels in the NHpC decreased at 15 m, recovered to the basal level from 30 m to 90 m, then increased significantly at 120 m of immobilization (). In contrast, relative mRNA expression of BDNF in the PVN was upregulated significantly at 15 m of stress initiation, remained at that elevated plateau until the end of the sampling period (120 m). Notably, matching between CRHR1 and BDNF mRNA expression within the NHpC also occurred in the PVN (). Specifically, downregulation of CRHR1 mRNA in the NHpC () was associated with downregulation of BDNF gene expression (), while upregulation of BDNF in the PVN () was accompanied with upregulation of CRHR1() and CRH () followed by upregulation of AVT () and V1aR ().
Figure 5. Effects of immobilization stress on the relative gene expression of (A) BDNF and (C) GR in the NHpC, and (B) BDNF and (D) GR in the PVN. The 2−ΔΔCt method was used to find fold changes of relative expression levels after normalization with GAPDH or β-actin. Means ± SEM were determined for each gene. Significant differences (p < 0.05) among groups were specified by different letters above each bar.
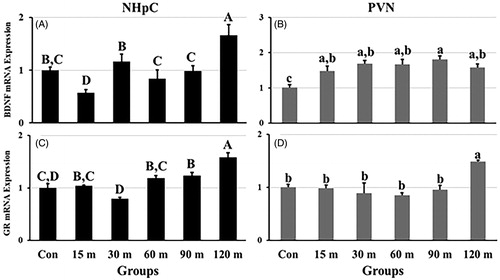
GR mRNA expression showed a delayed significant change in regulation opposite CRH mRNA in the NHpC and PVN [F (5, 48) = 15.38, p < 0.01 in the NHpC; F (5, 48) = 13.17, p < 0.01 in the PVN]. In the NHpC, the relative mRNA expression levels decreased non-significantly at 30 m followed by a recovery to basal levels at 60 m. The first significant upregulation was demonstrated at 90 m with a peak occurring at 120 m (). In the PVN, GR mRNA levels showed a slight non-significant downregulation from 15 to 90 m, then a significant upregulation of GR mRNA occurred at the end (120 m) of restraint stress ().
3.4. Gene expression in the APit
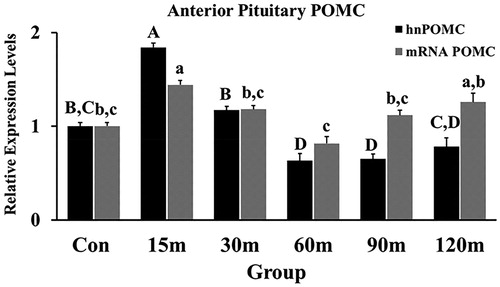
3.4.1. Heteronuclear (hn) POMC and mRNA POMC
POMC transcripts were measured in the APit as an indicator of corticotrope activation during immobilization stress. Immobilized birds showed an overall significant effect among treatment groups [F (5, 55) = 19.62, p < 0.001 for POMC mRNA; F (5, 55) =21.73, p < 0.001 for hnRNA]. POMC (hn and mRNA) relative gene expression levels upregulated significantly at 15 m of immobilization stress and hnPOMC downregulated significantly at the 30 m and 60 m while POMC mRNA downregulated at the same two sampling points (). Both the rise and fall of hn and mRNA POMC matched the significant rise and fall of CRH mRNA in the NHpC ().
Figure 6. Fold Changes of POMC transcripts (hn and mRNA) in the APit during immobilization stress were performed using the 2−ΔΔCt method after normalization with GAPDH or β-actin. Means ± SEM were determined for each gene. Significant differences (p < 0.05) among groups were specified by different letters above each bar.
3.4.2. CRHR1, CRHR2, V1aR, V1bR, and GR
Gene expression of the CRH receptors (CRHR1 and CRHR2), AVT receptors (V1aR and V1bR) and GR in the APit displayed different patterns during immobilization stress (). An overall significant effect was exhibited among treatment groups compared with controls [F (5, 55) = 23.22, p < 0.001 for CRHR1; F (5, 55) =18.13, p < 0.0001 for CRHR2]. Specifically, a significant downregulation of CRHR1 mRNA expression occurred at 60 m of immobilization and remained lower than the initial, basal level until the last sampling point (). In contrast, CRHR2 mRNA expression upregulated significantly at 15 m and continued increasing throughout the entire sampling period. Like CRHR1, AVT receptor, V1a showed down regulation with time, specifically at 30 m and 60 m (), while the V1bR, displayed a significant increase in gene expression from 15 m to 120 m (). Additionally, stressed birds exhibited an overall significant effect among treatment groups [F (5, 55) = 27.12, p < 0.01 for V1aR; F (5, 55) =20.33, p < 0. 01 for V1bR].
Figure 7. Immobilization stress effects on mRNA expression levels of CRHR1 and CRHR2 (A), V1aR and V1bR (B), and GR (C) in the APit. After normalization with GAPDH or β-actin using the 2−ΔΔCt method, fold changes of relative gene expression levels were shown. Means ± SEM were determined for each gene. Significant differences (p < 0.05) among groups were specified by different letters above each bar.
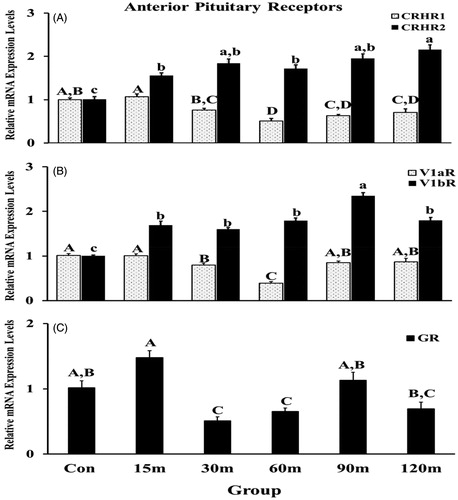
To understand the possible negative regulation via the GR at the level of the APit, a detailed time course of GR mRNA expression was documented () and showed an overall significant effect among treatment groups compared to controls (F (5, 55) = 12.22, p < 0.001). A non-significant increase in mRNA levels was shown at 15 m following stress initiation (p = 0.07), then downregulated rapidly and significantly at 30 m and 60 m. Thereafter, mRNA relative levels returned to control levels.
3.5. Western blot results
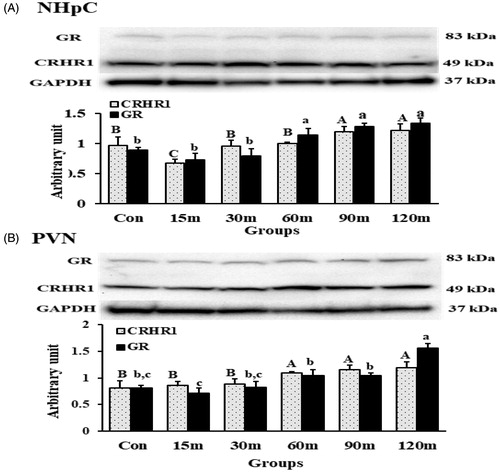
3.5.1. CRHR1 and GR protein levels in the NHpC and PVN
CRHR1 and GR proteins were detected in the NHpC and PVN extracted from birds during immobilization stress. Data showed clear bands of CRHR1 and GR located at 49 kDa and 83 kDa, respectively, in both structures (). Interestingly, CRHR1 bands were very dense in the NHpC compared with those in the PVN despite uploading less protein concentration (40 µg for the NHpC and 60 µg for the PVN) and showed different densities over the treatments (). In the NHpC, the analysis of band densities showed that CRHR1 protein levels decreased significantly at 15 m of immobilization (p < 0.01), returned to the control levels at 30 and 60 m, and increased at 90 m and 120 m (p < 0.001) matching its gene expression pattern (). In contrast, the protein levels of CRHR1 in the PVN never decreased through all treatment groups compared with controls. Specifically, the first significant increase of CRHR1 protein was observed at 60 m (p < 0.01) that persisted to the last treatment. Importantly, CRHR1 mRNA upregulation in the PVN () preceded the protein content increase (). The overall significant difference for CRHR1 groups was [F (5, 30) = 11.26 p < 0. 01 in the NHpC; F (5, 30) = 9.13, p < 0.01 in the PVN]. The GR protein levels in the NHpC increased significantly at 60 m (p < 0.001) through 120 m of restraint (). Gene expression and protein levels of GRs in the NHpC () followed the same pattern. In the PVN, the significant increase in protein levels occurred only at 120 m (p < 0.001) matching its GR gene expression (). The overall significance for the GR among all treated groups was [F (5, 30) = 8.76 p < 0. 01 in the NHpC; F (5, 30) = 12.43, p < 0.01 in the PVN].
Figure 8. CRHR1 and GR detection and quantification using Western blot in the NHpC (A) and PVN (B) during immobilization stress (Control-120m). The density of bands was quantified using the alpha view SA program. Mean ± SEM changes in protein quantity between stressed birds compared to controls were determined. Significant differences (p < 0.05) among groups were specified by different letters above each bar.
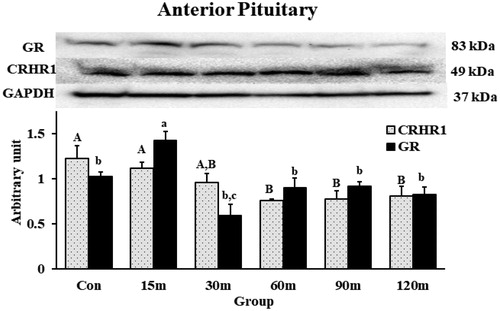
3.5.2. CRHR1 and GR protein levels in the APit
CRHR1 and GR protein levels were quantified in the APit and detected at the 49 kDa and 83 kDa positions, respectively, matching the molecular mass of both receptors in Gallus gallus (). The CRHR1 protein levels decreased significantly at 60 m and remained at that level through 120 m matching the downregulation of its gene expression in the same tissue (). In contrast, GR in the APit showed increased protein levels at 15 m of stress followed by a decrease to basal levels until the last sampling period.
Figure 9. Western blot quantification of CRHR1 and GR in the APit during immobilization stress (Control-120m). The density of bands was analyzed using alpha view SA program. Mean ± SEM changes in protein quantity between stressed birds compared to controls were determined. Significant differences (p < 0.05) among groups were specified by different letters above each bar.
4. Discussion
4.1. CRH neurons in the NHpC may play a role in initiating a neuroendocrine stress response involving the APit and CORT release
Our initial experiments examined the role of the NHpC in the neuroendocrine stress response and utilized food deprivation (FD) as the stressor. Results showed that the first significant increase in CRH gene expression occurred in the NHpC at 2 h of FD followed by CRH mRNA in the PVN at 4 h (Nagarajan et al., Citation2017b). A second study using FD stress confirmed that at 2 h, the NHpC showed nearly a 2-fold increase from controls in mRNA transcripts compared to CRH activation in the PVN. Additionally, peak CRH mRNA expression in the NHpC at 2 h matched the peak response for POMC transcripts in the APit as well as the first significant increase in plasma CORT (Kadhim et al., Citation2019). However, the stressor, FD, may not be the optimal stressor to use as it does not provide an accurate initiation time of stress in subjects. We therefore selected immobilization to examine in the current study as it provides a clear start of the stress stimulus and would be a good test to determine if the pattern of stress responsive genes would match our past results utilizing the stressor FD. Results showed that CRH mRNA expression in both the NHpC and PVN displayed significant upregulation at the first sampling point of 15 m following immobilization stress. Nonetheless, data again suggest that the NHpC may be playing a role in the early activation of the avian neuroendocrine stress response for the following reasons. Gene expression for CRH increased more than 100% from controls in the NHpC, more than 3X that documented for the increase in the PVN, at the same 15 m sampling point. In contrast, CRH mRNA in the PVN increased gradually and did not peak until 90 m. Notably, both APit hnPOMC and POMC mRNA likewise peaked at 15 m and CORT concentrations peaked at 15 m and 30 m suggesting that CRH activation in the NHpC contributed to that HPA hormone response.
A recent study from our lab targeted the NHpC with electrolytic lesions (LES) to inactivate CRH neurons within that structure. A LES group and sham-operated controls (sCON) were subjected to FD and sampled at 2 h, the time point when peak CRH mRNA occurred in the NHpC in past experiments. The LES group showed significant downregulation of CRH and CRHR1 in the NHpC, significant downregulation of POMC mRNA in the APit and significantly lower plasma CORT (Kidd et al., Citation2019). These data are our first direct link between the NHpC and the APit. Nonetheless, tract tracing studies are necessary to determine if the NHpC projects to the median eminence. More structural evidence within the NHpC is needed. Specifically, utilizing in situ hybridization histochemistry, probes directed against a unique sequence of the avian CRH gene, and an intronic sequence of the CRH gene to obtain CRH hnRNA data are recommended. Additionally, use of metyrapone that blocks CORT synthesis provide other approaches to test whether the NHpC serves to initiate the HPA axis (Herman et al., Citation1992). A subsequent study, inactivating the avian PVN prior to an imposed stressor, would also help validate the proposed role of the NHpC operating within the avian HPA axis.
We did not determine ACTH in plasma samples as we anticipated determining both hnPOMC and mRNA POMC would show an earlier peak of hnPOMC. However, both POMC assays showed a single, peak at 15 m (). In reviewing the mammalian literature, a pulse of ACTH can be released in minutes following restraint stress (Herman et al., Citation2016). Hence, incorporating sampling points prior to 15 m and assaying for ACTH in future experiments could provide data whether birds likewise show this response indicating that corticotropes within the APit have stores of ACTH within vesicles ready for release responsible for the early rise in plasma CORT.
4.2. Comparison of changes in gene expression of CRH and CRHR1 between the PVN and NHpC, possible role of BDNF in positive and negative feedback, respectively
In the PVN, CRH (), CRHR1 () and BDNF mRNA () levels were significantly elevated displaying a positive correlation in gene expression throughout the entire stress period. Importantly, BDNF within the PVN showed a significant increase in gene expression that preceded the significant increase of CRH and CRHR1 mRNA levels. In mammals, both acute and repeated immobilization stress increased BDNF mRNA by in situ hybridization in the PVN, lateral hypothalamus and APit (Smith et al., Citation1995a). Quantitative analysis of BDNF mRNA in hypothalamic tissue of rats subjected to immobilization showed rapid increases within 30 m (Tapia-Arancibia et al., Citation2004). Other studies in rats have shown rapid, significant increase in hypothalamic BDNF mRNA, release of ACTH and CORT all occurring at 15 m following immobilization with a peak increase in CORT occurring at 30 m. A follow up experiment injected BDNF intracerebroventricularly, showed a significant increase in ACTH and plasma CORT within 30 m and thereafter increased CRH mRNA; however, the first significant increase of the latter did not occur until 180 m when quantified by in situ hybridization. The authors suggested that BDNF may play two roles, one is that BDNF could be released from the median eminence after immobilization stress explaining its rapid involvement in the release of ACTH and CORT. A second, sustained role may be activating CRH mRNA within the PVN documented at 180 m and beyond (Givalois et al., Citation2004).
In marked contrast to the positive correlation shown between CRH and CRHR1 within the PVN (), a negative correlation between the same two genes occurred within the NHpC (). At the peak height of CRH at 15 m, BDNF, similar to CRHR1, showed a significant decline () and thereafter BDNF gene expression followed that of CRHR1. In mammalian studies, it has been shown that immobilization stress decreases BDNF mRNA levels in extrahypothalamic areas such as the hippocampus (Smith et al., Citation1995b), claustrum, basolateral amygdala, and cingulate cortex, in marked contrast to the hypothalamus and anterior pituitary, suggesting the possibility that BDNF could have a local paracrine or autocrine function in the hypothalamus (Smith et al., Citation1995a, Citation1995b). Similarly, an avian extrahypothalamic structure, the NHpC, displayed a marked decline in BDNF at the peak of CRH mRNA. Results suggest that like mammals, an avian species has an extrahypothalamic area showing a negative feedback response to stress between CRH and CRHR1, an opposite result of the same two genes displaying a positive feedback in the avian hypothalamic PVN.
The matching of CRHR1 and BDNF gene expression in two different populations of CRH neurons (PVN and NHpC) suggests an important, direct functional relationship between CRHR1 and BDNF within each structure. Clearly the distribution of BDNF and CRHR1 within cells of the PVN and NHpC needs to be determined as well as the family of tyrosine receptor kinases (Trks), previously shown to play a possible role for BDNF serving a local paracrine or autocrine function in the mammalian hypothalamic PVN (Smith et al., Citation1995a) and avian hypothalamic PVN and subpallial NHpC as well.
4.3. Differential regulation of CRH and AVT receptors in the APit downregulates POMC transcripts but sustains CORT release
At the PVN level, a positive feedback in gene expression was observed between CRH and CRHR1 and between AVT and V1aR. Therefore, one would expect a continued increase in CORT levels beyond its peak level at the 30 m sampling time (). However, it did not occur. A downregulation of POMC could modulate that robust, increased gene expression from CRH and AVT neurons in the PVN. Five receptors related to stress and located in the APit were examined: CRHR1, CRHR2, V1aR, V1bR and GR. CRHR1, the major stress receptor of CRH, showed significant downregulation of its mRNA and protein levels (, 9) following immobilization stress supporting previous findings in birds (Løtvedt et al., Citation2017). A possible mechanism for CRHR1 reduction was reported in rats during restraint stress. Specifically, Nemoto et al. (Citation2013) identified microRNA that clearly played a role in glucocorticoid regulation of CRHR1 in corticotropes. The second APit receptor showing continued downregulation was the V1aR (). The receptor is located on avian corticotropes (Selvam et al., Citation2013), and its downregulation has been reported in both acute and chronic stress (Kang & Kuenzel, Citation2014). The consistent downregulation of the CRHR1 and V1aR clearly played a dominant role in repressing CORT production. However, two receptors, CRHR2 and V1bR, in the APit were displaying a significant increase in gene expression. The CRHR2 occurs solely on thyrotropes in birds (De Groef et al., Citation2003); hence, it functions as part of the hypothalamic-pituitary-thyroid (HPT) axis, and therefore does not directly activate POMC transcripts nor glucocorticoid production. The fourth receptor, V1bR, appears to be a critical one as it is the only corticotrope receptor that is significantly elevated throughout the stress study (); therefore, it could function to maintain the avian stress response. Hence, V1bR activation and resistance to the negative feedback of CORT compensate for the downregulation of CRHR1 and V1aR () enabling the stress response to persist as evidenced by maintaining elevated CORT levels. Consistent with our data, mammalian data showed that V1bR mRNA levels are stimulated by glucocorticoids, which may contribute to the refractoriness of AVP-stimulated ACTH secretion to glucocorticoid feedback (Rabadan-Diehl & Aguilera, Citation1998). The last receptor examined in the APit was GR regarding its role in mediating the negative feedback of CORT (). The well-known mechanism involving GR binding to a negative glucocorticoid response element (nGRE) in the POMC gene mediates glucocorticoid-dependent repression of POMC transcription (Drouin et al., Citation1989, Citation1993). The significant decline of GR response suggests that its reduction will complement the activation of the V1bR to maintain sufficient output of POMC expression. Immobilization stress as well as its initial high CORT concentration impacted GR mRNA levels and its protein contents similar to in vitro studies in which glucocorticoid agonists repressed GR transcription initiation in a dose dependent manner (Ramamoorthy & Cidlowski, Citation2013; Shimojo et al., Citation1995).
In summary, we propose that CRH neurons within the NHpC may play a role initiating the avian neuroendocrine stress response involving the APit and CORT release. Second, two distinct groups of CRH neurons residing in the NHpC and PVN, respectively, display a negative and positive feedback between CRH and its major receptor, CRHR1, possibly due to gene expression of BDNF within each structure. Third, five receptors were examined within the APit and only one, the V1bR, displayed consistent, increased gene expression throughout the stress period affecting POMC. The V1bR appears to be the major receptor sustaining POMC expression and therefore continued production of the avian stress hormone, CORT throughout immobilization stress.
Author contributions
HJK, SWK and WJK conceived the study. HJK performed the study and analyzed the data. HJK and WJK wrote the first and second drafts of the manuscript. All authors contributed to revision of the manuscript.
Acknowledgments
The authors wish to dedicate this paper in the memory of Hakeem’s father, (Mr. Jawad Kadhim), who passed away on October 28, 2020 in the city of Thi-Qar, Iraq from Covid-19.
Disclosure statement
The authors declare no conflict of interest.
Additional information
Funding
References
- Bath, K. G., Schilit, A., & Lee, F. S. (2013). Stress effects on BDNF expression: effects of age, sex, and form of stress. Neuroscience, 239, 149–156. https://doi.org/10.1016/j.neuroscience.2013.01.074
- Blendy, J. A. (2006). The role of CREB in depression and antidepressant treatment. Biological Psychiatry, 59(12), 1144–1150. https://doi.org/10.1016/j.biopsych.2005.11.003
- Bonfiglio, J. J., Inda, C., Refojo, D., Holsboer, F., Arzt, E., & Silberstein, S. (2011). The corticotropin-releasing hormone network and the hypothalamic-pituitary-adrenal axis: molecular and cellular mechanisms involved. Neuroendocrinology, 94(1), 12–20. https://doi.org/10.1159/000328226
- Chrousos, G. P. (2009). Stress and disorders of the stress system. Nature Reviews Endocrinology, 5(7), 374–381. https://doi.org/10.1038/nrendo.2009.106
- De Groef, B., Goris, N., Arckens, L., KüHn, E. R., & Darras, V. M. (2003). Corticotropin-releasing hormone (CRH)-induced thyrotropin release is directly mediated through CRH receptor type 2 on thyrotropes. Endocrinology, 144(12), 5537–5544. https://doi.org/10.1210/en.2003-0526
- Drouin, J., Sun, Y. L., Chamberland, M., Gauthier, Y., De Lean, A., Nemer, M., & Schmidt, T. J. (1993). Novel glucocorticoid receptor complex with DNA element of the hormone repressed POMC gene. The EMBO Journal, 12(1), 145–156. https://doi.org/10.1002/j.1460-2075.1993.tb05640.x
- Drouin, J., Trifiro, M. A., Plante, R. K., Nemer, M., Eriksson, P., & Wrange, O. (1989). Glucocorticoid receptor binding to a specific DNA sequence is required for hormone-dependent repression of pro-opiomelanocortin gene transcription. Molecular and Cellular Biology, 9(12), 5305–5314. https://doi.org/10.1128/MCB.9.12.5305
- Givalois, L., Naert, G., Rage, F., Ixart, G., Arancibia, S., & Tapia-Arancibia, L. (2004). A single brain-derived neurotrophic factor injection modifies hypothalamo-pituitary-adreno- cortical axis activity in adult male rats. Molecular and Cellular Neuroscience, 27(3), 280–295. https://doi.org/10.1016/j.mcn.2004.07.002
- Herman, J., McKlveen, J., Ghosal, S., Kopp, B., Wulsin, A., Makinson, R., Scheimann, J., & Myers, B. (2016). Regulation of the hypothalamic-pituitary adrenocortical stress response. Comprehensive Physiology, 6, 603–621.
- Herman, J. P., Schafer, M. K.-H., Thompson, R. C., & Watson, S. J. (1992). Rapid regulation of corticotropin-releasing hormone gene transcription in vivo. Molecular Endocrinology, 6, 1061–1069.
- Jeanneteau, F., Lambert, W., Ismaili, N., Bath, K., Lee, F., Garabedian, M., Moses, V., & Chaoa, M. (2012). BDNF and glucocorticoids regulate corticotrophin releasing hormone (CRH) homeostasis in the hypothalamus. Proceedings of the National Academy of Sciences of the United States of America, 109(4), 1305–1310. https://doi.org/10.1073/pnas.1114122109
- Kadhim, H. J., Kang, S. W., & Kuenzel, W. J. (2019). Differential and temporal expression of corticotropin releasing hormone and its receptors in the nucleus of the hippocampal commissure and paraventricular nucleus during the stress response in chickens (Gallus gallus). Brain Research, 1714, 1–7. https://doi.org/10.1016/j.brainres.2019.02.018
- Kadhim, H. J., Kidd, M. T., Jr., Kang, S. W., & Kuenzel, W. J. (2020). Differential delayed responses of arginine vasotocin and its receptors in septo-hypothalamic brain structures and anterior pituitary that sustain hypothalamic–pituitary-adrenal (HPA) axis functions during acute stress. General and Comparative Endocrinology, 286, 113302. https://doi.org/10.1016/j.ygcen.2019.113302
- Kang, S. W., & Kuenzel, W. J. (2014). Regulation of gene expression of vasotocin and cortico- tropin-releasing hormone receptors in the avian anterior pituitary by corticosterone. General and Comparative Endocrinology, 204, 25–32. https://doi.org/10.1016/j.ygcen.2014.04.018
- Keller-Wood, M. (2015). Hypothalamic-pituitary-adrenal axis-feedback control. Comprehensive Physiology, 5(3), 1161–1182.
- Kidd, M. T., Jr., Kadhim, H. J., Kang, S. W., & Kuenzel, W. J. (2019). Surgical disruption of corticotropin releasing hormone neurons in the nucleus of the hippocampal commissure reduces HJPA axis activity in birds. No. 767.05. Neuroscience Meeting Planner. Chicago, ILL: Soc. Neuroscience. Online.
- Kuenzel, W. J., & Jurkevich, A. (2010). Molecular neuroendocrine events during stress in poultry. Poultry Science, 89(4), 832–840. https://doi.org/10.3382/ps.2009-00376
- Kuenzel, W. J., & Masson, M. (1988). A Stereotaxic Atlas of the Brain of Chick (Gallus domesticus). Johns Hopkins University Press.
- Løtvedt, P., Fallahshahroudi, A., Bektic, L., Altimiras, J., & Jensen, P. (2017). Chicken domestication changes expression of stress-related genes in brain, pituitary and adrenals. Neurobiology of Stress, 7, 113–121. https://doi.org/10.1016/j.ynstr.2017.08.002
- Madison, F. N., Jurkevich, A., & Kuenzel, W. J. (2008). Sex differences in plasma corticosterone release in undisturbed chickens (Gallus gallus) in response to arginine vasotocin and corticotropin releasing hormone. General and Comparative Endocrinology, 155(3), 566–573. https://doi.org/10.1016/j.ygcen.2007.08.014
- McEwen, B. S. (2007). Physiology and neurobiology of stress and adaptation: central role of the brain. Physiological Reviews, 87(3), 873–904. https://doi.org/10.1152/physrev.00041.2006
- Nagarajan, G., Jurkevich, A., Kang, S., & Kuenzel, W. (2017a). Anatomical and functional implications of corticotrophin releasing hormone neurons in a septal nucleus of the avian brain: an emphasis on glial-neuronal interaction via V1a receptors in vitro. Journal of Neuroendocrinology, 29, 1–11.
- Nagarajan, G., Kang, S., & Kuenzel, W. (2017b). Functional evidence that the nucleus of the hippocampal commissure shows an earlier activation from a stressor than the paraventricular nucleus: Implication of an additional structural component of the avian hypothalamo-pituitary-adrenal axis. Neuroscience Letters, 642, 14–19. https://doi.org/10.1016/j.neulet.2017.01.064
- Nagarajan, G., Tessaro, B. A., Kang, S. W., & Kuenzel, W. J. (2014). Identification of arginine vasotocin (AVT) neurons activated by acute and chronic restraint stress in the avian septum and anterior diencephalon. General and Comparative Endocrinology, 202, 59–68. https://doi.org/10.1016/j.ygcen.2014.04.012
- Nemoto, T., Mano, A., & Shibasaki, T. (2013). MiR-449a contributes to glucocorticoid-induced CRF-R1 downregulation in the pituitary during stress. Molecular Endocrinology, 27(10), 1593–1602. https://doi.org/10.1210/me.2012-1357
- Palkovits, M. (1973). Isolated removal of hypothalamic or other brain nuclei of the rat. Brain Research, 59, 449–450. https://doi.org/10.1016/0006-8993(73)90290-4
- Proudman, J. A., & Opel, H. (1989). Daily Changes in plasma prolactin, corticosterone, and luteinizing hormone in the unrestrained, ovariectomized turkey hen. Poultry Science, 68(1), 177–184. https://doi.org/10.3382/ps.0680177
- Rabadan-Diehl, C., & Aguilera, G. (1998). Glucocorticoids increase vasopressin V1b receptor coupling to phospholipase C. Endocrinology, 139(7), 3220–3226. https://doi.org/10.1210/endo.139.7.6121
- Ramamoorthy, S., & Cidlowski, J. A. (2013). Ligand-induced repression of the glucocorticoid receptor gene is mediated by an NCoR1 repression complex formed by long-range chromatin interactions with intragenic glucocorticoid response elements. Molecular and Cellular Biology, 33(9), 1711–1722. https://doi.org/10.1128/MCB.01151-12
- Romero, L. M. (2004). Physiological stress in ecology: Lessons from biomedical research. Trends in Ecology & Evolution., 19(5), 249–255. https://doi.org/10.1016/j.tree.2004.03.008
- Schmittgen, T. D., & Livak, K. J. (2008). Analyzing real-time PCR data by the comparative CT Method. Nature Protocols, 3(6), 1101–1108. https://doi.org/10.1038/nprot.2008.73
- Selvam, R., Jurkevich, A., Kang, S. W., Mikhailova, M. V., Cornett, L. E., & Kuenzel, W. J. (2013). Distribution of the vasotocin subtype four receptor (VT4R) in the anterior pituitary gland of the chicken, Gallus gallus, and its possible role in the avian stress response. Journal of Neuroendocrinology, 25(1), 56–66. https://doi.org/10.1111/j.1365-2826.2012.02370.x
- Shimojo, M., Hiroi, N., Yakushiji, F., Ueshiba, H., Yamaguchi, N., & Miyachi, Y. (1995). Differences in downregulation of glucocorticoid receptor mRNA by cortisol prednisolone and dexamethasone in Hela cells. Endocrine Journal, 42(5), 629–636. https://doi.org/10.1507/endocrj.42.629
- Smith, M. A., Makino, S., Kim, S.-Y., & Kvetnansky, R. (1995a). Stress increases brain-derived neurotropic factor messenger ribonucleic acid in the hypothalamus and pituitary. Endocrinology, 136(9), 3743–3750. https://doi.org/10.1210/endo.136.9.7649080
- Smith, M. A., Makino, S., Kvetnansky, R., & Post, R. M. (1995b). Stress and glucocorticoids affect the expression of brain-derived neurotrophic factor and neurotrophin-3 mRNAs in the hippocampus. The Journal of Neuroscience, 15(3), 1768–1777. https://doi.org/10.1523/JNEUROSCI.15-03-01768.1995
- Tapia-Arancibia, L., Rage, F., Givalois, L., & Arancibia, S. (2004). Physiology of BDNF: focus on hypothalamic function. Front. Neuroendocrinol, 25, 77–107. https://doi.org/10.1016/j.yfrne.2004.04.001
- Tardito, D., Perez, J., Tiraboschi, E., Musazzi, L., Racagni, G., & Popoli, M. (2006). Signaling pathways regulating gene expression, neuroplasticity, and neurotrophic mechanisms in the action of antidepressants: a critical overview. Pharmacological Reviews, 58(1), 115–134. https://doi.org/10.1124/pr.58.1.7
- Vandenborne, K., De Groef, B., Geelissen, S. M. E., KüHn, E. R., Darras, V. M., & Van der Geyten, S. (2005). Corticosterone-induced negative feedback mechanisms within the hypothalamic pituitary adrenal axis of the chicken. Journal of Endocrinology, 185(3), 383–391. https://doi.org/10.1677/joe.1.05969
- Xie, J., Kuenzel, W., Anthony, N., & Jurkevich, A. (2010). Subpallial and hypothalamic areas activated following sexual and agonistic encounters in male chickens. Physiology & Behavior, 101(3), 344–359. https://doi.org/10.1016/j.physbeh.2010.06.004