
Abstract
Arousing research has investigated stressed individuals’ decision biases, but whether and how stress and individual traits interact to impact the underlying decision-making process is unknown. Here, we aim to explore the effect of acute stress on the interaction between the objective level of risk and subjective risk preference (i.e. risk-taking propensity). Eighty-three healthy males participated in the study. We adopted the Trier Social Stress Test (TSST) to induce acute psychological stress and categorized participants into the high or low risk-taking propensity (HRP/LRP) group according to their traits in daily life. The Balloon Analogue Risk Task (BART) was applied to measure their feedback processing in a risky decision task, while behavioral indexes and EEG signals were recorded. The results showed that stressful participants pumped fewer times than the controls, especially for the LRP under stress, indicating that they were more willing to avoid taking risks. Compared with the stressed HRP group, the stressed LRP showed higher salivary cortisol responses and a more positive FRN following positive feedback in higher risk levels. It implies that acute psychological stress leads the LRP to overestimate the risk probability and become more cautious in the sequential processing of risk. These findings highlight the role of the feedback process and individual traits in risky decision-making under stress.
1. Introduction
The term “stress” describes physiological and psychological forces and pressures induced by challenging or threatening events or environments (i.e. stressors) (Del Giudice et al., Citation2018; Koolhaas et al., Citation2011). Both acute and chronic stress elicits biological, psychological, and behavioral reactions shaped by evolution but may lead to undesired consequences (Juster et al., Citation2010; Sousa & Almeida, Citation2012). Among those higher-order cognitive functions that are sensitive to stress induction, the current study focuses on decision-making. Investigating stressed individuals’ decision biases could help us understand why stress may induce various maladaptive behaviors, such as gambling (Wemm & Wulfert, Citation2017), drinking, and smoking (McEwen, Citation2008).
It has been widely acknowledged that decision-making varies according to individual stress levels (e.g. Porcelli & Delgado, Citation2009; von Dawans et al., Citation2012). Generally, a large body of studies suggests that individuals make more disadvantageous decisions under stress (for reviews, see Starcke & Brand, Citation2012; Starcke & Brand, Citation2016). According to Sokol-Hessner et al. (Citation2016), acute stress does not affect risk attitudes, loss aversion, or choice consistency. In light of the literature (e.g. Joels et al., Citation2006), we suggested highlighting the importance of feedback processing to address how acute stress shapes our choices. This possibility has been implicated in behavioral studies using the Iowa Gambling Task (IGT), which required decision-makers to learn an optimal strategy through trial-and-error (for details, see Bechara et al., Citation2005). Researchers have found stressed participants (especially males) showed more deficient explicit knowledge and weaker performance in the IGT, indicating the deficits in feedback learning (Preston et al., Citation2007; van den Bos et al., Citation2009; Wemm & Wulfert, Citation2017). Starcke et al. (Citation2008) also pointed out that individuals under stress made more disadvantageous decisions even when explicit feedback about the winning rule was provided (see also Lighthall et al., Citation2013).
Seeing that stress has a broad impact on brain structures and functions (Cousijn et al., Citation2010; McEwen & Gianaros, Citation2011; Pani et al., Citation2000) and that the neural underpinning of stress largely overlaps with that of decision-making (Ossewaarde et al., Citation2011; Starcke & Brand, Citation2016), it would be beneficial to investigate the relationship between stress and decision-making from the perspective of neuroscience (Dias-Ferreira et al., Citation2009; Maier et al., Citation2015). This study relied on the event-related potential (ERP) technique since its exquisite temporal resolution allows researchers to focus on the feedback stage of decision-making (e.g. Gu et al., Citation2018). According to previous electrophysiological studies on feedback processing (see San Martín, Citation2012 for a review), we were most interested in three ERP indexes, including the P2, feedback-related negativity (FRN), and P3 components. The P2 is associated with stimulus evaluation. Researchers found that the P2 amplitude is larger at higher levels of unpredictability and risk in the decision-making tasks (Kiat et al., Citation2016; Polezzi et al., Citation2008; Schuermann et al., Citation2012). And then, the FRN reflects an early detection process of feedback valence, reward magnitude and reward likelihood. It is more negative-going for negative (e.g. monetary losses) than for positive feedback (Gehring & Willoughby, Citation2002; Miltner et al., Citation1997), for low than for high magnitude, and for likely than unlikely reward (Sambrook, 2015). Traditional theories have interpreted the FRN as a negative prediction error, whether the actual feedback is worse than prior expectation (Holroyd et al., Citation2006; Holroyd & Coles, Citation2002). However, some researchers argued that the FRN becomes larger for both positive and negative prediction errors (i.e. an unsigned index; see Sambrook & Goslin, Citation2014, Citation2015; Talmi et al., Citation2013). Finally, the P3 component, following the FRN, increases as a function of the ongoing feedback’s motivational/emotional significance (Jiang et al., Citation2018; Nieuwenhuis et al., Citation2005). Euser et al. (Citation2011) observed that alcohol-intoxicated individuals showed reduced P3 amplitude in response to negative feedback compared with sober controls, while the FRN amplitude reached no difference. It evidences that alcohol diminishes a more elaborate evaluation of losses, and the FRN and P3 reflect different levels of feedback processing. Altogether, these components’ cognitive functions have important implications for feedback learning (Cohen et al., Citation2011; San Martín, Citation2012).
In the current study, we applied the classic Balloon Analogue Risk Task (BART), which is well-suited to investigate sequential risk-taking and has a high diagnosticity of maladaptive gambling (Lauriola et al., Citation2014; Lejuez et al., Citation2002). In each trial of the BART, participants need to decide whether to pump up a balloon (risk-taking) or to cash out for a certain number of rounds; pumping may result in successfully inflating that balloon (more bonus accumulated) or an explosion (all bonus cleared). In general, many behavioral studies have observed an influence of stress exposure on BART performance, but their findings are heterogeneous and might be susceptible to the individual difference (Lighthall et al., Citation2009, Citation2012; Reynolds et al., Citation2013; Wise et al., Citation2015). Meanwhile, individual risk preference in the BART could be significantly affected by feedback information (i.e. successful pump vs. balloon explosion; see Pleskac & Wershbale, Citation2014; Wallsten et al., Citation2005; Zhang & Gu, Citation2018). Previous studies have revealed that ERP components, including the P2, FRN, and P3, are sensitive to various dimensions of BART feedback, e.g. reward magnitude and risk level (Kiat et al., Citation2016; Kobor et al., Citation2015; Takács et al., Citation2015). For instance, the P2 and FRN amplitude are associated with the round number, with the more positive-going P2 and FRN at higher levels of risk and reward magnitudes (Kiat et al., Citation2016). Meanwhile, the P3 amplitude was the largest following gains just before burst, indicating a more deliberate feedback processing (Kardos et al., Citation2016). Further, the FRN and P3 amplitude may predict overall risk preference and/or trial-by-trial variance in risk-taking, which could help clarify the role of feedback processing in decision-making (Euser et al., Citation2011, Citation2013; Gu et al., Citation2018; Kardos et al., Citation2016).
Previous ERP studies have indicated feedback processing could be modulated by individual stress levels (Banis et al., Citation2014; Banis & Lorist, Citation2012; Zhang et al., Citation2020). Some researchers found blunted FRN response in the stress condition compared with the control condition, implying that feedback processing is impaired by stress induction (Banis et al., Citation2014; Banis & Lorist, Citation2012). Zhang et al. (Citation2020) observed that individuals under shock threat showed impaired performance and attenuated reward positivity, indicating stress influences the brain response to reward prediction error processing. However, these studies all induced stress by physiological methods (i.e. white noise or shock) and did not verify the effectiveness of stress induction with multiple stress indexes. Additionally, the tasks did not contain sequential decision-makings and changing levels of risk, which are characteristics of daily risk-taking. Besides, individual factors (e.g. personal traits) were not taken into consideration. So it is unclear whether and how acute stress may shape our risky choices. To our knowledge, no ERP study to date has examined the potential effect of feedback processing on the relationship between acute psychological stress and BART performance.
We asked participants to receive the Trier Social Stress Test (TSST: Het et al., Citation2009; Kirschbaum et al., Citation1993), which could cause the cortisol concentration to peak at 10–20 min after the stress task (Petrowski et al., Citation2010; Rimmele et al., Citation2009; Rohleder et al., Citation2001). Then they finished the BART with electroencephalogram (EEG) recording to collect their ERP response to task feedback. We firstly hypothesized that acute stress induced by the TSST would modulate risk preference in the BART. Stressful individuals would make more risky and disadvantageous choices, with a more mean adjusted number of pumps across trials than those in the placebo group. Secondly, we predicted the impaired decision-making would be driven by the blunted processing of feedback information (indexed by the ERP P2, FRN, and P3 components). Subsequently, we expect individual risk-taking property would vary the modulation; that is, individuals with high and low risk-taking properties would show different behaviors and feedback processing under stress.
2. Methods
2.1. General procedure
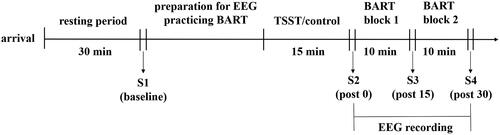
Participants were asked not to eat anything other than water and avoid exercises within two hours before the experiment. Considering the cortisol’s circadian rhythms (Dickerson & Kemeny, Citation2004), all experiments were conducted between 13:30 and 18:00. The overall process of the experiment is shown in . After arriving at the laboratory, participants were required to confirm that they did not meet any of the exclusion criteria (see above) and sign up for informed consent. Then every participant completed the gambling domain of DOSPERT-7 (DOSPERT-7, Weber et al., Citation2002) and had a rest for half an hour before the first measurement of heart rate (HR) and salivary cortisol. The stress indexes were collected under the relaxed state as the baseline data. After this measurement, they were prepared for EEG recording and practiced the BART. Then participants were randomly assigned to the stress condition or the control condition. The second/third/fourth HR and salivary cortisol measurements were conducted immediately/15/30 min after the TSST.
Figure 1. Flow chart of the experimental procedure. S1–S4 indicates the four time points of stress indexes measurements.
2.2. Participants
We conducted a priori power analysis by the G*Power 3.1.9.2 software to determine the sample size (Faul et al., Citation2007). This analysis revealed that 68 participants were required to reach a good statistical power of 0.9 (α = 0.05) to detect high-sized (f = 0.4) effects for a 2 × 2 between-subjects analysis of variance (ANOVA). To account for possible dropouts or errors during the experiment, 83 healthy male students (age range: 19–29, mean = 22.54, SD = 2.15) recruited online participated in this study. Female participants were not involved because their cortisol levels are valuable to the menstrual cycle phase and medicine use (e.g. oral contraceptives) (Kirschbaum et al., Citation1999; Kudielka & Kirschbaum, Citation2005).
The standard exclusion criteria were as followed to prevent potential confounding effects, that is, participants should have: (1) no endocrine disorders and did not take any endocrine-related drugs in the past month; (2) no mental or neurological disorders; (3) no periodontitis or oral wound; (4) no cold or allergies, not in acute episodes of chronic illness, and without any medical use within the past two weeks; (5) no excessive drinking (more than two units per day) or excessive smoking (more than five cigarettes per day); (6) no long-term anxiety, depression, insomnia, or circadian disturbance; (7) regular body mass index; (8) no experience of participating in saliva collection experiments before; (9) intact physiological vision (Kudielka et al., Citation2009; von Dawans et al., Citation2011).
Participants were randomly assigned to the stress condition (n = 43) or the control condition (n = 40). According to their debriefing after the experiment, two participants (one in the stress condition and the other in the control condition) did not understand the task instruction. Additionally, four participants in the stress condition and one in the control condition had more than three missing salivary cortisol values owing to insufficient salivary volume. Two participants in the control condition and one participant in the stress condition exceeded three standard deviations (SD) of the mean salivary cortisol value of the corresponding conditions. Altogether, these ten participants were excluded from the final sample, leaving a total of 73 participants (37 in the stress condition and 36 in the control condition).
Seeing that the gambling domain of Domain-Specific Risk-Taking Scale Across Seven Domains is conceptually associated with the Balloon Analogue Risk Task (Lejuez et al., Citation2002; Wang et al., Citation2016), our final sample was further divided according to individual score in the gambling domain of DOSPERT-7.
2.3. Stress/control procedure
The study adopted a modified version of TSST to induce acute psychosocial stress (Buchanan et al., Citation2012, Citation2014), including a preparation period, a speech period, and an arithmetic task period (each lasting for 5 min). During the latter two periods (TSST period), participants’ performance was recorded by a video camera.
In the stress condition, participants were instructed to imagine that they were accused of shoplifting and had to stand up for themselves in front of the store managers. After preparation, participants moved from preparation room A to an adjoining laboratory room B to complete the speech and an arithmetic task. Three “store managers” (one male and two females) dressing in white coats sat in room B, whom participants never met before. Their attitude remained neutral during the whole task period. First, participants gave a public speech to defend themselves and to prove their innocence. They can also recommend appropriate actions (e.g. how much compensation they want). At the end of the 5-min speech, participants were instructed to subtract the number 13 from 1022 continuously. Once they made an error, they had to restart at 1022.
Participants in the control condition received a placebo procedure (Buchanan et al., Citation2014), of which the time course and cognitive load were similar to the TSST. During the preparation period, participants were instructed to read a prosaic travel article and capsule its primary content. Then they entered room B to deliver the speech without being observed. After that, they completed an arithmetic task including addition and subtraction within 1000 on the paper in 5 min. The speech and arithmetic tasks in this procedure were not stressful as they were not associated with uncontrollability or social-evaluation threat (Het et al., Citation2009).
2.4. BART
illustrates the modified version of the BART (Fein & Chang, Citation2008), which used the same experimental materials as Gu et al. (Citation2018). Participants were seated 100 cm away from the computer screen. Before the formal BART task, there were four practice trials for participants to understand the rules, and we set pseudo-random bursting points in practice to avoid random error.
Figure 2. Balloon Analogue Risk Task settings.
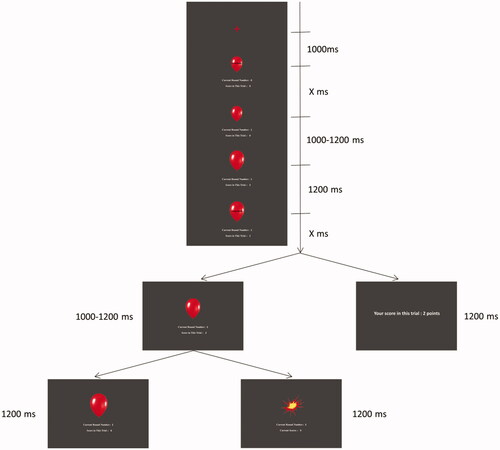
In each BART trial, a red fixation was presented for 1,000 ms, followed by a simulated red balloon (3.0° × 3.5° of visual angle) with the current round number and scores presented beneath. When the instruction words “please decide” were shown inside the balloon, participants can press the “F” or “J” key on the keyboard to inflate the balloon, or to stop the current trial and cash out the scores. The time for decision-making was unlimited, and the assignment of the two keys (pump/cash out) was counterbalanced across participants. Choosing the “pump” option resulted in the instruction words’ disappearance for a random interval between 1,000 and 1,200 ms. Each pump brought about two possible outcomes: if participants succeeded, the balloon would be enlarged by 5% of its original area, and the current round number and scores were increased; if not, an image of an exploding balloon (indicating the end of the ongoing trial) would appear, and the current scores were cleared. Here, an enlarged balloon with scores being increased was defined as positive feedback, while an exploded balloon with scores being lost was defined as negative feedback. The time of feedback presentation was 1,200 ms.
Our BART consisted of 60 trials to ensure enough epochs in each condition for ERP analysis (Cohen & Polich, Citation1997; Marco-Pallares et al., Citation2011). In the efforts to keep the experiment within a reasonable time length, we shortened the maximum breaking point to 12 rounds (see also Fein & Chang, Citation2008; Kiat et al., Citation2016). The first pump would not result in an explosion, and the probability of explosion was 1/11 for the second pump, 1/10 for the third pump, 1/9 for the fourth, and so on, until the 12th pump, where a balloon explosion was inevitable (Lejuez et al., Citation2002). Two points increased the score of each trial at each pump. The first pump added 2 points for participants, and the second successful pump added 4 points, the third successful pump 6 points, and so on. Our pilot testing has shown that the BART experiment took around 20 min to complete. Thus, we divided these trials equally into two blocks to collect the peak value of salivary cortisol in the break between blocks.
The BART’s primary behavioral measure was the mean adjusted number of pumps across trials (Lejuez et al., Citation2002). There were two sub-indexes: (1) to assess how participants modified their risky behaviors following an exploded balloon, we calculated the number of pumps in those trials immediately after a balloon exploding (Claassen et al., Citation2011; Simioni et al., Citation2012); (2) we also calculated the mean adjusted number of pumps in those trials immediately following a winning trial.
2.5. Stress indexes
To demonstrate that the TSST effectively induced stress responses, we measured individual stress levels using the following three indexes.
2.5.1. Biochemical index
The methods and parameters to collect and analyze salivary cortisol level referred to previous human stress literature (Sokol-Hessner et al., Citation2016; van den Bos et al., Citation2009; Yao et al., Citation2016). We used the salivate collection tubes (Sarstedt, Rommelsdorf, Germany) to collect saliva samples. Participants need to hold a small piece of sterile tampon in their mouth for about 1–2 min until it was completely soaked. We reserved the saliva samples at −22 °C until assayed by ECLIA (Cortisol II, Roche Diagnostics, Numbrecht, Germany). The lower sensitivity for cortisol was 1.5 nmol/L, and the detectable range was 1.5–1750 nmol/L. Intra- and inter-assay variations were below 7.1% and 12.7%, respectively.
2.5.2. Physiological index
HR was collected as a physiological index of sympathetic nervous system activation. We applied the Polar (RS800CX, Polar Electro, Finland) to collect and store real-time data, with a sensor placed on the center of the chest skin and a watch on the wrist. The pre- and post-treatment measures of HR were collected constantly over the baseline period (5 min), the TSST period (10 min), and the periods immediately/15 min/30 min following the TSST (5 min). The Polar Pro Trainer was used to import and analyze data. The HR was averaged across each measuring period and defined as the number of beats per minute (bpm).
2.5.3. Psychological index
In addition to the above indexes, we used the Positive and Negative Affect Schedule (PANAS: Watson et al., Citation1988) to assess participants’ emotional changes before and after the TSST. PANAS consists of two 10-item mood scales describing current affect, that is, the positive affect scale (PA, e.g. “excited,” “enthusiastic”) and the negative affect scale (NA, e.g. “nervous,” “upset”). Participants rated on a 5-point scale labeled from 1 point (i.e. “very slightly or not at all”) to 5 points (i.e. “very much”). We averaged the scores of the negative emotion (NA) dimension of the PANAS as an index of changes in negative emotions, seeing that perceived stress increases this kind of emotion (e.g. anxiety and anger; see Feldman et al., Citation1999).
2.6. EEG recording and analysis
EEG signals were recorded using the Scan system (Neuroscan, Herndon, VA, USA) with a 64-channel electrode cap, sampling at 1,000 Hz. The left mastoid was used as the online reference, while the right one was also recorded. During data analysis, the average of bilateral mastoids was used for re-reference. Eye movements were recorded by electrodes attached above and below the left eye (Vertical EOG) and both eyes’ outer canthi (Horizontal EOG). We kept the impedance of all electrodes below 5 kΩ.
Data were processed offline by the Scan 4.5 software, excluding the extreme data over ±2000 μV. We deleted the artifacts generating eye movements by ocular artifact reduction and then applied a low-pass filter at 30 Hz (24 dB/oct). The feedback-locked epochs were created from −100 to 1,000 ms relative to the feedback presentation and were baseline corrected using the 100 ms interval before the feedback onset. Any epochs out of ±100 μV were removed as artifacts and excluded from further analysis. We separately averaged the epochs locked to positive and negative feedback of each participant. As the risk level increased following each successful pump within the same trial, each round was averaged separately to control the risk factor’s influence, producing one average waveform per round per participant (Kiat et al., Citation2016). To ensure that the number of epochs for each round was sufficient for ERP averaging (Cohen & Polich, Citation1997; Marco-Pallares et al., Citation2011), we only analyzed the first five rounds.
The ERPs were analyzed as the average of the mean amplitude at frontocentral electrodes (Fz and FCz), where the typical FRN, P2, and P3 reached their maximum (Luo et al., Citation2015; Zhang et al., Citation2013), in a time window post-onset of negative and positive feedback, respectively. The time window for each component mainly depended on visual detection of its peak in the averaged waveform. The FRN amplitude was defined as the mean value between 210 and 260 ms post-feedback presentation for the negative feedback condition. In comparison, the P3 amplitude was defined as the mean value between 300 and 420 ms. We focused on the P2 and FRN for the positive feedback condition (Kiat et al., Citation2016). The P2 was defined as the mean value between 220 and 270 ms; the FRN was defined as the mean value between 310 and 370 ms.
2.7. Data Analysis
Apart from the stress grouping, we further grouped participants according to the individual score in the gambling domain of DOSPERT-7 to test the effect of risk-taking propensity. Thirty participants were in the high risk-taking propensity (HRP) group (above the mean score), and forty-three participants were in the low risk-taking propensity (LRP) group (below the mean score). The 2 × 2 between-subjects ANOVA was performed on the gambling score to certify the effectiveness of the RP grouping.
A mixed three-way ANOVA was conducted to verify whether the TSST effectively induced acute psychosocial stress responses, with the stress/control manipulation and the HRP/LRP grouping as two between-subjects factors. And the measurement time was the within-subject factor. The salivary cortisol level, HR, and NA score from the PANAS were respectively used as dependent variables.
To examine the interplay effect of the stress induction and the individual trait on the risk-taking behaviors and ERPs in the BART, data was analyzed via ANOVA as followed. The 2 (stress manipulation: stress/control) × 2 (RP grouping: high/low) between-subjects ANOVA was performed respectively on the behavioral indexes and the mean amplitude of the FRN and P3 following negative feedback. And to further explore the effect of the level of risk in the positive feedback processing, we entered the mean amplitude of the P2 and FRN following positive feedback respectively into a 2 (stress manipulation: stress/control) × 2 (RP grouping: high/low) × 5 (round number: 1–5) repeated measures ANOVA.
3. Results
Data showed a significant main effect of RP grouping (F(1, 69) = 146.606, p < .001, η2p = 0.680), such that participants in the HRP group had a higher gambling score than those in the LRP group (see ) .
Table 1. The four groups’ age and gambling scores, with standard deviations of the means being provided in parentheses.
3.1. Stress response
3.1.1. Salivary cortisol level
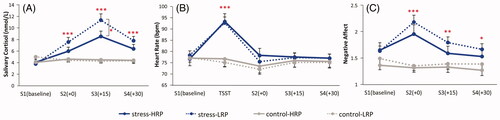
Due to the lower sensitivity of the detection reagent, six salivary cortisol values lower than 1.5 nmol/L were unrecognizable and replaced by 1.5 nmol/L. Another six missing values were replaced by the average gradient from the baseline to the measuring point within the four between-group levels (i.e. stress-HRP, stress-LRP, control-HRP, and control-LRP). Data revealed significant main effects of stress manipulation (F(1, 69) = 20.919, p < .001, η2p = 0.233) and measurement time (F(3, 207) = 28.688, p < .001, η2p = 0.294), with the salivary cortisol level being higher in the stress condition (7.08 ± 4.48 nmol/L) than that in the control condition (4.11 ± 1.95 nmol/L), higher after the TSST (immediately post-TSST: 5.74 ± 2.94 nmol/L; 15 min post-TSST: 7.34 ± 4.61 nmol/L; 30 min post-TSST: 5.83 ± 3.06 nmol/L) than that in the baseline (4.26 ± 2.19 nmol/L) (ps < 0.001), and higher in 15 min post-TSST than that at other time points following the TSST (immediately/30 min post-TSST) (ps < 0.001). The interaction of measurement time × stress manipulation (F(3, 207) = 31.913, p < .001, η2p = 0.316) and measurement time × stress manipulation × RP (F(3, 207) = 4.031, p = .014, η2p = 0.055) were also significant. The variance of the four time points was not homogeneous. Therefore, Bonferroni test was used to conduct multiple comparisons. The results revealed that at three measurement points (immediately/15 min/30 min post-TSST) but not the baseline, participants in the stress condition (6.94 ± 3.41 nmol/L/10.22 ± 4.74 nmol/L/7.24 ± 3.35 nmol/L) showed significantly higher salivary cortisol levels than those in the control condition (4.51 ± 1.66 nmol/L/4.38 ± 1.70 nmol/L/4.37 ± 1.86 nmol/L) (ps ≤ 0.001). Meanwhile, in the stress condition, participants with LRP (11.36 ± 5.13 nmol/L) evidenced significantly higher salivary cortisol levels than those with HRP (8.55 ± 3.62 nmol/L) (p = .019) in 15 min after the TSST (see ).
Figure 3. Stress indexes across the experiment for the stress group and the control group: (A) salivary cortisol concentrations; (B) heart rate; (C) NA scores in PANAS. HRP/LRP: high/low risk-taking propensity group. * p < .005; ** p < .01; *** p < .001.
3.1.2. HR
Significant main effects of stress manipulation (F(1, 69) = 4.686, p = .034, η2p = 0.064) and measurement time (F(4, 276) = 61.696, p < .001, η2p = 0.472), as well as a significant interaction of measurement time × stress manipulation (F(4, 276) = 50.104, p < .001, η2p = 0.421) were detected. HR was higher for participants in the stress condition (80.33 ± 11.68 bpm) than that in the control condition (75.28 ± 10.64 bpm), and peaked during the TSST (84.51 ± 14.65 bpm) compared with the baseline (77.44 ± 9.70 bpm) and 0/15/30 min post-TSST (74.67 ± 10.95 bpm/76.42 ± 9.41 bpm/76.15 ± 9.19 bpm) (ps < 0.001). Simple effect test revealed that the interaction was driven by a higher HR in the stress condition (92.97 ± 12.70 bpm) compared with the control condition (75.81 ± 11.04 bpm) during the TSST period (p < .001), but no significant differences were found between groups at other timepoints (ps ≥ 0.120) (see ).
3.1.3. Negative emotions (from PANAS)
The main effects of stress manipulation (F (1, 69) = 14.471, p < .001, η2p = 0.173) and measurement time (F (3,207) = 8.985, p < .001, η2p = 0.115), as well as the interaction of measurement time × stress manipulation (F (3,207) = 11.997, p < .001, η2p = 0.148) were significant. NA score was higher for participants in the stress condition (1.77 ± 0.57) than those in the control condition (1.37 ± 0.44), and reached its maximum immediately following the TSST (1.72 ± 0.65) compared with other timepoints (1.54 ± 0.49/1.55 ± 0.51/1.48 ± 0.50) (ps ≤ 0.010). Post-hoc analysis showed that, at all timepoints following the TSST (immediately/15 min/30 min post-TSST), NA score in the stress condition (2.09 ± 0.65/1.72 ± 0.51/1.61 ± 0.50) was higher than those in the control condition (1.34 ± 0.38/1.37 ± 0.44/1.34 ± 0.46) (ps ≤ 0.022), while the difference between the two groups did not reach significance during the baseline (p = .067) (see ).
3.2. Behavioral results
See for the behavioral results of the four groups. There was only a significant main effect of RP grouping (F(1, 69) = 4.500, p = .037, η2p = 0.061) with the mean adjusted number of pumps across trials being larger in the HRP group (6.48 ± 1.12) compared with their low counterpart (5.93 ± 1.08). No significant main effect of stress manipulation (F(1, 69) = 2.184, p = .144, η2p = 0.031) or the interaction of stress manipulation × RP grouping (F(1, 69) = 0.231, p = .632, η2p = 0.003) was detected.
Figure 4. The mean adjusted number of pumps for the four groups. HRP/LRP: high/low risk-taking propensity group. * p < .05.
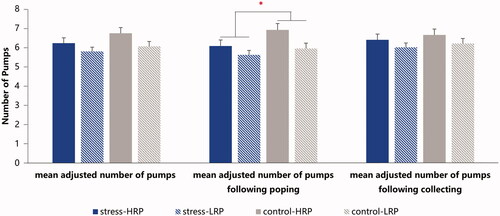
Further, we divided the behavioral index into two sub-indexes according to prior feedback’s valence: the mean adjusted number of pumps in those trials following (1) winning or (2) popping. Results showed significant main effects of RP grouping (F(1, 69) = 6.156, p = .016, η2p = 0.082) and stress manipulation (F(1,69) = 4.084, p = .047, η2p = 0.056) only in those trials following popping, such that participants in the LRP group (5.78 ± 1.18) pumped fewer times than the HRPs (6.49 ± 1.30), and the stressful participants (5.80 ± 1.14) pumped fewer times than the controls (6.35 ± 1.35). We didn’t find any other significant effect.
3.3. Erp results
3.3.1. Negative feedback
We did not detect any significant effect of stress manipulation, RP grouping, or their interaction for either the FRN amplitude (ps ≥ 0.597) or the P3 amplitude (ps ≥ 0.506) following negative feedback (see ).
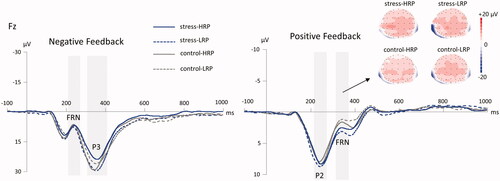
Figure 5. The grand-averaged ERPs following negative feedback and positive feedback at the Fz electrode site for the four groups. The gray shaded areas show the time windows for measuring the FRN (210–260 ms) and P3 (300–420 ms) for the negative feedback, and the P2 (220–270 ms) and FRN (310–370 ms) for the positive feedback. The scalp topographies of the FRN following positive feedback at the Fz electrode site for the four groups are presented above. HRP/LRP: high/low risk-taking propensity group.
3.3.2. Positive feedback
3.3.2.1. The P2 component
Only the main effect of round number was significant (F(4, 276) = 74.997, p < .001, η2p = 0.521), with the P2 amplitude increased from round 1 to round 5 (5.22 ± 2.76 μV/6.37 ± 3.17 μV/7.41 ± 3.29 μV/9.19 ± 4.25 μV/11.58 ± 5.27 μV) (see ). We did not detect any other significant main effect or interaction.
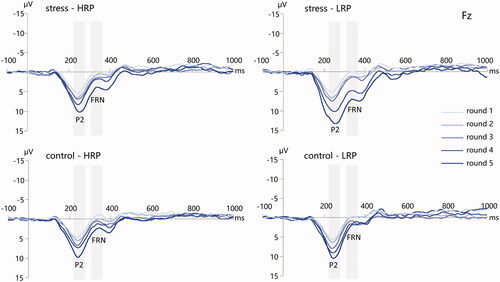
Figure 6. The grand-averaged ERPs following positive feedback from round 1 to round 5 at the Fz electrode site for the four groups. Time window: P2 (220–270 ms), FRN (310–370 ms). HRP/LRP: high/low risk-taking propensity group.
3.3.2.2. The FRN component
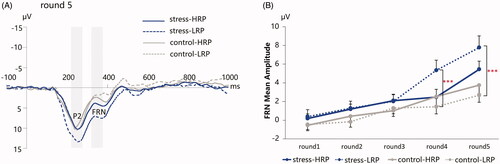
We found significant main effects of stress manipulation (F(1, 69) = 7.034, p = 0.010, η2p = 0.093) and round number (F(4, 276) = 44.694, p < .001, η2p = 0.393), with the FRN amplitude for the stress manipulation (2.89 ± 4.46 μV) being more positive than that for the control group (1.12 ± 3.18 μV), and decreasing from round 1 to round 5 (–0.13 ± 2.67 μV/0.63 ± 2.74 μV/1.58 ± 2.88 μV/3.02 ± 4.26 μV/4.97 ± 4.72 μV). The interaction of stress manipulation × round number reached significance (F(4, 276) = 3.379, p = .028, η2p = 0.047), with the more positive-going FRN for the stress participants than that for the control participants in round 4 (4.14 ± 4.61 μV vs. 1.86 ± 3.56 μV; p = .049) and round 5 (6.80 ± 5.06 μV vs. 3.09 ± 3.50 μV; p = .001). Moreover, the interaction of stress manipulation × RP grouping × round number was marginally significant (F(4, 276) = 2.768, p = .054, η2p = 0.039). Post-hoc analysis revealed that the FRN amplitude for the LRP participants in the stress condition were more positive than those in the control condition in round 4 (5.31 ± 5.10 μV vs. 1.41 ± 3.52 μV; p = .002) and round 5 (7.75 ± 5.83 μV vs. 2.64 ± 3.50 μV; p < .001) (see ).
Figure 7. (A) The grand-averaged ERPs following positive feedback at the FZ electrode for the four groups in round 5. Time window: P2 (220–270 ms), FRN (310–370 ms); (B) The peak-to-peak amplitudes of the FRN. HRP/LRP: high/low risk-taking propensity group. *** p < .001.
3.4. Relationships between behavior and ERPs
When analyzing the relationship between the main behavioral index (i.e. the mean adjusted number of pumps) and the corresponding ERP results, we first examined whether the participants’ BART performance was related to their FRN and P3 amplitude following negative feedback. Correlation analysis revealed that the ERPs following negative feedback were unrelated to the BART performance (ps ≥ 0.459). Then we performed correlations between the behavioral data and the P2 and FRN amplitude following positive feedback. The mean adjusted number of pumps was negatively correlated with the P2 amplitude (rs ≤ −0.362, ps ≤ 0.002) and the FRN amplitude (rs ≤ −0.430, ps < 0.001) in round 4 and round 5. To decrease the risk of the potential Type I error from multiple comparisons, Bonferroni correction was applied to the correlation analysis (Curtin & Schulz, Citation1998). All these associations remained significant after Bonferroni adjustment (p < .0042). No other significant relationships were observed between the mean adjusted number of pumps and ERPs for all participants.
4. Discussion
In this study, we investigated the influence of acute psychological stress on risk-taking behavior by focusing on the feedback learning stage. Our data reveal that biochemical, physiological, and psychological responses all changed significantly during the experiment. Specifically, participants’ salivary cortisol levels, HR, and NA scores in the stress induction condition were elevated compared with those in the control condition, which confirms that the stress manipulation was efficient. Most importantly, stressful participants pumped fewer times than their nonstressful counterparts, though the between-group difference was only significant following the popping trials. In our opinion, this behavioral result indicates that participants in the stress condition were more willing to avoid taking risks.
Consistent with our behavioral result, Wise et al. (Citation2015) found that stress was associated with decreased risky BART performance. Other researchers also observed that stressed individuals are more risk-averse than controls within approximately 20 min from stress onset (Pabst et al., Citation2013a), similar to our time setting procedure. Pabst et al. (Citation2013b) assessed risky decision-making in a gain and a loss domain, respectively, and detected a generally conservative tendency under stress. Researchers demonstrated increased risk aversion following the exposure to a stressor when researchers further controlled individuals’ characteristics (i.e. the “Big Five” factors) (Cahlíková & Cingl, Citation2017). All of these detections were found using psychosocial stressors (e.g. TSST, TSST-G, and speech), which forcefully support our behavioral results.
So, what changes have taken place during the feedback processing under stress? According to the literature, there are two contrary explanations of FRN. One believes that FRN is an unsigned prediction error component (Sambrook & Goslin, Citation2014; Talmi et al., Citation2013). The other proves that FRN represents a reward prediction error (RPE) that is more positive when the ongoing events are better than expected and more negative when they are worse (Holroyd & Coles, Citation2002). Our ERP results conform to the latter theory, with a more positive-going FRN for higher levels of risk, related with lower reward likelihood and larger reward magnitude. Besides that, positive feedback elicited a more positive FRN amplitude in the stress group than that in the non-stress group. Still, this between-group difference only reached significance in round 4 and round 5 with higher risk.
More interestingly, the effect was driven by individuals’ risk-taking propensity, with the more positive-going FRN for the LRP in the stress condition than those in the control condition. In comparison, participants with HRP were unaffected by stress. Building upon the interpretation of FRN, we suggest that the more positive FRN amplitude for the LRP-stress group in higher levels of risk indicates better outcomes than their expectations. The FRN amplitude can be modulated by two attributes of reward: magnitude and likelihood (HajiHosseini et al., Citation2012; Sambrook & Goslin, Citation2015). It means that either inexpectancy of large reward magnitude or overestimation of risk probability could elicit a more positive-going FRN following positive feedback. In our BART procedure, the added points in each round were constant. Participants were able to estimate the reward magnitude in the incoming round, and the magnitude itself would not surprise them. Therefore, a more positive FRN amplitude following positive feedback in the BART may evidence that participants with LRP overestimated the risk probability and became more cautious about the increased economic risk under stress. Moreover, the more positive-going FRN in higher levels of risk (i.e. round 4 and round 5) were associated with generally fewer pumps. It further demonstrated that a more conservative response style on the BART might correlate with the overestimation of risk probability.
Meanwhile, Kiat et al. (Citation2016) have pointed out that the P2 component in BART indicates the encoding of outcome predictability. A higher risk level (i.e. low outcome predictability) is associated with a larger P2. This interpretation was in line with the main effect of round number on P2 amplitude in our results. Correlation analysis further showed that the more positive the P2 amplitude in round 5 was, the fewer pumps were. Although no P2 difference reached significance in the LRP group under stress, the P2 amplitude for the stress-LRP in higher levels of risk was the largest hinging on the average waveform’s visual observation. The detection implied that the stress-LRP perceived higher risk, consistent with the finding demonstrated by the FRN. In short, our findings indicate that acute stress led individuals with LRP to overestimate the risk ranking and became more cautious to avoid taking a risk at a relatively high-risk level.
The LRP showed a conspicuously stronger salivary cortisol response relative to the HRP under stress in the current study. Previous literature suggests that the prefrontal cortex’s functioning was mainly impacted by stress hormones release (see Hermans et al., Citation2014 for a review). Meanwhile, decision-making performance relies on two different learning processes, governing goal-directed and habitual actions, respectively (Balleine & O’Doherty, Citation2010). Animal and human neurological studies demonstrate that the goal-directed system is primarily based on the prefrontal cortex and dorsomedial striatum. In contrast, the habit system is mainly related to the dorsolateral striatum (Schwabe & Wolf, Citation2013). Thus, the attenuated prefrontal cortex function under stress may prompt a shift from goal-oriented learning to habit-basedlearning (Porcelli & Delgado, Citation2017). For instance, when you get an early call for an emergency meeting and need to use the elevator, you probably would press the elevator button for the floor where your office is instead of where the meeting room is. Possibly, for this reason, stress exposure biases the LRP’s sequential processing of risk hazards, correlating with expectation formation about the outcome.
In our opinion, these findings are in line with the classic somatic marker hypothesis (Damasio & Tranel, Citation1991). According to this hypothesis, decision-making is guided by “marker signals” including emotions and feelings; critically, these marker signals arise in bioregulatory processes that may or may not be associated with the current decision situation (Bechara, Citation2004; Bechara et al., Citation2000; Naqvi et al., Citation2006). In our study, the participants’ feedback learning performance during the BART has been significantly affected by their changes in the stress level. However, these changes are modulated by a priming procedure that had no relationship with the BART. Here, one possibility is that the participants’ stress responses were mistakenly treated as “marker signals” during feedback evaluation.
Some previous studies argue that acute stress increased risk-seeking behavior (see Starcke & Brand, Citation2012 for a review), which is at odds with our finding. In our opinion, this discrepancy might be attributed to differences in experimental design, stressor type, and the duration between stress induction and decision tasks. First, Starcke and Brand (Citation2016) suggest that only under situations where risk-seeking is disadvantageous (e.g. in Iowa Gambling Task), stressed individuals are more prone to take risks. In contrast, the risky option’s expected value was positive (indicating that it is a good choice) until round 9 in our task. Second, some studies used physical stressors, which were more moderate to induce acute stress (see a review by Dickerson & Kemeny, Citation2004, for comparing cortisol increases to various stressors). Third, stress responses changed rapidly so that even a few minutes could make differences (Pabst et al., Citation2013a). Thus, the variations in the timing between the stressor onset and the decision-making task across various studies should be considered.
A few limitations of the study warrant mention. First, the major behavioral finding just reached a significant level, possibly due to the limited sample size. Second, female participants were not involved in the experiment due to the well-documented cortisol difference between sexes (Kirschbaum et al., Citation1999; Kudielka & Kirschbaum, Citation2005). For this reason, many studies have also used single-sex samples (e.g. Cano-Lopez et al., Citation2016; Daughters et al., Citation2013). Still, we suggest follow-up studies to consider females to examine the generality of our findings. It is worth noting that the menstrual cycle phase, medicine use and other potential influencing factors should be strictly controlled. Third, we only analyzed the ERP data in the first five rounds, rather than all the 12 rounds, because the data did not include sufficient ERP analysis trials in the later rounds (Marco-Pallares et al., Citation2011). Therefore, we do not know if the FRN pattern changed in higher risk levels. Besides, future studies could increase the number of epochs locked to negative feedback in each round via setting more trials or pseudo-random bursting points. In this way, we may comprehend whether and how the processing of negative feedback changes with the level of risk-taking and loss under stress.
To sum up, our findings suggest that acute stress gives rise to risk-avoidant decisions, especially for individuals with the trait of low risk-taking propensity in daily life. Furthermore, this behavior adjustment is associated with the LRP’s overestimation of risk probability in sequential decision-making, involving feedback learning and expectation formation. Considering the LRP’s hyper-concentration of cortisol after a stressful experience and the rapid effects of cortisol on brain regions, the changes might be due to a shift from goal-directed to habit-oriented learning under stress. Overall, these findings highlight the importance of situating stressed individuals’ risky decision-making in the feedback process and broad personal characteristics, which may help further understand stress-induced maladaptive behaviors.
Disclosure statement
No potential conflict of interest was reported by the author(s).
Additional information
Funding
Notes on contributors
Peishan Wang
Peishan Wang is now a Ph.D. student in the Institute of Psychology, Chinese Academy of Sciences/ Department of Psychology, University of Chinese Academy of Sciences. Her research interests include the mechanisms of how stress affects human decision-making, interindividual differences in stress processing and the psychological determinants of stress reaction and recovery.
Ruolei Gu
Ruolei Gu is now an associate professor in the Institute of Psychology, Chinese Academy of Sciences. He focuses on the mechanisms of human decision-making and the influence of emotion on decision-making.
Jingyu Zhang
Jingyu Zhang now works as an associate professor in the Institute of Psychology, Chinese Academy of Sciences. He mainly focuses on the influence of emotion on human judgment and behavior.
Xianghong Sun
Xianghong Sun Dr. Xianghong Sun is a professor in the Institute of Psychology, Chinese Academy of Sciences. Her research interests mainly include risky behavior and cognitive monitoring.
Liang Zhang
Liang Zhang Dr. Liang Zhang now works as an associate professor in the Institute of Psychology, Chinese Academy of Sciences. Her researches focus on the impacts of stress on executive function and the psychological determinants of stress reaction.
References
- Balleine, B. W., & O’Doherty, J. P. (2010). Human and rodent homologies in action control: Corticostriatal determinants of goal-directed and habitual action. Neuropsychopharmacology, 35(1), 48–69. https://doi.org/https://doi.org/10.1038/npp.2009.131
- Banis, S., Geerligs, L., & Lorist, M. M. (2014). Acute stress modulates feedback processing in men and women: Differential effects on the feedback-related negativity and theta and beta power. PLoS One, 9(4), e95690. https://doi.org/https://doi.org/10.1371/journal.pone.0095690
- Banis, S., & Lorist, M. M. (2012). Acute noise stress impairs feedback processing. Biological Psychology, 91(2), 163–171. https://doi.org/https://doi.org/10.1016/j.biopsycho.2012.06.009
- Bechara, A. (2004). The role of emotion in decision-making: Evidence from neurological patients with orbitofrontal damage. Brain and Cognition, 55(1), 30–40. https://doi.org/https://doi.org/10.1016/j.bandc.2003.04.001
- Bechara, A., Damasio, H., & Damasio, A. R. (2000). Emotion, decision making and the orbitofrontal cortex. Cerebral Cortex, 10(3), 295–307. https://doi.org/https://doi.org/10.1093/cercor/10.3.295
- Bechara, A., Damasio, H., Tranel, D., & Damasio, A. R. (2005). The Iowa Gambling Task and the somatic marker hypothesis: Some questions and answers. Trends in Cognitive Sciences, 9(4), 159–162. https://doi.org/https://doi.org/10.1016/j.tics.2005.02.002
- Buchanan, T. W., Bagley, S. L., Stansfield, R. B., & Preston, S. D. (2012). The empathic, physiological resonance of stress. Social Neuroscience, 7(2), 191–201. https://doi.org/https://doi.org/10.1080/17470919.2011.588723
- Buchanan, T. W., Laures-Gore, J. S., & Duff, M. C. (2014). Acute stress reduces speech fluency. Biological Psychology, 97, 60–66. https://doi.org/https://doi.org/10.1016/j.biopsycho.2014.02.005
- Cahlíková, J., & Cingl, L. (2017). Risk preferences under acute stress. Experimental Economics, 20(1), 209–236. https://doi.org/https://doi.org/10.1007/s10683-016-9482-3
- Cano-Lopez, I., Cano-Lopez, B., Hidalgo, V., & Gonzalez-Bono, E. (2016). Effects of acute stress on decision making under ambiguous and risky conditions in healthy young men. Spanish Journal of Psychology, 19, E59. https://doi.org/https://doi.org/10.1017/sjp.2016.57
- Claassen, D. O., van den Wildenberg, W. P. M., Ridderinkhof, K. R., Jessup, C. K., Harrison, M. B., Wooten, G. F., & Wylie, S. A. (2011). The risky business of dopamine agonists in Parkinson disease and impulse control disorders. Behavioral Neuroscience, 125(4), 492–500. https://doi.org/https://doi.org/10.1037/a0023795
- Cohen, J., & Polich, J. (1997). On the number of trials needed for P300. International Journal of Psychophysiology, 25(3), 249–255. https://doi.org/https://doi.org/10.1016/S0167-8760(96)00743-X
- Cohen, M. X., Wilmes, K., & van de Vijver, I. (2011). Cortical electrophysiological network dynamics of feedback learning. Trends in Cognitive Sciences, 15(12), 558–566. https://doi.org/https://doi.org/10.1016/j.tics.2011.10.004
- Cousijn, H., Rijpkema, M., Qin, S., van Marle, H. J. F., Franke, B., Hermans, E. J., van Wingen, G., & Fernández, G. (2010). Acute stress modulates genotype effects on amygdala processing in humans. Proceedings of the National Academy of Sciences of the United States of America, 107(21), 9867–9872. https://doi.org/https://doi.org/10.1073/pnas.1003514107
- Curtin, F., & Schulz, P. (1998). Multiple correlations and Bonferroni’s correction. Biological Psychiatry, 44(8), 775–777. https://doi.org/https://doi.org/10.1016/S0006-3223(98)00043-2
- Damasio, A. R., & Tranel, D. (1991). Somatic markers and the guidance of behavior: Theory and preliminary testing. In H. S. Levin, H. M. Eisenberg, & A. L. Benton (Eds.), Frontal lobe function and dysfunction (pp. 217–229). Oxford University Press.
- Daughters, S. B., Gorka, S. M., Matusiewicz, A., & Anderson, K. (2013). Gender specific effect of psychological stress and cortisol reactivity on adolescent risk taking. Journal of Abnormal Child Psychology, 41(5), 749–758. https://doi.org/https://doi.org/10.1007/s10802-013-9713-4
- Del Giudice, M., Buck, C. L., Chaby, L. E., Gormally, B. M., Taff, C. C., Thawley, C. J., Vitousek, M. N., & Wada, H. (2018). What is stress? A systems perspective. Integrative and Comparative Biology, 58(6), 1019–1032. https://doi.org/https://doi.org/10.1093/icb/icy114
- Dias-Ferreira, E., Sousa, J. C., Melo, I., Morgado, P., Mesquita, A. R., Cerqueira, J. J., Costa, R. M., & Sousa, N. (2009). Chronic stress causes frontostriatal reorganization and affects decision-making. Science, 325(5940), 621–625. https://doi.org/https://doi.org/10.1126/science.1171203
- Dickerson, S. S., & Kemeny, M. E. (2004). Acute stressors and cortisol responses: A theoretical integration and synthesis of laboratory research. Psychological Bulletin, 130(3), 355–391. https://doi.org/https://doi.org/10.1037/0033-2909.130.3.355
- Euser, A. S., Evans, B. E., Greaves‐Lord, K., Huizink, A. C., & Franken, I. H. (2013). Parental rearing behavior prospectively predicts adolescents’ risky decision-making and feedback-related electrical brain activity. Developmental Science, 16(3), 409–427. https://doi.org/https://doi.org/10.1111/desc.12026
- Euser, A. S., van Meel, C. S., Snelleman, M., & Franken, I. H. (2011). Acute effects of alcohol on feedback processing and outcome evaluation during risky decision-making: An ERP study. Psychopharmacology, 217(1), 111–125. https://doi.org/https://doi.org/10.1007/s00213-011-2264-x
- Faul, F., Erdfelder, E., Lang, A. G., & Buchner, A. (2007). G*Power 3: A flexible statistical power analysis program for the social, behavioral, and biomedical sciences. Behavior Research Methods, 39(2), 175–191. https://doi.org/https://doi.org/10.3758/BF03193146
- Fein, G., & Chang, M. (2008). Smaller feedback ERN amplitudes during the BART are associated with a greater family history density of alcohol problems in treatment-naïve alcoholics. Drug and Alcohol Dependence, 92(1–3), 141–148. https://doi.org/https://doi.org/10.1016/j.drugalcdep.2007.07.017
- Feldman, P. J., Cohen, S., Lepore, S. J., Matthews, K. A., Kamarck, T. W., & Marsland, A. L. (1999). Negative emotions and acute physiological responses to stress. Annals of Behavioral Medicine, 21(3), 216–222. https://doi.org/https://doi.org/10.1007/BF02884836
- Gehring, W. J., & Willoughby, A. R. (2002). The medial frontal cortex and the rapid processing of monetary gains and losses. Science, 295(5563), 2279–2282. https://doi.org/https://doi.org/10.1126/science.1066893
- Gu, R., Zhang, D., Luo, Y., Wang, H., & Broster, L. S. (2018). Predicting risk decisions in a modified Balloon Analogue Risk Task: Conventional and single-trial ERP analyses. Cognitive, Affective & Behavioral Neuroscience, 18(1), 99–116. https://doi.org/https://doi.org/10.3758/s13415-017-0555-3
- HajiHosseini, A., Rodriguez-Fornells, A., & Marco-Pallares, J. (2012). The role of beta-gamma oscillations in unexpected rewards processing. NeuroImage, 60(3), 1678–1685. https://doi.org/https://doi.org/10.1016/j.neuroimage.2012.01.125
- Hermans, E. J., Henckens, M. J., Joels, M., & Fernandez, G. (2014). Dynamic adaptation of large-scale brain networks in response to acute stressors. Trends in Neurosciences, 37(6), 304–314. https://doi.org/https://doi.org/10.1016/j.tins.2014.03.006
- Het, S., Rohleder, N., Choofs, D., Kirschbaum, C., & Wolf, O. T. (2009). Neuroendocrine and psychometric evaluation of a placebo version of the ‘Trier Social Stress Test’. Psychoneuroendocrinology, 34(7), 1075–1086. https://doi.org/https://doi.org/10.1016/j.psyneuen.2009.02.008
- Holroyd, C. B., & Coles, M. G. H. (2002). The neural basis of human error processing: Reinforcement learning, dopamine, and the error-related negativity. Psychological Review, 109(4), 679–709. https://doi.org/https://doi.org/10.1037/0033-295X.109.4.679
- Holroyd, C. B., Hajcak, G., & Larsen, J. T. (2006). The good, the bad and the neutral: Electrophysiological responses to feedback stimuli. Brain Research, 1105(1), 93–101. https://doi.org/https://doi.org/10.1016/j.brainres.2005.12.015
- Jiang, D., Zhang, D., Chen, Y., He, Z., Gao, Q., Gu, R., & Xu, P. (2018). Trait anxiety and probabilistic learning: Behavioral and electrophysiological findings. Biological Psychology, 132, 17–26. https://doi.org/https://doi.org/10.1016/j.biopsycho.2017.10.010
- Joels, M., Pu, Z., Wiegert, O., Oitzl, M. S., & Krugers, H. J. (2006). Learning under stress: How does it work? Trends in Cognitive Sciences, 10(4), 152–158. https://doi.org/https://doi.org/10.1016/j.tics.2006.02.002
- Juster, R. P., McEwen, B. S., & Lupien, S. J. (2010). Allostatic load biomarkers of chronic stress and impact on health and cognition. Neuroscience and Biobehavioral Reviews, 35(1), 2–16. https://doi.org/https://doi.org/10.1016/j.neubiorev.2009.10.002
- Kardos, Z., Kobor, A., Takacs, A., Toth, B., Boha, R., File, B., & Molnar, M. (2016). Age-related characteristics of risky decision-making and progressive expectation formation. Behavioural Brain Research, 312, 405–414. https://doi.org/https://doi.org/10.1016/j.bbr.2016.07.003
- Kiat, J., Straley, E., & Cheadle, J. E. (2016). Escalating risk and the moderating effect of resistance to peer influence on the P200 and feedback-related negativity. Social Cognitive and Affective Neuroscience, 11(3), 377–386. https://doi.org/https://doi.org/10.1093/scan/nsv121
- Kirschbaum, C., Kudielka, B. M., Gaab, J., Schommer, N. C., & Hellhammer, D. H. (1999). Impact of gender, menstrual cycle phase, and oral contraceptives on the activity of the hypothalamus-pituitary-adrenal axis. Psychosomatic Medicine, 61(2), 154–162. https://doi.org/https://doi.org/10.1097/00006842-199903000-00006
- Kirschbaum, C., Pirke, K. M., & Hellhammer, D. H. (1993). The ‘Trier Social Stress Test’ – A tool for investigating psychobiological stress responses in a laboratory setting. Neuropsychobiology, 28(1–2), 76–81. https://doi.org/https://doi.org/10.1159/000119004
- Kobor, A., Takacs, A., Janacsek, K., Nemeth, D., Honbolygo, F., & Csepe, V. (2015). Different strategies underlying uncertain decision making: Higher executive performance is associated with enhanced feedback-related negativity. Psychophysiology, 52(3), 367–377. https://doi.org/https://doi.org/10.1111/psyp.12331
- Koolhaas, J. M., Bartolomucci, A., Buwalda, B., de Boer, S. F., Flügge, G., Korte, S. M., Meerlo, P., Murison, R., Olivier, B., Palanza, P., Richter-Levin, G., Sgoifo, A., Steimer, T., Stiedl, O., van Dijk, G., Wöhr, M., & Fuchs, E. (2011). Stress revisited: A critical evaluation of the stress concept. Neuroscience and Biobehavioral Reviews, 35(5), 1291–1301. https://doi.org/https://doi.org/10.1016/j.neubiorev.2011.02.003
- Kudielka, B. M., Hellhammer, D. H., & Wust, S. (2009). Why do we respond so differently? Reviewing determinants of human salivary cortisol responses to challenge. Psychoneuroendocrinology, 34(1), 2–18. https://doi.org/https://doi.org/10.1016/j.psyneuen.2008.10.004
- Kudielka, B. M., & Kirschbaum, C. (2005). Sex differences in HPA axis responses to stress: A review. Biological Psychology, 69(1), 113–132. https://doi.org/https://doi.org/10.1016/j.biopsycho.2004.11.009
- Lauriola, M., Panno, A., Levin, I. P., & Lejuez, C. W. (2014). Individual differences in risky decision making: A meta‐analysis of sensation seeking and impulsivity with the balloon analogue risk task. Journal of Behavioral Decision Making, 27(1), 20–36. https://doi.org/https://doi.org/10.1002/bdm.1784
- Lejuez, C. W., Read, J. P., Kahler, C. W., Richards, J. B., Ramsey, S. E., Stuart, G. L., Strong, D. R., & Brown, R. A. (2002). Evaluation of a behavioral measure of risk taking: The Balloon Analogue Risk Task (BART). Journal of Experimental Psychology. Applied, 8(2), 75–84. https://doi.org/https://doi.org/10.1037/1076-898X.8.2.75
- Lighthall, N. R., Gorlick, M. A., Schoeke, A., Frank, M. J., & Mather, M. (2013). Stress modulates reinforcement learning in younger and older adults. Psychology and Aging, 28(1), 35–46. https://doi.org/https://doi.org/10.1037/a0029823
- Lighthall, N. R., Mather, M., & Gorlick, M. A. (2009). Acute stress increases sex differences in risk seeking in the balloon analogue risk task. PLoS One, 4(7), e6002. https://doi.org/https://doi.org/10.1371/journal.pone.0006002
- Lighthall, N. R., Sakaki, M., Vasunilashorn, S., Nga, L., Somayajula, S., Chen, E. Y., Samii, N., & Mather, M. (2012). Gender differences in reward-related decision processing under stress. Social Cognitive and Affective Neuroscience, 7(4), 476–484. https://doi.org/https://doi.org/10.1093/scan/nsr026
- Luo, Y., Feng, C., Wu, T., Broster, L. S., Cai, H., Gu, R., & Luo, Y. J. (2015). Social comparison manifests in event-related potentials. Scientific Reports, 5, 12127. https://doi.org/https://doi.org/10.1038/srep12127
- Maier, S. U., Makwana, A., & Hare, T. (2015). Acute stress impairs self-control in goal-directed choice by altering multiple functional connections within the brain’s decision circuits. Neuron, 87(3), 621–631. https://doi.org/https://doi.org/10.1016/j.neuron.2015.07.005
- Marco-Pallares, J., Cucurell, D., Munte, T. F., Strien, N., & Rodriguez-Fornells, A. (2011). On the number of trials needed for a stable feedback-related negativity. Psychophysiology, 48(6), 852–860. https://doi.org/https://doi.org/10.1111/j.1469-8986.2010.01152.x
- McEwen, B. S. (2008). Central effects of stress hormones in health and disease: Understanding the protective and damaging effects of stress and stress mediators. European Journal of Pharmacology, 583(2–3), 174–185. https://doi.org/https://doi.org/10.1016/j.ejphar.2007.11.071
- McEwen, B. S., & Gianaros, P. J. (2011). Stress- and allostasis-induced brain plasticity. Annual Review of Medicine, 62, 431–445. https://doi.org/https://doi.org/10.1146/annurev-med-052209-100430
- Miltner, W. H. R., Braun, C. H., & Coles, M. G. H. (1997). Event-related brain potentials following incorrect feedback in a time-estimation task: Evidence for a “generic” neural system for error detection. Journal of Cognitive Neuroscience, 9(6), 788–798. https://doi.org/https://doi.org/10.1162/jocn.1997.9.6.788
- Naqvi, N., Shiv, B., & Bechara, A. (2006). The role of emotion in decision making: A cognitive neuroscience perspective. Current Directions in Psychological Science, 15(5), 260–264. https://doi.org/https://doi.org/10.1111/j.1467-8721.2006.00448.x
- Nieuwenhuis, S., Aston-Jones, G., & Cohen, J. D. (2005). Decision making, the P3, and the locus coeruleus-norepinephrine system. Psychological Bulletin, 131(4), 510–532. https://doi.org/https://doi.org/10.1037/0033-2909.131.4.510
- Ossewaarde, L., Qin, S., Van Marle, H. J. F., van Wingen, G. A., Fernández, G., & Hermans, E. J. (2011). Stress-induced reduction in reward-related prefrontal cortex function. NeuroImage, 55(1), 345–352. https://doi.org/https://doi.org/10.1016/j.neuroimage.2010.11.068
- Pabst, S., Brand, M., & Wolf, O. T. (2013a). Stress and decision making: A few minutes make all the difference. Behavioural Brain Research, 250, 39–45. https://doi.org/https://doi.org/10.1016/j.bbr.2013.04.046
- Pabst, S., Brand, M., & Wolf, O. T. (2013b). Stress effects on framed decisions: There are differences for gains and losses. Frontiers in Behavioral Neuroscience, 7, 142. https://doi.org/https://doi.org/10.3389/fnbeh.2013.00142
- Pani, L., Porcella, A., & Gessa, G. L. (2000). The role of stress in the pathophysiology of the dopaminergic system. Molecular Psychiatry, 5(1), 14–21. https://doi.org/https://doi.org/10.1038/sj.mp.4000589
- Petrowski, K., Herold, U., Joraschky, P., Wittchen, H. U., & Kirschbaum, C. (2010). A striking pattern of cortisol non-responsiveness to psychosocial stress in patients with panic disorder with concurrent normal cortisol awakening responses. Psychoneuroendocrinology, 35(3), 414–421. https://doi.org/https://doi.org/10.1016/j.psyneuen.2009.08.003
- Pleskac, T. J., & Wershbale, A. (2014). Making assessments while taking repeated risks: A pattern of multiple response pathways. Journal of Experimental Psychology, 143(1), 142–162. https://doi.org/https://doi.org/10.1037/a0031106
- Polezzi, D., Lotto, L., Daum, I., Sartori, G., & Rumiati, R. (2008). Predicting outcomes of decisions in the brain. Behavioural Brain Research, 187(1), 116–122. https://doi.org/https://doi.org/10.1016/j.bbr.2007.09.001
- Porcelli, A. J., & Delgado, M. R. (2009). Acute stress modulates risk taking in financial decision making. Psychological Science, 20(3), 278–283. https://doi.org/https://doi.org/10.1111/j.1467-9280.2009.02288.x
- Porcelli, A. J., & Delgado, M. R. (2017). Stress and decision making: Effects on valuation, learning, and risk-taking. Current Opinion in Behavioral Sciences, 14, 33–39. https://doi.org/https://doi.org/10.1016/j.cobeha.2016.11.015
- Preston, S. D., Buchanan, T. W., Stansfield, R. B., & Bechara, A. (2007). Effects of anticipatory stress on decision making in a gambling task. Behavioral Neuroscience, 121(2), 257–263. https://doi.org/https://doi.org/10.1037/0735-7044.121.2.257
- Reynolds, E. K., Schreiber, W. M., Geisel, K., MacPherson, L., Ernst, M., & Lejuez, C. W. (2013). Influence of social stress on risk-taking behavior in adolescents. Journal of Anxiety Disorders, 27(3), 272–277. https://doi.org/https://doi.org/10.1016/j.janxdis.2013.02.010
- Rimmele, U., Seiler, R., Marti, B., Wirtz, P. H., Ehlert, U., & Heinrichs, M. (2009). The level of physical activity affects adrenal and cardiovascular reactivity to psychosocial stress. Psychoneuroendocrinology, 34(2), 190–198. https://doi.org/https://doi.org/10.1016/j.psyneuen.2008.08.023
- Rohleder, N., Schommer, N. C., Hellhammer, D. H., Engel, R., & Kirschbaum, C. (2001). Sex differences in glucocorticoid sensitivity of Proinflammatory cytokine production after psychosocial stress. Psychosomatic Medicine, 63(6), 966–972. https://doi.org/https://doi.org/10.1097/00006842-200111000-00016
- Sambrook, T. D., & Goslin, J. (2014). Mediofrontal event-related potentials in response to positive, negative and unsigned prediction errors. Neuropsychologia, 61, 1–10. https://doi.org/https://doi.org/10.1016/j.neuropsychologia.2014.06.004
- Sambrook, T. D., & Goslin, J. (2015). A neural reward prediction error revealed by a meta-analysis of ERPs using great grand averages. Psychological Bulletin, 141(1), 213–235. https://doi.org/https://doi.org/10.1037/bul0000006
- San Martín, R. (2012). Event-related potential studies of outcome processing and feedback-guided learning. Frontiers in Human Neuroscience, 6, 304. https://doi.org/https://doi.org/10.3389/fnhum.2012.00304
- Schuermann, B., Endrass, T., & Kathmann, N. (2012). Neural correlates of feedback processing in decision-making under risk. Frontiers in Human Neuroscience, 6, 204. https://doi.org/https://doi.org/10.3389/fnhum.2012.00204 22783182
- Schwabe, L., & Wolf, O. T. (2013). Stress and multiple memory systems: From ‘thinking’ to ‘doing’. Trends Cogn Sci, 17(2), 60–68. https://doi.org/https://doi.org/10.1016/j.tics.2012.12.001
- Simioni, A. C., Dagher, A., & Fellows, L. K. (2012). Dissecting the effects of disease and treatment on impulsivity in Parkinson’s disease. Journal of the International Neuropsychological Society, 18(6), 942–951. https://doi.org/https://doi.org/10.1017/S135561771200094X
- Sokol-Hessner, P., Raio, C. M., Gottesman, S. P., Lackovic, S. F., & Phelps, E. A. (2016). Acute stress does not affect risky monetary decision-making. Neurobiology of Stress, 5, 19–25. https://doi.org/https://doi.org/10.1016/j.ynstr.2016.10.003
- Sousa, N., & Almeida, O. F. (2012). Disconnection and reconnection: The morphological basis of (mal)adaptation to stress. Trends in Neurosciences, 35(12), 742–751. https://doi.org/https://doi.org/10.1016/j.tins.2012.08.006
- Starcke, K., & Brand, M. (2012). Decision making under stress: A selective review. Neuroscience and Biobehavioral Reviews, 36(4), 1228–1248. https://doi.org/https://doi.org/10.1016/j.neubiorev.2012.02.003
- Starcke, K., & Brand, M. (2016). Effects of stress on decisions under uncertainty: A meta-analysis. Psychological Bulletin, 142(9), 909–933. https://doi.org/https://doi.org/10.1037/bul0000060
- Starcke, K., Wolf, O. T., Markowitsch, H. J., & Brand, M. (2008). Anticipatory stress influences decision making under explicit risk conditions. Behavioral Neuroscience, 122(6), 1352–1360. https://doi.org/https://doi.org/10.1037/a0013281
- Takács, Á., Kóbor, A., Janacsek, K., Honbolygó, F., Csépe, V., & Németh, D. (2015). High trait anxiety is associated with attenuated feedback-related negativity in risky decision making. Neuroscience Letters, 600, 188–192. https://doi.org/https://doi.org/10.1016/j.neulet.2015.06.022
- Talmi, D., Atkinson, R., & El-Deredy, W. (2013). The feedback-related negativity signals salience prediction errors, not reward prediction errors. The Journal of Neuroscience, 33(19), 8264–8269. https://doi.org/https://doi.org/10.1523/JNEUROSCI.5695-12.2013
- van den Bos, R., Harteveld, M., & Stoop, H. (2009). Stress and decision-making in humans: Performance is related to cortisol reactivity, albeit differently in men and women. Psychoneuroendocrinology, 34(10), 1449–1458. https://doi.org/https://doi.org/10.1016/j.psyneuen.2009.04.016
- von Dawans, B., Fischbacher, U., Kirschbaum, C., Fehr, E., & Heinrichs, M. (2012). The social dimension of stress reactivity: Acute stress increases prosocial behavior in humans. Psychological Science, 23(6), 651–660. https://doi.org/https://doi.org/10.1177/0956797611431576
- von Dawans, B., Kirschbaum, C., & Heinrichs, M. (2011). The Trier Social Stress Test for Groups (TSST-G): A new research tool for controlled simultaneous social stress exposure in a group format. Psychoneuroendocrinology, 36(4), 514–522. https://doi.org/https://doi.org/10.1016/j.psyneuen.2010.08.004
- Wallsten, T. S., Pleskac, T. J., & Lejuez, C. W. (2005). Modeling behavior in a clinically diagnostic sequential risk-taking task. Psychological Review, 112(4), 862–880. https://doi.org/https://doi.org/10.1037/0033-295X.112.4.862
- Wang, X. T., Zheng, R., Xuan, Y. H., Chen, J., & Li, S. (2016). Not all risks are created equal: A twin study and meta-analyses of risk taking across seven domains. Journal of Experimental Psychology, 145(11), 1548–1560. https://doi.org/https://doi.org/10.1037/xge0000225
- Watson, D., Clark, L. A., & Tellegen, A. (1988). Development and validation of brief measures of positive and negative affect – The PANAS Scales. Journal of Personality and Social Psychology, 54(6), 1063–1070. https://doi.org/https://doi.org/10.1037/0022-3514.54.6.1063
- Weber, E. U., Blais, A. R., & Betz, N. E. (2002). A domain-specific risk-attitude scale: Measuring risk perceptions and risk behaviors. Journal of Behavioral Decision Making, 15(4), 263–290. https://doi.org/https://doi.org/10.1002/bdm.414
- Wemm, S. E., & Wulfert, E. (2017). Effects of acute stress on decision making. Applied Psychophysiology and Biofeedback, 42(1), 1–12. https://doi.org/https://doi.org/10.1007/s10484-016-9347-8
- Wise, R. J., Phung, A. L., Labuschagne, I., & Stout, J. C. (2015). Differential effects of social stress on laboratory-based decision-making are related to both impulsive personality traits and gender. Cognition & Emotion, 29(8), 1475–1485. https://doi.org/https://doi.org/10.1080/02699931.2014.989815
- Yao, Z., Zhang, L., Jiang, C., Zhang, K., & Wu, J. (2016). Stronger cortisol response to acute psychosocial stress is correlated with larger decrease in temporal sensitivity. PeerJ., 4, e2061. https://doi.org/https://doi.org/10.7717/peerj.2061
- Zhang, D., & Gu, R. (2018). Behavioral preference in sequential decision-making and its association with anxiety. Human Brain Mapping, 39(6), 2482–2499. https://doi.org/https://doi.org/10.1002/hbm.24016
- Zhang, D., Gu, R., Wu, T., Broster, L. S., Luo, Y., Jiang, Y., & Luo, Y. J. (2013). An electrophysiological index of changes in risk decision-making strategies. Neuropsychologia, 51(8), 1397–1407. https://doi.org/https://doi.org/10.1016/j.neuropsychologia.2013.04.014
- Zhang, X., Li, P., Chen, J., & Li, H. (2020). Acute stress impairs reward positivity effect in probabilistic learning. Psychophysiology, 57(4), e13531 https://doi.org/https://doi.org/10.1111/psyp.13531