
Abstract
During gestation, stress exposure increases the risk of developing cognitive and physiological alterations in either the long or short term. Among them, metabolic alterations have been described. Adipose tissue is responsible for the secretion of several factors involved in controlling body weight and energy expenditure, the regulation of insulin sensitivity, and the development of inflammation, among others. Moreover, the liver regulates glucose homeostasis and lipid metabolism, playing an essential role in developing insulin resistance. In this work, we analyzed if prenatal stress leads to alterations in metabolism and the relationship between these alterations and gene expression in the adipose tissue and the liver. Prenatal stress-exposed animals developed disturbances in the glucose and insulin response curve, showing in both tests higher glycemia than the control group. However, they did not exhibit increased body weight. At the same time, in the adipose tissue, we observed an increase in mRNA expression of Leptin and Resistin and a decrease in Adiponectin. In the liver, we observed a lower mRNA expression of several genes involved in glucose metabolism and fatty acid oxidation, such as Sirt1, Pgc1α, Pparα, among others. In both tissues, we observed a lower expression of inflammatory genes. These results suggest that prenatal stress exposure produces insulin resistance at both physiological and molecular levels without pro-inflammatory signaling or obesity.
Introduction
Maternal health during pregnancy plays a crucial role in shaping the health of the offspring. The developmental origins of health and disease hypothesis suggests a specific challenge in early life could alter an individual’s development, leading to adverse metabolic outcomes later in life (Zambrano et al., Citation2016). Epidemiological studies showed an association between intrauterine disorders and the increased incidence of type 2 diabetes, obesity (Reynolds, Citation2010), and hypertension in adulthood (Yu et al., Citation2018).
Nowadays, stress seems a risk we are exposed daily and it is a prognostic factor for the early onset of complex and common age-related diseases (Kivimäki and Steptoe, Citation2018). Stress is a threat to physiological and/or psychological homeostasis. Exposure to prenatal stress (PS) increases the risk of short- and long-term adverse cognitive and physiological health outcomes (Entringer et al., Citation2015). Several studies have shown that PS is associated with a significant decrease in birth weight (Drago et al., Citation1999; Lesage et al., Citation2004). In recent years, it appears that rapid catch-up growth may be considered a risk factor for developing cardiovascular disease and its associated phenotypes (Berends et al., Citation2013; Kelishadi et al., Citation2015). In rodents, different effects on the offspring’s metabolic health have been reported (Cao-Lei et al., Citation2020).
Adipose tissue is an endocrine organ involved in metabolic regulation and inflammatory events by releasing several adipokines (Greenberg and Obin, Citation2006). Inflammation and dysregulation of its endocrine function induce low-grade systemic inflammation and insulin resistance (Hotamisligil et al., Citation1993). Besides, it is responsible for modulating the functioning and the metabolism of the brain, liver, muscles, and cardiovascular system (Li et al., Citation2013).
The main adipokines, such as Adiponectin, Leptin, and Resistin, are closely related to obesity and IR development. Adiponectin improves insulin sensitivity and has an anti-inflammatory effect. Circulating Adiponectin levels are negatively associated with obesity, IR, type 2 diabetes, and metabolic syndrome (Recinella et al., Citation2020). Leptin regulates food intake and energy expenditure and upregulates inflammatory molecules such as Tumor necrosis factor-alpha (Tnf-α) and Interleukin 6 (IL-6) associated with the development of IR and type 2 diabetes (Recinella et al., Citation2020). At the same time, it has been suggested in several rodent models that Resistin induces IR (Recinella et al., Citation2020).
The liver plays a central role in controlling glucose homeostasis, regulating several pathways of glucose metabolism (Han et al., Citation2016). In the liver, several critical genes in regulating lipid and energy metabolism (such as Pgc1α, Pparα and Sirt1) were impaired in a range of metabolic diseases such as obesity and hepatic steatosis, leading to the development of IR (Cantó and Auwerx, Citation2009; Yang et al., Citation2021; Zhou et al., Citation2018).
The aim of this work was to study whether PS induces metabolic disturbances in adulthood, such as obesity, hyperglycemia and/or IR. In addition, to determine if these disturbances were related to changes in the gene expression profile of adipokines and inflammatory cytokines in two of the most critical tissues in glucose metabolism, the adipose tissue and the liver.
Materials and methods
Animals
Female and male C57BL/6J mice (twelve weeks old) bred in our Institute were housed on a 12-h light-dark cycle under controlled temperature (21 ± 2 °C) with ad-libitum access to food and water. All animal procedures were approved by the Institutional Animal Care and Use Committee at the Biomedical Research Institute (BIOMED, N°007/2016) and were compliant with NIH Guidelines for the Care and Use of Laboratory Animals.
Stress protocol
90 days-old female mice were mated with males for two days (ratio 2:1, n = 12 females per group). At gestational day (GD) 14, pregnant females were randomly divided into two groups: (1) non-Prenatal Stress (NPS, n = 10) or (2) Prenatal Stress (PS, n = 10). The control dams (NPS) were left undisturbed during their pregnancy, while the experimental group (PS) were exposed to restraint stress. In this case, restraint stress consisted in placing the dams in a ventilated plastic cylindrical tube (4 cm diameter, 10 cm long) for 2 h daily (from 10:00 AM to 12:00 PM) from GD 14 until delivery (GD 20–21), as previously described (Juárez et al., Citation2020). This stressor was selected because the mother’s stress can indirectly affect the fetus (Mairesse et al., Citation2007; Ward and Weisz, Citation1984). This protocol has shown to significantly affect the cardiovascular system (Igosheva et al., Citation2004), metabolism (Juárez et al., Citation2020), and neuroendocrine stress reactivity in adult offspring (Sternberg and Ridgway, Citation2003). The protocol used did not affect the number of offspring born, the male-female ratio, or the mortality rate ().
Table 1. Litter parameters analyzed on 10 litters of each group.
On postnatal day (PND) 5, pups were culled to six per mother, when possible. Litters with less than 6 offspring were removed from the study and data from these litters were only used to estimate the number of offspring born, sex and mortality ratios. After weaning (at PND 21), same-sex mice were housed in groups of four per cage. For this work, we only used male mice. Only one pup from the same litter was used per group. The remaining animals were used in other experiments. Body weight was recorded weekly throughout the rest of the study.
Intraperitoneal glucose tolerance test
Animals at 24 weeks of age were fasted for 6 h (McGuinness et al., Citation2009) (10:00 AM-04:00 PM), and basal blood glucose levels were measured by tail nick (time point 0) using a commercial glucometer (OneTouch UltraMini, LifeScan Inc, Johnson & Johnson). Subsequently, a 2 g/kg body weight solution of glucose (Sigma, St. Louis, MO, USA) was administered intraperitoneally, and glycemia was measured at 15, 30, 60, and 120 min after the injection.
Intraperitoneal insulin sensitivity test
Mice underwent an insulin sensitivity test at 25 weeks old. Since we have previously observed that the administration of insulin to C57BL/6J fasting animals produces severe hypoglycemia and, given that this risks the animal’s life, we performed the test without fasting.
Animals were intraperitoneally injected with 1 UI/kg body weight of human recombinant insulin (Insuman R, 100UI/ml, Sanofi-Aventis Argentina SA). Blood glucose concentration was measured at 0, 15, 30, 60, and 120 minutes by tail nick, using a commercial glucometer (OneTouch UltraMini, LifeScan Inc, Johnson & Johnson, Malvern, PA, USA).
Tissue collection
At 28 weeks of age, body weight was recorded, and animals were anesthetized in a CO2 chamber before were euthanized following retro-orbital bleeding. For biochemical analysis, plasma was collected. Retroperitoneal adipose tissue and liver were dissected, weighed, and stored at −80 °C until further processing. To avoid any influence of hormonal fluctuations, animals were sacrificed between 11 AM and 1 PM (ZT 4–6) (de Boer and Van der Gugten, Citation1987; Raghow, Citation2018; Tsang et al., Citation2016).
Plasma metabolic parameters
Plasma levels of total cholesterol, triglycerides, and insulin were measured. Blood samples were centrifuged at 4 °C, and plasma was stored at −80 °C until processing. Total cholesterol was quantified using Colestat enzimático Reagent (Wiener Lab, Rosario, Argentina) and triglycerides levels using TG Color Reagent (Wiener Lab, Rosario, Argentina). Plasma insulin concentration was determined by an enzyme-linked immunosorbent assay (Mercodia Mouse Insulin ELISA, Uppsala, Sweden) following the manufacturer’s protocol. The detection limit was 0.2 ug/L with a coefficient of variability of 3%.
Quantitative assessment of mRNA expression by real-time polymerase chain reaction
Total RNA was isolated from adipose tissue and liver using Transzol, according to the manufacturer’s instructions (Transgenbiotech, Beijing, China). cDNA was synthesized using 3 μg of mRNA as a template using the Moloney Murine Leukemia Virus Reverse Transcriptase (M-MLV) with deficient RNase H activity (Transgenbiotech, Beijing, China) and oligo(dT) primers according to manufacturer’s protocol. PCRs were performed in a 7500 Real-Time PCR System (Applied Biosystems, Foster City, CA, USA) using FastStart Universal SYBR Green Master (Rox) (Roche Applied Science, Mannheim, Germany). All reactions were run in duplicate. The cycling protocol featured an initial denaturation step of 5 min at 95 °C with 40 cycles of denaturation for 10 s at 95 °C, followed by annealing for 15 s at 58–62 °C (according to each primer), and extension for 20 s at 72 °C. The gene expression levels were normalized using glyceraldehyde-3-phosphate dehydrogenase (Gapdh) mRNA as an internal control. Gapdh was found to be the most stable reference gene for testing adipose tissue and liver mRNA expression among other housekeeping genes tested before starting the experiment (β-actin, cyclophilin B, and β2-microglobulin). Primer sequences are summarized in .
Table 2. List of primer sequences for quantitative assessment of mRNA expression.
Statistical analysis
Values were expressed as the mean ± standard error of the mean (SEM) for each group. Statistical analyses were conducted using STATISTICA 7.0 software (StatSoft, Inc., Tulsa, Oklahoma, USA). To analyze litter size, we used a t-test, and for other litter parameters χ2 test was used. The normality and homogeneity of variance for the dataset were tested using the Kolmogorov-Smirnov test and Levene’s test, respectively. In case the assumptions were not met, the data were transformed as appropriate. Differences between groups were analyzed using one-way ANOVA. When the time factor was also involved, repeated-measures ANOVA was used. If the transformed data did not comply with normality and/or homogeneity of variance, the non-parametric Mann-Whitney U test was used. In this case, the data were expressed as a median and interquartile range. When significant interactions were obtained, planned comparisons were used. Significance was determined at p < .05.
Results
Prenatal stress does not change body, fat, or liver weight
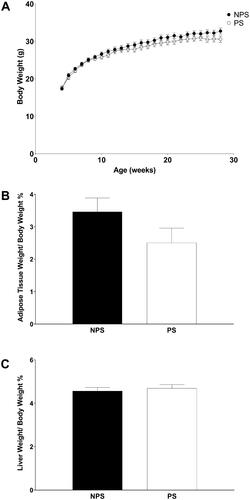
As shown in , body weight increased during the experiment with a significant interaction between prenatal treatment and time (F(24,360) = 1.88, p = .008). Using planned comparisons, we observed that prenatal treatment does not affect body weight (p = .08). Retroperitoneal adipose tissue weight/body weight (AT/BW, ) and liver weight/body weight (LW/BW, ) ratios analysis showed no significant influence of PS (AT/BW, F(1,15) = 2.35 NS and LW/BW, F(1,15) = 0.27 NS).
Figure 1. Body weight curve (A), relative visceral adipose tissue content (B) and relative liver weight (C). A. Body weight was recorded weekly from week 4 to 28. Non-prenatally stressed (NPS, dark circles) and prenatally stressed (PS, light circles). B: visceral adipose tissue weight/body weight ratio (%) and C: liver tissue weight/body weight ratio (%). NPS (dark bars) and PS (white bars). All values are presented as mean ± standard error (n = 8–9 mice in each group).
Prenatal stress produces insulin resistance without changes in plasmatic insulin and triglyceridemia
In the glucose tolerance test (), it was detected a significant interaction between time and prenatal treatment (F(4,60) = 7.28 p = .00008). Planned comparisons showed higher glucose values in PS animals at 15, 30, and 60 minutes post-glucose administration (15 min: p = .02, 30 min: p = .0002 and 60 min: p = .00002). In the insulin tolerance test, it was observed a significant interaction between time and prenatal treatment (, F(3,39) = 4.79 p = .006). Planned comparisons showed higher blood glucose levels in PS animals at basal, 15-, 30-, and 60-min post-insulin administration (basal: p = .003, 15 min: p = .00003, 30 min: p = .0003 and 60 min: p = .0001).
Figure 2. (A) Glucose tolerance test: Blood glucose measured during the glucose tolerance curve. (B) Insulin tolerance test: Blood glucose measured during the insulin sensitivity test for non-prenatally stressed (NPS, dark circles), prenatally stressed (PS, light circles). (C) Non-fasting insulin levels. (D) Triglycerides. (E) total cholesterol. Panels A–D: values are presented as mean ± standard error (for A–B and D: n = 8–9 mice in each group; for C: n = 5 mice in each group), Panel E: values are presented as median and interquartile range (n = 8–9 mice in each group). NPS: non-prenatal stress (dark bars); PS: prenatal stress (white bars). *p < .05, **p < .01 and *** p < .001.
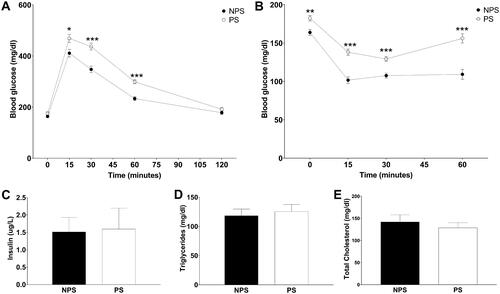
PS did not alter non-fasting insulin levels (; F(1,8) = 0.01, NS), triglyceridemia (, F(1,15) = 0.18 NS) or total cholesterol (; Mann-Whitney U Test, U = 23, NS).
Prenatal stress exposure leads to altered mRNA expression of adipokines, without evidence of inflammation in retroperitoneal adipose tissue
The mRNA expression in retroperitoneal adipose tissue () showed increased levels of Leptin (Mann-Whitney U Test, U = 12, p = .02) and Resistin (F(1,15) = 12.92, p = .003) along with a reduction in Adiponectin (F(1,15) = 20.62, p = .0004) due to PS exposure.
Figure 3. Retroperitoneal adipose tissue gene expression. A: Leptin. B: Resistin. C: Adiponectin. D: Sirtuin-1. E: Interleukin 1 beta and F: Tumor necrosis factor alfa. Panels A and E: Values are presented as median and interquartile range (n = 8–9 mice in each group). Panels B-D and F: values are presented as mean ± standard error (n = 8–9 mice in each group). NPS: non-prenatal stress (dark bars); PS: prenatal stress (white bars). * p < .05, ** p < .01 and *** p < .001.
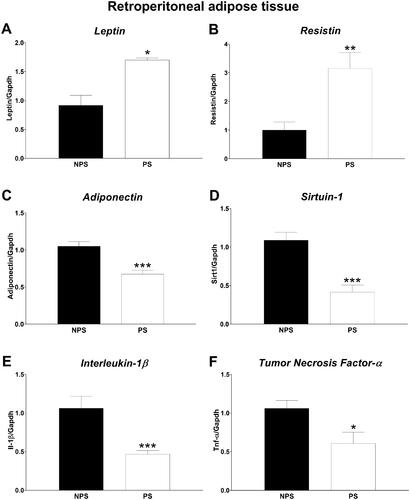
Although the role of Sirt1 in the expression of Adiponectin is still controversial (Liu and Liu, Citation2009), we decided to analyze Sirt1 mRNA expression in this model. We found a decrease in Sirt1 mRNA expression after PS exposure (F(1,15) = 23.81 p = .0002). However, we did not detect differences in the expression of Pparγ, a well-known positive regulator of Adiponectin (Maeda et al., Citation2001) (data not shown).
Due to the critical role of inflammation in the progression of IR (Rehman and Akash, Citation2016), we evaluated the mRNA expression of the two major inflammatory molecules Interleukin-1 beta (IL-1β) and Tnf-α (Rehman and Akash, Citation2016). We observed that both have a lower expression in the retroperitoneal adipose tissue of PS animals (IL-1β: Mann-Whitney U Test U = 3, p = .0006 and Tnf-α: F(1,15) = 6.89, p = .02).
Prenatal stress triggers alterations in liver gene expression related to insulin resistance
We analyzed liver mRNA gene expression () of Pgc1α since it was associated with several inflammatory and metabolic diseases (Rius-Pérez et al., Citation2020). We found a decrease in mRNA expression of Pgc1α (F(1,15) = 7.09, p = .02). In addition, we studied the mRNA expression of some genes related to Pgc1α. Pparα interacts with Pgc1α promoting mitochondrial fatty acid oxidation (Vega et al., Citation2000). We found a decrease in Pparα mRNA expression in animals under PS (F(1,14) = 4.93, p = .04). As Sirt1 activates Pgc1α (Nogueiras et al., Citation2012), we analyzed Sirt1 gene expression and observed a dowregulation by PS (F(1,15) = 14.78, p = .002). Furthermore, we found a positive correlation between Pgc1a and Sirt1 mRNA expression (Spearman R = 0.58, p = .01, data not shown).
Figure 4. Liver gene expression. A: Peroxisome proliferator-activated receptor gamma coactivator 1-alpha. B: Peroxisome Proliferator-Activated Receptor Alpha. C: Sirtuin-1. D: Sirtuin-3. E: Suppressor of cytokine signaling 3. Panels A-E: Values are presented as mean ± standard error (n = 8–9 mice in each group). NPS: non-prenatal stress (dark bars); PS: prenatal stress (white bars). * p < .05 and ** p < .01.
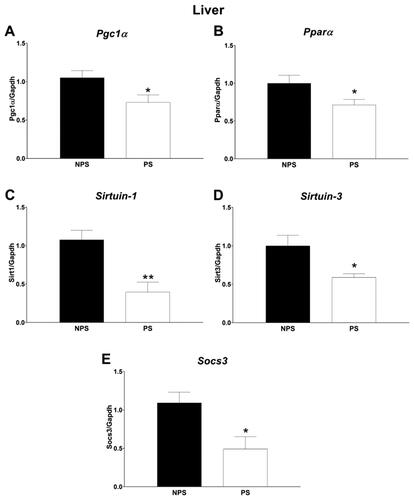
Sirt3 has been shown to play an important role in preventing metabolic syndrome and was downregulated in diabetes and other metabolic diseases (Pinterić et al., Citation2020). In PS, we found a down-regulation in Sirt3 (F(1,14) = 7.87, p = .01).
In the liver, deletion of Socs3 improves IR in mice (Torisu et al., Citation2007). We observed a reduction in mRNA expression of Socs3 (F(1,14) = 8.00, p = .01). Moreover, we found a positive correlation between Socs3 and Sirt1 mRNA expression (Spearman R = 0.63, p = .006, data not shown).
Discussion
Injuries suffered during pregnancy can result in long-term consequences for the offspring’s future health (Entringer et al., Citation2012). In the present work, we describe for the first time the development of IR induced by PS exposure without the presence of inflammation or obesity. C57BL/6J male mice showed alterations in the glucose tolerance test and the insulin sensitivity curve. In the adipose tissue, it was associated with an imbalance in adipokine gene expression, together with a decrease in inflammatory genes. However, we observed a decline in the mRNA levels of genes related to glucose metabolism and fatty acid oxidation in the liver.
Physiological parameters
Body weight, adiposity, and liver weight showed no significant variation in animals exposed to PS (compared to non-prenatally stressed animals). Recently, we reported that PS does not increase body weight or adiposity in adult BALB/c male mice (Juárez et al., Citation2020). Similar results occurred in male Sprague Dawley rats exposed to PS using a variable stress paradigm (Tamashiro et al., Citation2009) and when PS became induced by exogenous glucocorticoid (GC) administration (Tsai et al., Citation2019). On the other hand, using BALB/c mice, Luft and colleagues reported a reduction in body weight in 60 days-old mice exposed to PS using a 30-minute movement restriction paradigm every other day from day 8 of gestation to delivery (Luft et al., Citation2021). However, sleep fragmentation-PS C57BL/6J male mice showed increased body weight with higher visceral adipose tissue content, while females showed no difference (Khalyfa et al., Citation2015). To our knowledge, there are no studies measuring liver weight in rodents under PS.
We found higher blood glucose levels in PS during the glucose tolerance test at 15-, 30- and 60-minutes post-injection. Similarly, in the insulin sensitivity curve, we observed higher glucose levels at basal, 15-, 30- and 60-minutes post-injection. We performed both the insulin sensitivity curve and the insulin measurement at sacrifice on non-fasting animals. We found no changes in plasmatic insulin due to PS. These results suggest IR presence, probably at an early stage, as we do not found alterations in insulin values. Similarly, other authors reported IR in males exposed to PS using a sleep fragmentation stress model in C57BL/6J mice (Khalyfa et al., Citation2015) with higher glycemia on the glucose tolerance test and insulin sensitivity curve, but with higher insulin levels. Contradictory results are published: we and others have previously reported no difference in the glucose tolerance test, insulin sensitivity curve, or plasmatic insulin levels in BALB/c mice (Juárez et al., Citation2020; Luft et al., Citation2021) and rats (Panetta et al., Citation2017; Tamashiro et al., Citation2009). Even when GCs were used to developed PS, exposed Sprague Dawley males exhibited increase blood glucose during the glucose tolerance test, but insulin sensitivity curve and plasma insulin were unaffected (Tsai et al., Citation2019). However, when researchers used Wistar rats GCs treatment did not affect basal glycemia in the offspring (Wyrwoll et al., Citation2008).
In the liver, glucocorticoids (GCs) promote gluconeogenesis, while in white adipose tissue they decrease glucose uptake and utilization, antagonizing insulin response. Thus, high levels of GCs result in hyperglycemia and IR (Kuo et al., Citation2015). Preliminary results of this model suggest that corticosterone levels were not affected by PS.
It seems that disturbances in glucose and lipid metabolism depend on several variables such as the rodent used (rat or mice), its genetic background, type of breeding (outbreeding or inbreeding), and the type of PS used.
Adipose tissue gene expression
Adipokines Leptin and Resistin are associated with an increase in the number and size of fat cells and, therefore, with an increase in body weight or fat content (Könner and Brüning, Citation2012; Owecki et al., Citation2010). Both are involved in the development of IR (Barnes and Miner, Citation2009). Adiponectin is responsible for sensitizing tissues to insulin effects. In the present study, we observed that Leptin and Resistin mRNA expression rose in animals exposed to PS. In contrast, Adiponectin mRNA expression decreased, all signals that would indicate the development of IR. Similar results were reported by Khalyfa and colleagues using a sleep fragmentation model in C57BL/6J mice. They showed an increase in Leptin mRNA expression and a decrease in Adiponectin mRNA in males. Circulation levels of both adipokines followed the same pattern (Khalyfa et al., Citation2015). This group also reported insulin resistance in PS males (Khalyfa et al., Citation2015). On the other hand, Tsai and colleagues showed that rats exposed to GCs administration during gestation had lower Leptin mRNA levels in retroperitoneal adipose tissue together with an increase in glucose concentration after a glucose tolerance test (Tsai et al., Citation2019). Moreover, many authors have reported no changes in circulating Leptin or Adiponectin levels under PS in IR absence (Panetta et al., Citation2017; Tamashiro et al. Citation2009). Traditionally, plasma leptin levels were associated with visceral adipose tissue content. However, Franko et al. (Citation2010) have reported, in a model of PS induced by dexamethasone administration, a significant decrease in visceral adipose tissue (determined by weight) with no difference in the total adipose tissue measured by DEXA (dual emission X-ray absorption) but with an increase in circulating leptin levels. These animals showed no changes in body weight. These findings support our observations on the presence of IR. We propose that alterations in the adipokines gene expression reflect their concentration in circulation. Therefore the increase in leptin and resistin and the decrease in adiponectin would be impacting the insulin sensitivity of the peripheral tissues.
Sirt1, NAD + dependent deacetylase protein, is a crucial factor connecting nutrient signals from the environment with energy homeostasis (Schug and Li, Citation2011). Sirt1 controls inflammatory responses, regulates adipokine secretion and preserves glucose and lipid homeostasis. Moreover, Sirt1 increases insulin secretion by pancreatic β cells and modulates insulin signaling (Llorente et al., Citation2002). We found a decrease in adipose tissue mRNA expression of Sirt1, linked to a reduction in Adiponectin gene expression and inflammatory molecules such as Tnf-α and IL-1β. In our model, the decrease in Adiponectin expression seems to be directly associated with the reduction in Sirt1 gene expression. Further work is needed to study what occurs with Sirt1 protein in this model.
Regarding IL-1β and Tnf-α, exogenous administration of GCs during gestation leads to increased expression of both genes in adipose tissue (Mark et al., Citation2014). However, in our PS model, we found no evidence of inflammation. It can be attributed to the model, as this is a more physiological model and therefore with a weaker response than the one observed to the administration of exogenous GCs. We propose that the decrease in the expression of inflammatory molecules might be due to epigenetic modifications produced by exposure to PS, such as DNA hypermethylation of these genes or a key regulator gene (such as NF-κB) leading to a lower expression of inflammatory molecules. These results could be explained by an adaptive effect produced by exposure to PS; however, more research is needed to study this event.
Liver gene expression
Sirt1 is responsible for regulating glucose metabolism, fatty acid metabolism, and cholesterol metabolism in the liver. During fasting or caloric restriction, Sirt1 is upregulated in this organ, promoting gluconeogenesis by activating Pgc1α and Foxo1 while inhibiting Stat3 (Nogueiras et al., Citation2012).
We found a decrease in Sirt1 mRNA expression in the liver due to PS. mRNA expression of Pgc1α and Pparα (Pparα interacts with Pgc1α promoting mitochondrial fatty acid oxidation) were similarly affected. Pgc1α has a key role in multiple pathways related to energy metabolism control. A decrease in Pgc1α leads to the development of hepatic steatosis (Leone et al., 2005). Pparα is a key regulator of systemic and intrahepatic lipid homeostasis (Leone et al., Citation1999).
These genes decrease in several animal models of high-fat diet intake, diabetes, and nonalcoholic fatty liver disease (Gencoglu, Citation2020; Li et al., Citation2020; Santos et al., Citation2020; Zhang et al., Citation2020). Similarly, Brunton and colleagues showed a significant decrease in mRNA gene expression of Pparα in the liver of males prenatally exposed to an intruder, along with a trend toward a reduction in Pgc1α (Brunton et al., Citation2013). Luft and colleagues showed an increase in the mRNA expression of Pparα in the liver of PS BALB/c male mice, with a decrease in females (Luft et al., Citation2021). Although we did not observe alterations in cholesterol or triglyceride levels, changes in the expression of key genes in hepatic lipid metabolism would suggest that PS programs an increased susceptibility to hepatic fat accumulation, which could lead to the development of steatosis.
Sirt3 plays an essential role in preventing metabolic syndrome, being upregulated in response to caloric restriction and exercise, while down-regulated with age, high-fat diet, and diabetes (Pinterić et al., Citation2020). Here, we observed a decrease in Sirt3 mRNA expression in young adults (28 weeks old).
Suppressor of cytokine signaling proteins (Socs) are induced by pro-inflammatory cytokines. In obesity, the expression of Socs3 rises due to increased inflammatory cytokines such as IL-6 and Tnf-α. In the liver, Socs3 suppression improves IR in obese and diabetic db/db mice (Sachithanandan et al., Citation2010). Furthermore, mice with liver-specific deletion of Socs3 exhibit improved liver insulin sensitivity. However, they also develop obesity and systemic IR (Torisu et al., Citation2007). We found that PS C57BL/6J mice showed a decrease in Socs3 mRNA expression in the liver. These would be a positive sign in terms of its role in the liver. However, in this work, the gene expression balance seems to be biased toward systemic IR.
Limitations and conclusion
This work has some limitations: First, we did not assess dams corticosterone concentration; however, previously, it has been shown that stressed mothers under restraint stress had higher corticosterone levels than non-stressed ones (D’mello and Liu, Citation2006; Ward and Wainwright, Citation1988). Second, we did not record birth weight to avoid excessive handling of the animals neither studied mothers’ behavior. However, in a recent meta-analysis, we showed that birthweight decreases significantly in animals subjected to PS and that cross-fostering to non-stressed mothers had no effects on body weight (Burgueño et al., Citation2020), suggesting that maternal behavior has no influence on body weight in this model. Third, we tested several housekeeping genes and selected the most stable, however, we only used one reference gene. Finally, we did not analyze protein expression, and conclusions have been derived solely from the mRNA analysis, something to be modified in the following studies.
In summary, in the present work, we used C57BL/6J mice, a strain widely used for metabolic research. We found no changes in body weight, visceral adipose tissue, or relative liver weight. However, we observed the presence of IR, shown by alterations in the glucose tolerance test and the insulin sensitivity curve. IR was related to an increase in mRNA expression of Leptin and Resistin with a decrease in Adiponectin, IL-1β, and Tnf-α, in the adipose tissue. In contrast, in the liver, we observed a reduction in mRNA levels of Pgc1α, Pparα, Sirtuin-1 and −3, and Socs3. In this paper, we describe, for the first time, an animal model of IR induced by PS without the presence of inflammation or obesity. These results suggest this may be an initial stage of the disease due to normal insulin values found. The alterations observed in the mRNA expression of both the adipose tissue and the liver support the physiological observation of the presence of IR.
Ethical standards
The authors assert that all procedures contributing to this work comply with the ethical standards of the relevant international guides on the care and use of Laboratory animals (“Guide for the Care and Use of Laboratory Animals” (NIH) (revision 2011) and to the EC Directive 86/609/EEC (revision 2010)) and has been approved by the institutional committee (CICUAL BIOMED Res N°007/2016).
Acknowledgments
The authors would like to thank Johnson & Johnson for the kind donation of the glucose test strips and Maria Rosa Gonzalez Murano for her invaluable technical assistance.
Disclosure statement
No potential conflict of interest was reported by the author(s).
Additional information
Funding
Notes on contributors
Sofia Quiroga
Sofia Quiroga is currently conducting her Ph.D. with a fellowship from Agencia Nacional de Promoción Científica y Tecnológica.
Yamila Raquel Juárez
Yamila Raquel Juárez has a Ph.D. from Facultad de Ciencias Exactas y Naturales de la Universidad de Buenos Aires.
María Paula Marcone
María Paula Marcone is currently pursuing her Ph.D. with a fellowship from Consejo Nacional de Investigaciones Científicas y Técnicas (CONICET).
María Agustina Vidal
María Agustina Vidal is a veterinarian from Facultad de Ciencias Veterinarias de la Universidad de Buenos Aires, she is currently a member of the Support Staff for Research and Development Career of CONICET.
Ana María Genaro
Ana María Genaro obtained her Ph.D. at Facultad de Farmacia y Bioquímica de la Universidad de Buenos Aires. She is a member of the Scientific and Technological Researcher Career at CONICET and is currently the Head of the Laboratory of Psychoneuroendocrineimmunology at Pontificia Universidad Católica Argentina.
Adriana Laura Burgueño
Adriana Laura Burgueño has a Ph.D. from Facultad de Ciencias Exactas y Naturales de la Universidad de Buenos Aires and is a member of the Scientific and Technological Researcher Career at CONICET.
References
- Barnes, K. M., & Miner, J. L. (2009). Role of resistin in insulin sensitivity in rodents and humans. Current Protein & Peptide Science, 10(1), 96–107. https://doi.org/https://doi.org/10.2174/138920309787315239
- Berends, L. M., Fernandez-Twinn, D. S., Martin-Gronert, M. S., Cripps, R. L., & Ozanne, S. E. (2013). Catch-up growth following intra-uterine growth-restriction programmes an insulin-resistant phenotype in adipose tissue. International Journal of Obesity, 37(8), 1051–1057. https://doi.org/https://doi.org/10.1038/ijo.2012.196
- Brunton, P. J., Sullivan, K. M., Kerrigan, D., Russell, J. A., Seckl, J. R., & Drake, A. J. (2013). Sex-specific effects of prenatal stress on glucose homoeostasis and peripheral metabolism in rats. The Journal of Endocrinology, 217(2), 161–173. https://doi.org/https://doi.org/10.1530/JOE-12-0540
- Burgueño, A. L., Juárez, Y. R., Genaro, A. M., & Tellechea, M. L. (2020). Prenatal stress and later metabolic consequences: Systematic review and meta-analysis in rodents. Psychoneuroendocrinology, 113, 104560. https://doi.org/https://doi.org/10.1016/j.psyneuen.2019.104560
- Cantó, C., & Auwerx, J. (2009). PGC-1alpha, SIRT1 and AMPK, an energy sensing network that controls energy expenditure. Current Opinion in Lipidology, 20(2), 98–105. https://doi.org/https://doi.org/10.1097/MOL.0b013e328328d0a4
- Cao-Lei, L., de Rooij, S. R., King, S., Matthews, S. G., Metz, G. A. S., Roseboom, T. J., & Szyf, M. (2020). Prenatal stress and epigenetics. Neuroscience and Biobehavioral Reviews, 117, 198–210. https://doi.org/https://doi.org/10.1016/j.neubiorev.2017.05.016
- de Boer, S. F., & Van der Gugten, J. (1987). Daily variations in plasma noradrenaline, adrenaline and corticosterone concentrations in rats. Physiology & Behavior, 40(3), 323–328. https://doi.org/https://doi.org/10.1016/0031-9384(87)90054-0
- D’mello, A. P., & Liu, Y. (2006). Effects of maternal immobilization stress on birth weight and glucose homeostasis in the offspring. Psychoneuroendocrinology, 31(3), 395–406. https://doi.org/https://doi.org/10.1016/j.psyneuen.2005.10.003
- Drago, F., Di Leo, F., & Giardina, L. (1999). Prenatal stress induces body weight deficit and behavioural alterations in rats: The effect of diazepam. European Neuropsychopharmacology, 9(3), 239–245. https://doi.org/https://doi.org/10.1016/S0924-977X(98)00032-7
- Entringer, S., Buss, C., Swanson, J. M., Cooper, D. M., Wing, D. A., Waffarn, F., & Wadhwa, P. D. (2012). Fetal programming of body composition, obesity, and metabolic function: the role of intrauterine stress and stress biology. Journal of Nutrition and Metabolism, 2012, https://doi.org/https://doi.org/10.1155/2012/632548
- Entringer, S., Buss, C., & Wadhwa, P. D. (2015). Prenatal stress, development, health and disease risk: A psychobiological perspective-2015 Curt Richter Award Paper. Psychoneuroendocrinology, 62, 366–375. https://doi.org/https://doi.org/10.1016/j.psyneuen.2015.08.019
- Franko, K. L., Forhead, A. J., & Fowden, A. L. (2010). Differential effects of prenatal stress and glucocorticoid administration on postnatal growth and glucose metabolism in rats. The Journal of Endocrinology, 204(3), 319–329. https://doi.org/https://doi.org/10.1677/JOE-09-0390
- Gencoglu, H. (2020). Maca modulates fat and liver energy metabolism markers insulin, IRS1, leptin, and SIRT1 in rats fed normal and high-fat diets. Archives of Physiology and Biochemistry, 2020, 1–7. https://doi.org/https://doi.org/10.1080/13813455.2020.1821064
- Greenberg, A. S., & Obin, M. S. (2006). Obesity and the role of adipose tissue in inflammation and metabolism. The American Journal of Clinical Nutrition, 83(2), 461S–465S. https://doi.org/https://doi.org/10.1093/ajcn/83.2.461S
- Han, H.-S., Kang, G., Kim, J. S., Choi, B. H., & Koo, S.-H. (2016). Regulation of glucose metabolism from a liver-centric perspective. Experimental & Molecular Medicine, 48, e218. https://doi.org/https://doi.org/10.1038/emm.2015.122
- Hotamisligil, G. S., Shargill, N. S., & Spiegelman, B. M. (1993). Adipose expression of tumor necrosis factor-alpha: Direct role in obesity-linked insulin resistance. Science, 259(5091), 87–91. https://doi.org/https://doi.org/10.1126/science.7678183
- Igosheva, N., Klimova, O., Anishchenko, T., & Glover, V. (2004). Prenatal stress alters cardiovascular responses in adult rats. The Journal of Physiology, 557(Pt 1), 273–285. https://doi.org/https://doi.org/10.1113/jphysiol.2003.056911
- Juárez, Y. R., Quiroga, S., Prochnik, A., Wald, M., Tellechea, M. L., Genaro, A. M., & Burgueño, A. L. (2020). Influence of prenatal stress on metabolic abnormalities induced by postnatal intake of a high-fat diet in BALB/c mice. Journal of Developmental Origins of Health and Disease, 2020, 1–10. https://doi.org/https://doi.org/10.1017/S2040174420000987
- Kelishadi, R., Haghdoost, A. A., Jamshidi, F., Aliramezany, M., & Moosazadeh, M. (2015). Low birthweight or rapid catch-up growth: Which is more associated with cardiovascular disease and its risk factors in later life? A systematic review and cryptanalysis. Paediatrics and International Child Health, 35(2), 110–123. https://doi.org/https://doi.org/10.1179/2046905514Y.0000000136
- Khalyfa, A., Carreras, A., Almendros, I., Hakim, F., & Gozal, D. (2015). Sex dimorphism in late gestational sleep fragmentation and metabolic dysfunction in offspring mice. Sleep, 38(4), 545–557. https://doi.org/https://doi.org/10.5665/sleep.4568
- Kivimäki, M., & Steptoe, A. (2018). Effects of stress on the development and progression of cardiovascular disease. Nature Reviews. Cardiology, 15(4), 215–229. https://doi.org/https://doi.org/10.1038/nrcardio.2017.189
- Könner, A. C., & Brüning, J. C. (2012). Selective insulin and leptin resistance in metabolic disorders. Cell Metabolism, 16(2), 144–152. https://doi.org/https://doi.org/10.1016/j.cmet.2012.07.004
- Kuo, T., McQueen, A., Chen, T.-C., & Wang, J.-C. (2015). Regulation of glucose homeostasis by glucocorticoids. Advances in Experimental Medicine and Biology, 872, 99–126. https://doi.org/https://doi.org/10.1007/978-1-4939-2895-8
- Leone, T. C., Lehman, J. J., Finck, B. N., Schaeffer, P. J., Wende, A. R., Boudina, S., Courtois, M., Wozniak, D. F., Sambandam, N., Bernal-Mizrachi, C., Chen, Z., Holloszy, J. O., Medeiros, D. M., Schmidt, R. E., Saffitz, J. E., Abel, E. D., Semenkovich, C. F., & Kelly, D. P. (2005). PGC-1alpha deficiency causes multi-system energy metabolic derangements: Muscle dysfunction, abnormal weight control and hepatic steatosis. PLoS Biology, 3(4), e101. https://doi.org/https://doi.org/10.1371/journal.pbio.0030101
- Leone, T. C., Weinheimer, C. J., & Kelly, D. P. (1999). A critical role for the peroxisome proliferator-activated receptor alpha (PPARalpha) in the cellular fasting response: The PPARalpha-null mouse as a model of fatty acid oxidation disorders. Proceedings of the National Academy of Sciences of the United States of America, 96(13), 7473–7478. https://doi.org/https://doi.org/10.1073/pnas.96.13.7473
- Lesage, J., Del-Favero, F., Leonhardt, M., Louvart, H., Maccari, S., Vieau, D., & Darnaudery, M. (2004). Prenatal stress induces intrauterine growth restriction and programmes glucose intolerance and feeding behaviour disturbances in the aged rat. The Journal of Endocrinology, 181(2), 291–296. https://doi.org/https://doi.org/10.1677/joe.0.1810291
- Li, S., Qian, Q., Ying, N., Lai, J., Feng, L., Zheng, S., Jiang, F., Song, Q., Chai, H., & Dou, X. (2020). Activation of the AMPK-SIRT1 pathway contributes to protective effects of Salvianolic acid A against lipotoxicity in hepatocytes and NAFLD in mice. Frontiers in Pharmacology, 11, 560905. https://doi.org/https://doi.org/10.3389/fphar.2020.560905
- Li, Y., Ding, L., Hassan, W., Abdelkader, D., & Shang, J. (2013). Adipokines and hepatic insulin resistance. Journal of Diabetes Research, 2013, 170532. https://doi.org/https://doi.org/10.1155/2013/170532
- Liu, M., & Liu, F. (2009). Transcriptional and post-translational regulation of adiponectin. The Biochemical Journal, 425(1), 41–52. https://doi.org/https://doi.org/10.1042/BJ20091045
- Llorente, E., Brito, M. L., Machado, P., & González, M. C. (2002). Effect of prenatal stress on the hormonal response to acute and chronic stress and on immune parameters in the offspring. Journal of Physiology and Biochemistry, 58(3), 143–149. https://doi.org/https://doi.org/10.1007/BF03179851
- Luft, C., Levices, I. P., Pedrazza, L., de Oliveira, J. R., & Donadio, M. V. F. (2021). Sex-dependent metabolic effects of pregestational exercise on prenatally stressed mice. Journal of Developmental Origins of Health and Disease, 12(2), 271–279. https://doi.org/https://doi.org/10.1017/S2040174420000343
- Maeda, N., Takahashi, M., Funahashi, T., Kihara, S., Nishizawa, H., Kishida, K., Nagaretani, H., Matsuda, M., Komuro, R., Ouchi, N., Kuriyama, H., Hotta, K., Nakamura, T., Shimomura, I., & Matsuzawa, Y. (2001). PPARgamma ligands increase expression and plasma concentrations of adiponectin, an adipose-derived protein. Diabetes, 50(9), 2094–2099. https://doi.org/https://doi.org/10.2337/diabetes.50.9.2094
- Mairesse, J., Lesage, J., Breton, C., Bréant, B., Hahn, T., Darnaudéry, M., Dickson, S. L., Seckl, J., Blondeau, B., Vieau, D., Maccari, S., & Viltart, O. (2007). Maternal stress alters endocrine function of the feto-placental unit in rats. American Journal of Physiology. Endocrinology and Metabolism, 292(6), E1526–33. https://doi.org/https://doi.org/10.1152/ajpendo.00574.2006
- Mark, P. J., Wyrwoll, C. S., Zulkafli, I. S., Mori, T. A., & Waddell, B. J. (2014). Rescue of glucocorticoid-programmed adipocyte inflammation by omega-3 fatty acid supplementation in the rat. Reproductive Biology and Endocrinology, 12, 39. https://doi.org/https://doi.org/10.1186/1477-7827-12-39
- McGuinness, O. P., Ayala, J. E., Laughlin, M. R., & Wasserman, D. H. (2009). NIH experiment in centralized mouse phenotyping: The Vanderbilt experience and recommendations for evaluating glucose homeostasis in the mouse. American Journal of Physiology. Endocrinology and Metabolism, 297(4), E849–55. https://doi.org/https://doi.org/10.1152/ajpendo.90996.2008
- Nogueiras, R., Habegger, K. M., Chaudhary, N., Finan, B., Banks, A. S., Dietrich, M. O., Horvath, T. L., Sinclair, D. A., Pfluger, P. T., & Tschöp, M. H. (2012). Sirtuin 1 and sirtuin 3: Physiological modulators of metabolism. Physiological Reviews, 92(3), 1479–1514. https://doi.org/https://doi.org/10.1152/physrev.00022.2011
- Owecki, M., Miczke, A., Nikisch, E., Pupek-Musialik, D., & Sowiński, J. (2010). Serum resistin concentrations are higher in human obesity but independent from insulin resistance. Experimental and Clinical Endocrinology & Diabetes, 119(02), 117–121. https://doi.org/https://doi.org/10.1055/s-0030-1263111
- Panetta, P., Berry, A., Bellisario, V., Capoccia, S., Raggi, C., Luoni, A., Longo, L., Riva, M. A., & Cirulli, F. (2017). Long-Term Sex-Dependent Vulnerability to Metabolic challenges in Prenatally Stressed Rats. Frontiers in Behavioral Neuroscience, 11, 113. https://doi.org/https://doi.org/10.3389/fnbeh.2017.00113
- Pinterić, M., Podgorski, I. I., Hadžija, M. P., Bujak, I. T., Dekanić, A., Bagarić, R., Farkaš, V., Sobočanec, S., & Balog, T. (2020). Role of Sirt3 in Differential Sex-Related Responses to a High-Fat Diet in Mice. Antioxidants, 9(2), 174. https://doi.org/https://doi.org/10.3390/antiox9020174
- Raghow, R. (2018). Circadian rhythms of hormone secretion and obesity. World Journal of Diabetes, 9(11), 195–198. https://doi.org/https://doi.org/10.4239/wjd.v9.i11.195
- Recinella, L., Orlando, G., Ferrante, C., Chiavaroli, A., Brunetti, L., & Leone, S. (2020). Adipokines: New potential therapeutic target for obesity and metabolic, rheumatic, and cardiovascular diseases. Frontiers in Physiology, 11, 578966. https://doi.org/https://doi.org/10.3389/fphys.2020.578966
- Rehman, K., & Akash, M. S. H. (2016). Mechanisms of inflammatory responses and development of insulin resistance: How are they interlinked? Journal of Biomedical Science, 23(1), 87. https://doi.org/https://doi.org/10.1186/s12929-016-0303-y
- Reynolds, R. M. (2010). Corticosteroid-mediated programming and the pathogenesis of obesity and diabetes. The Journal of Steroid Biochemistry and Molecular Biology, 122(1–3), 3–9. https://doi.org/https://doi.org/10.1016/j.jsbmb.2010.01.009
- Rius-Pérez, S., Torres-Cuevas, I., Millán, I., Ortega, Á. L., & Pérez, S. (2020). PGC-1α, Inflammation, and Oxidative Stress: An Integrative View in Metabolism. Oxidative Medicine and Cellular Longevity, 2020, 1452696. https://doi.org/https://doi.org/10.1155/2020/1452696
- Sachithanandan, N., Fam, B. C., Fynch, S., Dzamko, N., Watt, M. J., Wormald, S., Honeyman, J., Galic, S., Proietto, J., Andrikopoulos, S., Hevener, A. L., Kay, T. W. H., & Steinberg, G. R. (2010). Liver-specific suppressor of cytokine signaling-3 deletion in mice enhances hepatic insulin sensitivity and lipogenesis resulting in fatty liver and obesity. Hepatology, 52(5), 1632–1642. https://doi.org/https://doi.org/10.1002/hep.23861
- Santos, F. O., Correia, B. R. O., Marinho, T. S., Barbosa-da-Silva, S., Mandarim-de-Lacerda, C. A., & Souza-Mello, V. (2020). Anti-steatotic linagliptin pleiotropic effects encompasses suppression of de novo lipogenesis and ER stress in high-fat-fed mice. Molecular and Cellular Endocrinology, 509, 110804. https://doi.org/https://doi.org/10.1016/j.mce.2020.110804
- Schug, T. T., & Li, X. (2011). Sirtuin 1 in lipid metabolism and obesity. Annals of Medicine, 43(3), 198–211. https://doi.org/https://doi.org/10.3109/07853890.2010.547211
- Sternberg, W. F., & Ridgway, C. G. (2003). Effects of gestational stress and neonatal handling on pain, analgesia, and stress behavior of adult mice. Physiology & Behavior, 78(3), 375–383. https://doi.org/https://doi.org/10.1016/S0031-9384(03)00015-5
- Tamashiro, K. L. K., Terrillion, C. E., Hyun, J., Koenig, J. I., & Moran, T. H. (2009). Prenatal stress or high-fat diet increases susceptibility to diet-induced obesity in rat offspring. Diabetes, 58(5), 1116–1125. https://doi.org/https://doi.org/10.2337/db08-1129
- Torisu, T., Sato, N., Yoshiga, D., Kobayashi, T., Yoshioka, T., Mori, H., Iida, M., & Yoshimura, A. (2007). The dual function of hepatic SOCS3 in insulin resistance in vivo. Genes to Cells, 12(2), 143–154. https://doi.org/https://doi.org/10.1111/j.1365-2443.2007.01044.x
- Tsai, C.-C., Tiao, M.-M., Sheen, J.-M., Huang, L.-T., Tain, Y.-L., Lin, I.-C., Lin, Y.-J., Lai, Y.-J., Chen, C.-C., Chang, K.-A., & Yu, H.-R. (2019). Obesity programmed by prenatal dexamethasone and postnatal high-fat diet leads to distinct alterations in nutrition sensory signals and circadian-clock genes in visceral adipose tissue. Lipids in Health and Disease, 18(1), 19. https://doi.org/https://doi.org/10.1186/s12944-019-0963-1
- Tsang, A. H., Astiz, M., Friedrichs, M., & Oster, H. (2016). Endocrine regulation of circadian physiology. The Journal of Endocrinology, 230(1), R1–R11. https://doi.org/https://doi.org/10.1530/JOE-16-0051
- Vega, R. B., Huss, J. M., & Kelly, D. P. (2000). The coactivator PGC-1 cooperates with peroxisome proliferator-activated receptor alpha in transcriptional control of nuclear genes encoding mitochondrial fatty acid oxidation enzymes. Molecular and Cellular Biology, 20(5), 1868–1876. https://doi.org/https://doi.org/10.1128/MCB.20.5.1868-1876.2000
- Ward, G. R., & Wainwright, P. E. (1988). Reductions in maternal food and water intake account for prenatal stress effects on neurobehavioral development in B6D2F2 mice. Physiology & Behavior, 44(6), 781–786. https://doi.org/https://doi.org/10.1016/0031-9384(88)90062-5
- Ward, I. L., & Weisz, J. (1984). Differential effects of maternal stress on circulating levels of corticosterone, progesterone, and testosterone in male and female rat fetuses and their mothers. Endocrinology, 114(5), 1635–1644. https://doi.org/https://doi.org/10.1210/endo-114-5-1635
- Wyrwoll, C. S., Mark, P. J., Mori, T. A., & Waddell, B. J. (2008). Developmental programming of adult hyperinsulinemia, increased proinflammatory cytokine production, and altered skeletal muscle expression of SLC2A4 (GLUT4) and uncoupling protein 3. The Journal of Endocrinology, 198(3), 571–579. https://doi.org/https://doi.org/10.1677/JOE-08-0210
- Yang, Z., Roth, K., Agarwal, M., Liu, W., & Petriello, M. C. (2021). The transcription factors CREBH, PPARa, and FOXO1 as critical hepatic mediators of diet-induced metabolic dysregulation. The Journal of Nutritional Biochemistry, 95, 108633. https://doi.org/https://doi.org/10.1016/j.jnutbio.2021.108633
- Yu, H.-R., Tain, Y.-L., Tiao, M.-M., Chen, C.-C., Sheen, J.-M., Lin, I.-C., Li, S.-W., Tsai, C.-C., Lin, Y.-J., Hsieh, K.-S., & Huang, L.-T. (2018). Prenatal dexamethasone and postnatal high-fat diet have a synergistic effect of elevating blood pressure through a distinct programming mechanism of systemic and adipose renin-angiotensin systems. Lipids in Health and Disease, 17(1), 50. https://doi.org/https://doi.org/10.1186/s12944-018-0701-0
- Zambrano, E., Ibáñez, C., Martínez-Samayoa, P. M., Lomas-Soria, C., Durand-Carbajal, M., & Rodríguez-González, G. L. (2016). Maternal obesity: Lifelong metabolic outcomes for offspring from poor developmental trajectories during the perinatal period. Archives of Medical Research, 47(1), 1–12. https://doi.org/https://doi.org/10.1016/j.arcmed.2016.01.004
- Zhang, Y., Zhou, B., Wen, M., Hu, M., Peng, J.-G., Wang, Y., Fan, L.-L., & Tang, L. (2020). ZG02 Improved hepatic glucose metabolism and insulin sensitivity via activation of AMPK/Sirt1 signaling pathways in a high-fat diet/streptozotocin-induced Type 2 diabetes model. Diabetes, Metabolic Syndrome and Obesity, 13, 4333–4339. https://doi.org/https://doi.org/10.2147/DMSO.S275145
- Zhou, S., Tang, X., & Chen, H.-Z. (2018). Sirtuins and insulin resistance. Frontiers in Endocrinology, 9, 748. https://doi.org/https://doi.org/10.3389/fendo.2018.00748