
Abstract
Early life stress (ELS) may become embedded into an individual’s stress physiology, changing their hypothalamic-pituitary-adrenal (HPA)-axis in an enduring, trait-like fashion. Cortisol is often utilized to investigate HPA-axis function. However, for “trait” cortisol to be a useful construct, it needs to be internally consistent within measurement occasions and show temporal stability of this reliability. These estimates of physiometrics are rarely tested with biological variables such as cortisol. Identifying reliable and stable individual differences in cortisol may be particularly important when examining questions related to the long-term impact of ELS on HPA-axis function. Using confirmatory factor analysis (CFA) to model latent trait cortisol (LTC) may be a useful statistical approach to capture trait-like indexes of HPA-axis functioning. CFA identifies commonalities among repeated cortisol samples to differentiate characteristic patterns (i.e. a trait) from day-to-day or state variation and measurement error. It is unclear whether LTC estimates are stable prospectively, or if ELS is prospectively associated with LTC. Therefore, we derived LTC factors for 84 adolescent girls (ages 10–17 years) using two-morning salivary cortisol samples, collected sequentially for three days at baseline and again at a one-year follow-up. LTC was internally consistent at both assessments and stable over one year. Greater exposure to ELS was associated with lower LTC over a one-year follow-up. Findings support LTC modeling as a useful strategy to estimate trait-like HPA-axis functioning and suggest that exposure to ELS is associated with lower trait-like cortisol.
1. Introduction
The hypothalamic-pituitary-adrenal (HPA)-axis is the body’s stress response system. In response to stress, this system governs a cascade of physiological events including the release of glucocorticoids (such as cortisol), which signals the body to maintain homeostasis by “shutting down” systems that are not needed for immediate survival (Saxbe, Citation2008). While this stress response is critical for survival, exposure to stress early in life, while brains and neurocircuitry are developing, may have profound and long-lasting effects on HPA-axis function (Doom & Gunnar, Citation2013). This biological embedding of early life stress (ELS) on stress physiology is hypothesized to make individuals more vulnerable to physical and mental health problems throughout the life course (Berens et al., Citation2017). However, while some meta-analyses have supported the idea that ELS shapes long-term HPA-axis functioning (Bunea et al., Citation2017), others have found weak associations (Bernard et al., Citation2017; Fogelman & Canli, Citation2018). This variability in associations observed between ELS and HPA-axis functioning may be due, at least in part, to differences in how cortisol is conceptualized and operationalized across studies.
Cortisol is often utilized to investigate HPA-axis function. The HPA-axis, which results in cortisol output, involves dynamic processes that are highly influenced by daily factors (Kuhlman et al., Citation2019; Ross et al., Citation2014; Shirtcliff et al., Citation2012). One meta-analysis found that when situational factors are manipulated methodologically ELS is associated with a blunted cortisol response to acute social stress (Bunea et al., Citation2017). However, since ELS is hypothesized to become embedded into an individual’s stress physiology and change HPA-axis functioning in an enduring fashion, a better understanding of how ELS affects stable, trait-like (rather than acute) characteristics of HPA-axis function is needed.
Diurnal cortisol can be conceptualized in various ways. Commonly used assessment strategies include the cortisol awakening response (CAR; the difference in cortisol levels from waking to 30-minutes after waking), diurnal slope (a growth curve representing a decline in cortisol across the day), and diurnal area-under-the-curve (AUC; a trapezoidal formula representing total cortisol output throughout the day). These strategies, however, often do not produce stable estimates across time and require many samples (e.g. 4 to 6) across many days (e.g. 10) to achieve reliability (Segerstrom et al., Citation2014), which diminishes their feasibility (Doane et al., Citation2015). For “trait” diurnal cortisol to be a valid construct, repeated measurements need to be internally consistent and stable over time. These physiometric properties are rarely tested with biological variables such as cortisol (Moriarity & Alloy, Citation2021; Segerstrom, Citation2020). Identifying reliable and stable trait-like individual differences in cortisol may be particularly important when examining questions related to the long-term impact of ELS on HPA-axis function.
Doane et al. (Citation2015) proposed a latent variable modeling approach to provide reliable estimates of trait-like cortisol. These researchers showed that confirmatory factor analysis can be used to estimate commonalities across repeated assessments of cortisol to derive a measure of latent trait cortisol (LTC). In this approach, the overlapping variances across multiple assessments are used to differentiate trait-like cortisol levels from day-to-day fluctuations and measurement error. Only a handful of studies (most drawn from the same pool of subjects) have used this LTC approach to examine the relationship between cortisol and ELS, and findings have been conflicting. While several studies found that ELS was associated with lower LTC values among early adolescents (Chen et al., Citation2017; Stroud et al., Citation2020; Stroud et al., Citation2016a, Citation2016b; Stroud et al., Citation2019) one study found that early life trauma is associated with higher LTC values among late adolescents (Doane et al., Citation2015). This latter study was the only one that examined LTC prospectively. It remains unclear if the discrepancy between these studies is a function of the ELS construct, the focus on early versus late adolescence, or the stability of LTC (which requires more than one measurement occasion to assess).
The current study aimed to complement and extend previous findings focused on the association between ELS and LTC in a sample of adolescent girls at varying psychiatric risk. The first aim of this research was to test if a reliable LTC factor, using the saliva sampling strategy recommended by Doane et al. (Citation2015), could be derived separately across two-time points (at baseline and again at a one-year follow-up). In other words, we aimed to test the internal consistency of LTC across two measurement occasions. Our second aim was to examine the temporal stability of LTC prospectively across one year (i.e. test if LTC estimates at baseline statistically predict LTC estimates at follow-up). Our final aim was to prospectively examine the effect of ELS on LTC.
2. Method
2.1. Participants
Participants were part of a larger study examining biobehavioral markers of depression among adolescent girls. Using diagnostic interviews, the original study classified girls into three groups: currently depressed, high risk for depression (based on parental depression history), or control (no personal or parental history of depression). A subsample of 84 girls with available cortisol data (ages 10–17 years, mean age = 13 years, SD age = 2.3) were included in the present study. The racial/ethnic distribution of girls was 57% non-Hispanic white, 18% Latina or Hispanic, 12% non-Hispanic Black, 11% multi-racial, 1% American Indian/Alaskan, and 1% Asian.
2.2. Procedures
The Institutional Review Board at the Rhode Island Hospital approved all procedures (#: 233512). Participants were recruited from community and internet postings, schools, and physician/mental health offices throughout Southern Massachusetts and Rhode Island. Informed consent was obtained from parents; youth assented to participate. At baseline, participants and their parents provided demographic and psychiatric history information. Participants completed home-collected saliva sampling for three sequential days following the baseline interview. Participants provided saliva samples at awakening and ∼30-minutes post-awakening. Participants were asked not to eat, drink, or brush their teeth within 2 hours before saliva collection. Participants reported salvia sample time, wake time, and sleep duration. An identical home saliva collection protocol was completed at a one-year follow-up.
2.2.1. Salivary cortisol
Samples were assayed for cortisol in duplicate, using a high sensitivity enzyme immunoassay (Cat. No. 1-3002) at Salimetrics. The assay has a lower limit of sensitivity of 0.007 μg/dL, an average intra-assay coefficient of variation of 4.60%, and an average inter-assay coefficient of variation of 6.00%. We provided 30% of the sample with Medication Event Monitoring System (MEMS) adherence caps. MEMS recorded time was not significantly different than self-report at either wave (p-values > 0.05). Samples taken within 15-minutes of waking were included in the analyses. Given that we were interested in deriving LTC that capitalizes on shared cortisol variance and not the awakening response, we used all available second-morning samples. We excluded 8 samples because they were outliers (i.e. more than 3 standard deviations away from the mean).
2.3. Measures
An adapted version of the Psychosocial Schedule (PSS; Lukens et al., Citation1983) for School-aged children was used to assess forty-three early life stressors (see ). We used a lifetime count of early life stress, excluding those relating to finances since we assessed SES separately. The reported range of early life stressors was 0 to 14 (mean = 4.4, SD = 3.0). Parents reported indexes of SES including income, employment status, the highest degree of education, as well as youth’s race. Girls self-reported their age at baseline. Pubertal maturation was assessed by adolescent self-report and/or a physical exam by a nurse at baseline (Dorn et al., Citation2006). We obtained adolescent self-reported Tanner ratings for 99% of the sample and nurse-reported Tanner ratings for 62% of the sample. For those participants who had both self-reported and nurse-reported ratings an average of the two were utilized. In cases, where only self-report was available, we only utilized self-report. A composite score (ranging from 1= no development to 5= fully developed) on the Tanner criterion (breast and pubic hair development) was used to identify the pubertal phase (Marshall & Tanner, Citation1969).
Table 1. Number of early life stressors.
2.4. Data analytic plan
Analyses were conducted in Mplus 7.4 (L. K. Muthén & B. O. Muthén, Citation1998–2015). We performed bivariate daily cortisol correlations by wave (baseline and one-year follow-up), examined associations of day level variation in wake time and sleep duration with cortisol values, followed by a confirmatory factor measurement LTC model for each wave separately. Specifically, we modeled wake and wake + 30 mins saliva samples as indicators of a within-wave LTC factor. To test the internal consistency of LTC estimates, we inspected factor loadings of the saliva indicators and model fit indices (e.g. Comparative Fit Index [CFI] and the Root Mean Square Error of Approximation [RMSEA]). CFI of 0.9 or higher is considered a good model fit, as is RMSEA of 0.10 or lower. We examined the following variables as potential covariates using Pearson, Biserial and Polyserial correlations as appropriate: age, race/ethnicity, pubertal phase, and psychiatric risk. Furthermore, given that socioeconomic status (SES) is often associated with ELS, we controlled for the potential impact of SES on LTC a priori. Lastly, we tested the temporal stability (i.e. test-retest correlation) of LTC estimates, and examined the effect of ELS on LTC. Full information maximum likelihood (FIML) was used to accommodate missing data and is robust to non-normal data distributions (Schafer & Graham, Citation2002).
3. Results
Pearson correlations revealed that wake and wake + 30 mins cortisol samples across the three days, within both baseline and one-year follow-up, were mostly positively correlated (see ). We examined associations between sleep duration and wake time and cortisol values (see ). To account for the significant influence of the day variables, we regressed the relevant wake time and sleep duration on the relevant daily cortisol sample indicator. Modification indices suggested that baseline residual terms for day 2 and day 3 cortisol wake times should be allowed to correlate, while at one-year follow-up, both wake and wake + 30 mins for day 3 should be allowed to correlate. These correlated residual terms were included in the measurement models ().
Figure 1. Measurement model of cortisol at (A) baseline and (B) 1-year follow-up. Notes: *p < 0.05; **p < 0.001; LTC : latent trait cortisol; W : wake sample; 30 : 30-minutes post-wake sample; D : day. The LTC measurement model at the one-year follow-up depicted above includes modeling puberty as an auxiliary variable. No auxiliary variables were included in the main analyses depicted in . These measurement models also include significant wake and wake + 30 mins regressed on relevant day cortisol indicators.
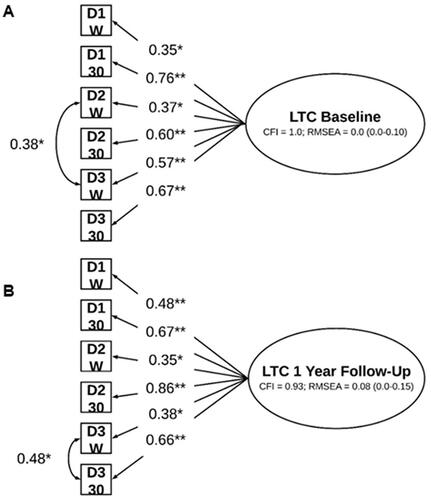
Table 2. Pearson correlations, means, and standard deviations of cortisol.
Table 3. Pearson correlations between the wake time and sleep duration variables and relevant day variables.
We first derived two separate LTC measurement models (baseline and one-year follow-up) with acceptable model fit indices. Model fit indices for baseline LTC were CFI = 1.0, and RMSEA = 0.00. Model fit indices for one-year follow-up were CFI = 0.93, and RMSEA = 0.08. Standardized factor loadings for the cortisol indicators at both waves were statistically significant and substantial (ranging from 0.35 to 0.86; ).
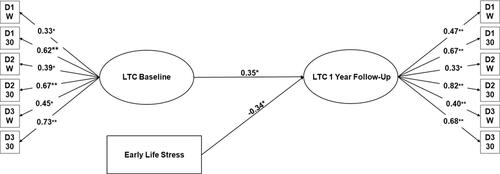
Next, we derived baseline and one-year follow-up LTC in the same model and included wake time and sleep duration regressions where relevant (as discussed in the measurement models above), SES, and ELS. None of the potential covariates were associated with LTC (all p-values > 0.05). Thus, the model did not include any additional covariates. As depicted in , there was excellent model fit (CFI = 0.94, RMSEA = 0.03); all cortisol indicators were significant and substantial, with standardized factor loadings ranging from (0.33 to 0.82). There was a significant positive auto-regressive effect from baseline LTC to one-year follow-up, showing the stability of LTC. Using confirmatory factor analysis (CFA) we derived a latent SES variable from income (standardized factor loading = 0.77, p < 0.01), maternal education (standardized factor loading = 0.59, p < 0.01), and current maternal employment (standardized factor loading = 0.89, p < 0.01). No effect of SES on LTC was observed (standardized coefficient = 0.21, p = 0.15). Finally, results showed that ELS was associated with LTC at one-year follow-up (standardized coefficient = −0.34, p < 0.05). Specifically, girls with greater exposure to ELS showed significantly lower LTC.
Figure 2. Latent trait cortisol at baseline and 1-year follow-up and early life stress. Notes: *p < 0.05; **p < 0.001; CFI = 0.94; RMSEA = 0.03 (0.0–0.06); LTC : latent trait cortisol; W : wake sample; 30 : 30-minutes post-wake sample; D : day. The following is not depicted for parsimony: significant wake and wake + 30 mins regressed on relevant day cortisol indicators. The model controls for SES.
4. Discussion
There has been a great interest in understanding how ELS gets “under the skin” causing long-term changes to stress physiology (Doom & Gunnar, Citation2013). Recent meta-analyses have suggested that the heterogeneity in the relationship between ELS and cortisol may be due to how cortisol is operationalized (Bernard et al., Citation2017; Bunea et al., Citation2017; Fogelman & Canli, Citation2018). In the present study, we aimed to address prior limitations in the literature by examining whether we could derive a reliable and stable measure of LTC, a trait-like assessment of cortisol, as well as the association between ELS and LTC among adolescent girls.
We contextualize our findings within the burgeoning field of salivary bioscience physiometrics (Segerstrom, Citation2020). This field highlights the importance of examining internal consistency (such as repeated observations of cortisol demonstrating overlap in variance, i.e. reliability) and temporal stability (i.e. measurements need to correlate across time) (see Moriarity and Alloy, Citation2021). Results indicated that LTC was internally consistent at two different time points (at baseline assessment and again at one-year follow-up). Furthermore, this is the first study to show one-year stability of LTC among adolescent girls at varying psychiatric risks. These findings complement the work of Doane and colleagues (Doane et al., Citation2015) who found LTC to be stable across 5–9 months among older community adolescents. These results suggest that LTC may be a useful analytic approach for investigating the role of trait-like HPA-axis functioning.
We also found that ELS was significantly associated with lower LTC at a one-year follow-up. These results are consistent and extend work showing that ELS was associated with lower LTC (using one measurement occasion to derive an LTC estimate) (Chen et al., Citation2017; Stroud et al., Citation2016a, Citation2016b, Citation2019, Citation2020). Together, this work suggests that adolescents’ (and specifically adolescent girls’) cortisol output may function in a trait-like manner. These results also align with the attenuation hypothesis (Trickett et al., Citation2010), in which the HPA-axis adapts to hypersecretion of cortisol following exposure to stress or trauma, resulting in downregulation of the HPA-axis and hyposecretion of cortisol over time. The assessment of ELS utilized in the current study encompassed various stressors that fall along a continuum of severity. Our ELS conceptualization was similar to that employed by Stroud and colleagues (Chen et al., Citation2017; Stroud et al., Citation2016a, Citation2016b, Citation2019, Citation2020), but differed from Doane et al. (Citation2015) who examined experiences specific to abuse and neglect (and showed ELS to have a positive association with LTC). It may be that ELS is associated with LTC, but that the direction of the association may differ based on the type or combination of types of ELS, as well as the developmental timing, chronicity, and severity of ELS.
We acknowledge limitations to our study. The sample consisted of adolescent girls at varying psychiatric risks. Thus, findings may not be generalizable to other populations. Furthermore, we included adolescent girls with a wide age range (10–17), and we were unable to secure nurse ratings on the pubertal phase for all participants. Lastly, our sample size was relatively small, and more precise LTC estimates may be obtained using larger samples.
Based on our work we highlight some potential future research directions for the field. In terms of the conceptualization of ELS, future investigations of ELS and LTC may benefit from the more rigorous characterization of ELS utilizing multimethod approaches (e.g. child protective services record review, contextual stress interviews, youth/caregiver reports), as well as examining ELS according to developmental timing, duration, and types (Ziobrowski et al., Citation2020). In reference to the distinction between trait and state HPA-axis functioning, our results also show that the magnitude of the trait-like effect leaves substantial room for developmental and state-like dynamics. Researchers whose studies focus on understanding state-level effects may consider a data analytic approach suitable for capturing cortisol dynamics (e.g. multilevel modeling).
Future research should empirically investigate the differential validity of distinct cortisol sampling strategies to derive LTC. For example, future research directions may include methods that account for various state-level influences (such as the impact of circadian rhythm variables beyond sleep duration, such as sleep efficiency, the timing of sleep onset/offset) utilizing wearable sensors. Removing additional state variance has the potential to improve the precision of measurements when estimating “trait” cortisol. Furthermore, in this study, we utilized two-morning cortisol samples to derive an LTC factor because this was the sampling strategy utilized by Doane and colleagues (2015). Given that there is a general replication crisis in the field, we found merit in aiming to replicate and extend the findings of Doane and colleagues (Doane et al., Citation2015). To our knowledge, Doane et al. (Citation2015) are the only group that has examined LTC prospectively (using this specific sampling strategy). Thus, by using a similar sampling strategy to this research group, our results (from an independent research team) are more comparable. However, it may be that utilizing other cortisol samples from various points along the diurnal curve may yield more robust LTC estimates. A recent review and meta-analysis (Adam et al., Citation2017) showed that flatter diurnal cortisol slopes were strongly associated with worse physical and mental health. Based on this work it may be that utilizing change levels in cortisol from morning to bedtime may serve as more optimal indicators to derive LTC. In short, LTC is an approach to the analysis of salivary cortisol data. Utilizing two-morning samples to derive LTC (as done here) is one of many sampling strategies available to apply the LTC analytic approach. More research is needed to determine the optimal number and timing of cortisol samples (e.g. morning, bedtime) needed to apply LTC modeling. Lastly, it is important to note that other methods exist for examining stable individual differences in HPA-axis function such as measuring cortisol in hair (Khoury et al., Citation2019) or examining genetic influences (Gerritsen et al., Citation2017).
In summary, our study provides empirical evidence that LTC modeling may be a useful analytic approach for researchers interested in examining enduring trait-like HPA-axis function. While our data does not elucidate the most optimal sampling strategy for deriving LTC, it does provide additional support that LTC can be measured using two-morning salivary cortisol samples from three sequential days. Albeit, future research may show that using a different sampling strategy may improve the physiometrics of LTC, as well as predictive utility for constructs of interest. Lastly, this study contributes to a growing literature suggesting that exposure to ELS is associated with enduring downregulation of cortisol output.
Notes on contributors
LRS’s laboratory collected the data. CVL and NM analyzed the data. CVL conceptualized the project, interpreted results, and wrote the current version of this article with intellectual content contribution and critical revision by MHB, HNZ, AG, and LRS.
Disclosure statement
No potential conflict of interest was reported by the author(s).
Correction Statement
This article has been corrected with minor changes. These changes do not impact the academic content of the article.
Additional information
Funding
References
- Adam, E. K., Quinn, M. E., Tavernier, R., McQuillan, M. T., Dahlke, K. A., & Gilbert, K. E. (2017). Diurnal cortisol slopes and mental and physical health outcomes: A systematic review and meta-analysis. Psychoneuroendocrinology, 83, 25–41. https://doi.org/https://doi.org/10.1016/j.psyneuen.2017.05.018
- Berens, A. E., Jensen, S. K., & Nelson, C. A. (2017). Biological embedding of childhood adversity: From physiological mechanisms to clinical implications. BMC Medicine, 15(1), 1–12. https://doi.org/https://doi.org/10.1186/s12916-017-0895-4
- Bernard, K., Frost, A., Bennett, C. B., & Lindhiem, O. (2017). Maltreatment and diurnal cortisol regulation: A meta-analysis. Psychoneuroendocrinology, 78, 57–67. https://doi.org/https://doi.org/10.1016/j.psyneuen.2017.01.005
- Bunea, I. M., Szentágotai-Tătar, A., & Miu, A. C. (2017). Early-life adversity and cortisol response to social stress: A meta-analysis. Translational Psychiatry, 7(12), 1–8. https://doi.org/https://doi.org/10.1038/s41398-017-0032-3
- Chen, F. R., Stroud, C. B., Vrshek-Schallhorn, S., Doane, L. D., & Granger, D. A. (2017). Individual differences in early adolescents’ latent trait cortisol: Interaction of early adversity and 5-HTTLPR. Biological Psychology, 129, 8–15. https://doi.org/https://doi.org/10.1016/j.biopsycho.2017.07.017
- Doane, L. D., Chen, F. R., Sladek, M. R., Van Lenten, S. A., & Granger, D. A. (2015). Latent trait cortisol (LTC) levels: Reliability, validity, and stability. Psychoneuroendocrinology, 55, 21–35. https://doi.org/https://doi.org/10.1016/j.psyneuen.2015.01.017
- Doom, J. R., & Gunnar, M. R. (2013). Stress physiology and developmental psychopathology: Past, present, and future. Development and Psychopathology, 25(4 Pt 2), 1359–1373. https://doi.org/https://doi.org/10.1017/S0954579413000667
- Dorn, L. D., Dahl, R. E., Woodward, H. R., & Biro, F. (2006). Defining the boundaries of early adolescence: A user's guide to assessing pubertal status and pubertal timing in research with adolescents [article]. Applied Developmental Science, 10(1), 30–56. https://doi.org/https://doi.org/10.1207/s1532480xads1001_3
- Fogelman, N., & Canli, T. (2018). Early life stress and cortisol: A meta-analysis. Hormones and Behavior, 98, 63–76. https://doi.org/https://doi.org/10.1016/j.yhbeh.2017.12.014
- Gerritsen, L., Milaneschi, Y., Vinkers, C. H., van Hemert, A. M., van Velzen, L., Schmaal, L., & Penninx, B. W. J. H. (2017). HPA axis genes, and their interaction with childhood maltreatment, are related to cortisol levels and stress-related phenotypes. Neuropsychopharmacology, 42(12), 2446–2455. https://doi.org/https://doi.org/10.1038/npp.2017.118
- Khoury, J. E., Bosquet Enlow, M., Plamondon, A., & Lyons-Ruth, K. (2019). The association between adversity and hair cortisol levels in humans: A meta-analysis. Psychoneuroendocrinology, 103, 104–117. https://doi.org/https://doi.org/10.1016/j.psyneuen.2019.01.009
- Kuhlman, K. R., Robles, T. F., Dickenson, L., Reynolds, B., & Repetti, R. L. (2019). Stability of diurnal cortisol measures across days, weeks, and years across middle childhood and early adolescence: Exploring the role of age, pubertal development, and sex. Psychoneuroendocrinology, 100, 67–74. https://doi.org/https://doi.org/10.1016/j.psyneuen.2018.09.033
- Lukens, E., Puig-Antich, J., Behn, J., Goetz, R., Tabrizi, M., & Davies, M. (1983). Reliability of the psychosocial schedule for school age children. Journal of the American Academy of Child Psychiatry, 22(1), 29–39. https://doi.org/https://doi.org/10.1097/00004583-198301000-00005
- Marshall, W. A., & Tanner, J. M. (1969). Variations in pattern of pubertal changes in girls. Archives of Disease in Childhood, 44(235), 291–303. https://doi.org/https://doi.org/10.1136/adc.44.235.291
- Moriarity, D. P., & Alloy, L. B. (2021). Back to basics: The importance of measurement properties in biological psychiatry. Neuroscience and Biobehavioral Reviews, 123, 72–82. https://doi.org/https://doi.org/10.1016/j.neubiorev.2021.01.008
- Muthén, L. K., & Muthén, B. O. (1998–2015). Mplus user’s guide. Muthén & Muthén.
- Ross, K. M., Murphy, M. L. M., Adam, E. K., Chen, E., & Miller, G. E. (2014). How stable are diurnal cortisol activity indices in healthy individuals? Evidence from three multi-wave studies. Psychoneuroendocrinology, 39, 184–193. https://doi.org/https://doi.org/10.1016/j.psyneuen.2013.09.016
- Saxbe, D. E. (2008). A field (researcher’s) guide to cortisol: Tracking HPA axis functioning in everyday life. Health Psychology Review, 2(2), 163–190. https://doi.org/https://doi.org/10.1080/17437190802530812
- Schafer, J. L., & Graham, J. W. (2002). Missing data: Our view of the state of the art. Psychological Methods, 7(2), 147–177. https://doi.org/https://doi.org/10.1037/1082-989X.7.2.147
- Segerstrom, S. C. (2020). Physiometrics in salivary bioscience. International Journal of Behavioral Medicine, 27(3), 262–266. https://doi.org/https://doi.org/10.1007/s12529-020-09899-0
- Segerstrom, S. C., Boggero, I. A., Smith, G. T., & Sephton, S. E. (2014). Variability and reliability of diurnal cortisol in younger and older adults: Implications for design decisions. Psychoneuroendocrinology, 49, 299–309. https://doi.org/https://doi.org/10.1016/j.psyneuen.2014.07.022
- Shirtcliff, E. A., Allison, A. L., Armstrong, J. M., Slattery, M. J., Kalin, N. H., & Essex, M. J. (2012). Longitudinal stability and developmental properties of salivary cortisol levels and circadian rhythms from childhood to adolescence. Developmental Psychobiology, 54(5), 493–502. https://doi.org/https://doi.org/10.1002/dev.20607
- Stroud, C. B., Chen, F. R., Curzi, B. E., Granger, D. A., & Doane, L. D. (2020). Overestimating self-blame for stressful life events and adolescents’ latent trait cortisol: The moderating role of parental warmth. Journal of Youth and Adolescence, 49(1), 283–298. https://doi.org/https://doi.org/10.1007/s10964-019-01112-0
- Stroud, C. B., Chen, F. R., Doane, L. D., & Granger, D. A. (2016a). Individual differences in early adolescents’ latent trait cortisol (LTC): Relation to early adversity. Developmental Psychobiology, 58(6), 700–713. https://doi.org/https://doi.org/10.1002/dev.21410
- Stroud, C. B., Chen, F. R., Doane, L. D., & Granger, D. A. (2016b). Individual differences in early adolescents’ latent trait cortisol (LTC): Relation to recent acute and chronic stress. Psychoneuroendocrinology, 70, 38–46. https://doi.org/https://doi.org/10.1016/j.psyneuen.2016.04.015
- Stroud, C. B., Chen, F. R., Doane, L. D., & Granger, D. A. (2019). Early adversity and internalizing symptoms in adolescence: Mediation by individual differences in latent trait cortisol. Development and Psychopathology, 31(2), 509–524. https://doi.org/https://doi.org/10.1017/S0954579418000044
- Trickett, P. K., Noll, J. G., Susman, E. J., Shenk, C. E., & Putnam, F. W. (2010). Attenuation of cortisol across development for victims of sexual abuse. Development and Psychopathology, 22(1), 165–175. https://doi.org/https://doi.org/10.1017/S0954579409990332
- Ziobrowski, H. N., Buka, S. L., Austin, S. B., Sullivan, A. J., Horton, N. J., Simone, M., & Field, A. E. (2020). Using latent class analysis to empirically classify maltreatment according to the developmental timing, duration, and co-occurrence of abuse types. Child Abuse & Neglect, 107, 104574. https://doi.org/https://doi.org/10.1016/j.chiabu.2020.104574