
Abstract
Patients with post-traumatic stress disorder (PTSD) are usually at an increased risk for chronic disorders, such as irritable bowel syndrome (IBS), characterized by hyperalgesia and allodynia, but its subsequent effect on visceral hyperalgesia and the mechanism remain unclear. The present study employed single prolonged stress (SPS), a model of PTSD-pain comorbidity, behavioral evaluation, intrathecal drug delivery, immunohistochemistry, Western blotting, and RT-PCR techniques. When detecting visceral sensitivity, the score of the abdominal withdrawal reflex (AWR) induced by graded colorectal distention (CRD) was used. The AWR score was reduced in the SPS day 1 group but increased in the SPS day 7 and SPS day 14 groups at 40 mmHg and 60 mmHg, and the score was increased significantly with EphrinB1-Fc administration. The EphB2+ cell density and EphB2 protein and mRNA levels were downregulated in the SPS day 1 group and then upregulated significantly in the SPS day 7 group; these changes were more noticeable with EphrinB1-Fc administration compared with the SPS-only group. The C-Fos-positive reaction induced by SPS was mainly localized in neurons of the spinal dorsal horn, in which the C-Fos-positive cell density and its protein and mRNA levels were upregulated on SPS days 7 and 14; these changes were statistically significant in the SPS + EphrinB1-Fc group compared with the SPS alone group. The present study confirmed the time window for the AWR value, EphB2 and C-Fos changes, and the effect of EphrinB1-Fc on these changes, which suggests that spinal cord EphB2 activation exacerbates visceral pain after SPS.
Introduction
Post-traumatic stress disorder (PTSD) refers to the persistent psychological disorder that occurs after a person experiences major stress (Sripada et al., Citation2016). Studies have shown that PTSD-like stress is a trigger for the initial onset, exacerbation, or recurrence of irritable bowel syndromes (IBS), characterized by hyperalgesia and allodynia (Iorio et al., Citation2014; Keszthelyi et al., Citation2012; Simren et al., Citation2019). The most representative mechanism of IBS is visceral pain hypersensitivity, with an increase in the frequency and typical intensity of abdominal pain (Johnson et al., Citation2019; Larauche et al., Citation2011). Studies have shown that PTSD and IBS are highly comorbid conditions, especially in military veterans whose comorbidity rates range from 23 to 51% (Harding et al., Citation2018).
Spinal cord sensitization plays an important role in the development of visceral sensitization (Louwies et al., Citation2019; Smith et al., Citation2015), and the mechanisms of primary central sensitization are associated with the continuous increase in neuronal excitability (Campbell & Meyer, Citation2006; Hanamura et al., Citation2017) and the change in neuroplasticity (Kuner, Citation2010; Liu & Zhou, Citation2014). C-Fos in the spinal dorsal horn was identified as a marker of neuronal activation by somatic or visceral nociceptive stimulation (Coggeshall, Citation2005; Harton et al., Citation2017). C-Fos was indeed shown to be a sensitive index representing neuronal excitation and its activity is increased in the central nervous system of IBS patients (Zhang et al., Citation2011). However, the molecular mechanisms underlying the stress-induced modulation of visceral pain remain unknown. The single prolonged stress (SPS) model has been widely used to assess the therapeutic effect of visceral pain related to intense stress (He et al., Citation2013; Sun et al., Citation2017).
Eph receptors are the largest known family of receptor tyrosine kinases (RTKs) (Cisse & Checler, Citation2015). EphrinB2/EphB2 modulates synaptic plasticity by regulating the function of N-methyl-D-aspartic acid (NMDA) receptors in the post-synaptic membrane. Studies have demonstrated that EphB receptors and their EphrinB ligands are present in laminae I-III of the dorsal horn (Bundesen et al., Citation2003; Song, Cao, et al., Citation2008), which distinctly indicates that EphrinB-EphB plays a critical role in the induction and maintenance of neuropathic pain by regulating neural excitability and synaptic activity at the peripheral and central levels (Song, Zheng, et al., Citation2008; Vasileiou et al., Citation2013). In addition, EphrinB-EphB molecules contribute to hyperalgesia through the ERK5/CREB pathway (Yu et al., Citation2017). Therefore the present study aimed to investigate the effects of SPS and EphB2 activation on visceral pain over a time course, and corresponding changes in EphB2 and C-Fos expression in the spinal dorsal horn.
Materials and methods
Experimental animals and groups
All rats were obtained from the Center for Experimental Animals of Sun Yat-sen University (license No. SYXK (Yue) 2015-0107). Animal experiments were approved by the Animal Care and Use Committee of Sun Yat-sen University, China (Zhongshan Medical Ethics 2014 No. 23). Eighty adult male Sprague-Dawley (SD) rats weighing 250-300 g each were used in the present study. The SD rats were individually housed in an air-conditioned room (temperature 22 ± 0.5 °C, relative humidity, 40-70%) under a 12-h light-dark cycle, and had water and food available ad libitum.
Experimental rats were randomly divided into the following 8 groups: a control group without SPS treatment; SPS day 1, day 7, and day 14 groups; a control group with EphrinB1-Fc treatment but without SPS treatment; and SPS + EphrinB1-Fc day 1, day 7, and day 14 groups. Each group included 10 rats, five of which were used for Western blotting and RT-PCR; the others were used for immunohistochemistry experiments. Different animals were sacrificed for use in western blotting/RT-PCR/immunohistochemistry analyses after the behavioral test at each time point
PTSD model
Previous studies induced acute or chronic visceral hyperalgesia through methods, such as water-avoidance stress (Miampamba et al., Citation2007), restraint stress (Sun et al., Citation2006), and maternal/infant separation stress (Rosztoczy et al., Citation2003). In recent years, the SPS model was developed based on previous stress models (Zhang et al., Citation2015) and established as an animal model for PTSD. Briefly, the rats were restrained with a rat restraint device for 2 h, and then forced to swim for 20 min (temperature controlled at 24 ± 1 °C). Following a 15-min rest, the rats were treated with the inhalant anesthetic isoflurane until loss of consciousness was achieved and then allowed to recover. Animals were used in subsequent experiments at different time points after SPS.
Pharmaceutical experiments on animals
EphrinB1-Fc (473-EB-200, R&D Systems, USA) which has been validated in various studies, was used in the present study to bind and activate EphB2 receptors (Davy et al., Citation2004; Wang et al., Citation2005; Yu et al., Citation2012). The IgG FC alone has been tested with no significant effect on the vehicle. It was devoid of any signals displayed by EphrinB2-FC or Enphrin B1-FC fusion protein (Wang et al., Citation2005; Yu et al., Citation2012).
Therefore, the ephrinB1-Fc vehicle was used as its control in the present study according to a previous study that explored the mechanism of spinal nociceptive information (Yu et al., Citation2012). All drugs were dissolved in sterile PBS and injected intrathecally at L4-L5. EphrinB1-Fc (0.5 µg/µl) or vehicle (PBS) was injected into normal rats at different time points (days 1, 7, and 14) after SPS.
Rats were implanted with an indwelling intrathecal catheter to facilitate delivery of the drug or its vehicle intrathecally. The rats were anesthetized by intraperitoneal injection of 2% sodium pentobarbital (50 mg/kg). The gap between L4 and L5 was exposed, and a 25 G needle was inserted into the intrathecal space between L4 and L5 until a tail-flick was elicited, confirming intrathecal placement. A 75% alcohol-flushed polyethylene (PE-10) tube was then inserted 2 cm deep to ensure that the tip was located at the ideal position for spinal lumbar enlargement. The other end of the catheter extending out the back of the neck, and the skin was closed with 2-0 sutures. After awakening, rats were excluded from the study if they showed bilateral lower-limb paralysis, which indicated spinal cord injury. These rats were used in the SPS experiment at the scheduled time after surgery. The rats not included in this study were anesthetized with pentobarbital sodium (intraperitoneal, 50 mg/kg) and euthanized by cervical dislocation.
Visceral sensitivity model
The score of the abdominal withdrawal reflex (AWR) induced by graded colorectal distention (CRD) was used to detect visceral sensitivity. This detected parameter was the behavioral result of visceral sensitivity induced by SPS and served as an evaluation index for the successful establishment of the SPS model. Briefly, after overnight fasting, the rats were anesthetized using isoflurane (3.0%) inhalation. An 8 F catheter with an air bag was lubricated with paraffin oil and inserted into the rectum through the anus. The air bag was placed ∼ l cm from the anus port and fixed at the root of the tail. The caudal end of the catheter was connected to a pressure gauge and an air injection pump with a three-way connector. The rats were placed in an open plexiglass observation box (20 × 15 × 15 cm) in which they could move freely. After regaining consciousness, the rats were allowed to adapt for 30 min. The abdominal withdrawal reflex were recorded at pressures of 10, 20, 40, and 60 mmHg for 20 s followed by 4-min interstimulus intervals, and the measurements were repeated 3 times. The AWR was scored as follows: (0) no behavioral response; (1) brief head movement followed by immobility; (2) contraction of the abdominal muscles; (3) lifting of the abdomen; and (4) arching of the body and lifting of the pelvic structures. During testing, the behavior data were observed, recorded, and analyzed by two who were completely blinded to the treatment conditions.
Animal treatments and acquisition of tissue samples
The rats were anesthetized with 2% sodium pentobarbital (intraperitoneal, 50 mg/kg) and transcardially perfused with 0.9% saline (400 ml), followed by 400 ml of 4% paraformaldehyde-15% saturated picric acid in 0.1 M PB (phosphate buffer, PB; pH 7.4). The lumbosacral spinal cord was quickly removed and immersed in 4% paraformaldehyde-15% saturated picric acid in 0.1 M PB overnight at 4 °C and then sectioned at a thickness of 30 μm using a vibratome (catalog no. VT1200S, Leica, Germany).
Immunohistochemistry and immunofluorescence experiments
For immunohistochemistry staining, sections were washed with PBS, pretreated with 0.3% H2O2 in 0.1 M PB (pH 7.4) for 30 min and then incubated for 48 h at 4 °C with primary antibodies (mouse anti-EphB2, 1:500, MABN726, Millipore, USA; rabbit anti-C-Fos, 1:400, bs10172R, Bioss, China) in PBS containing 1% BSA and 0.3% Triton X-100. Then, the sections were washed and incubated for 2 h at room temperature with the following secondary antibodies: biotinylated donkey-anti-mouse IgG (1:100, 715-065-150, Jackson, USA) and biotinylated goat-anti-rabbit IgG (1:100, BA1000, Vector Labs, USA). The sections were washed and then incubated for 2 h at room temperature with avidin-biotin solution (1:200, PK-6100, VECTOR Labs, USA). Then, the sections were washed and immersed in PBS containing 0.05% diaminobenzidine (DAB, D5637, Sigma, USA) and 0.01% H2O2 for 5–15 min. Finally, the sections were washed with PBS to stop the reaction. Each section was washed three times for 5 min per wash. The sections were mounted on gelatin-coated slides, air-dried, dehydrated with gradient concentrations of ethanol (50, 75, 85, 90, 95, and 100%), cleared with xylene, and covered with neutral balsam for microscopic examination.
For immunofluorescence analysis, the sections were washed with PBS and then incubated for 48 h at 4 °C with a mixture of mouse anti-EphB2 (1:500, MABN726, Millipore, USA) and rabbit anti-NeuN (1:800, ab177487, Abcam, UK) and with a mixture of rabbit anti-C-Fos (1:400, bs10172R, Bioss, China) and mouse-NeuN (1:800, MAB377, Millipore, USA). Then, the sections were washed and incubated with a mixture of CY5 donkey anti-rabbit (1:500, A-31573, Invitrogen, USA) and FITC donkey anti-mouse (1:500, A16018, Ingen, USA) for 3 h at room temperature. Finally, the sections were washed mounted on gelatin-coated slides and coverslipped with Fluoro-Gel with TES buffer to be examined using confocal microscopy analysis. The antibodies were selected according to our previous studies (Chen et al., Citation2016; Zhu et al., Citation2020) and others’ reports (Rong et al., Citation2020; Liu et al., Citation2017; Joo et al., Citation2017; O'Brien & Austin, Citation2019; Zhang et al., Citation2017).
Western blotting
Animals were anesthetized with sodium pentobarbital (50 mg/kg, i.p.) and sacrificed by decapitation. Then, the lumbosacral spinal cord was quickly removed and homogenized in RIPA buffer containing protease inhibitors. The homogenate was centrifuged at 25,000 rpm for 20 min at 4 °C, and the supernatant was collected. Then, samples were separated by 10% SDS-PAGE and transferred onto PVDF membranes (IPVH00010, Millipore, USA). The membranes were blocked with 5% skim milk for 2 h at room temperature and incubated overnight at 4 °C with the following primary antibodies: mouse anti-EphB2 (1:1000, MABN726, Millipore, USA), rabbit anti-C-Fos (1:1000, bs10172R, Bioss, China), and rabbit anti-GAPDH (1:5000, AF7021, Affinity, USA). Then, the membranes were incubated with HRP-conjugated goat anti-mouse IgG (1:5000, AB97023, Abcam, UK) and goat anti-rabbit IgG (1:5000, AP307P, Millipore, USA) for 2 h at room temperature. The immunoreactive bands were visualized with a chemiluminescent HRP substrate (WBKLs0500, Millipore, USA). The antibodies were selected according to our previous studies (Zhu et al., Citation2019) and others’ reports (Lee et al., Citation2020; Rong et al., Citation2020).
Real-time PCR
The lumbosacral spinal cord was dissected quickly. Total RNA was extracted using TRIzol Reagent (G3013, Servicebio, China) and reverse transcribed into cDNA using a Revert Aid First Strand cDNA Synthesis Kit (#1622, Thermo, USA) according to the manufacturer’s recommendations. Quantitative RT-PCR analysis was performed using FastStart Universal SYBR Green Master Mix (Rox) (04913914001, Roche, Switzerland) in a Step One Plus apparatus (ABI, USA). The following primers were used:
EphB2 forward, 5′-AGATGAAGTTCTCGGTGCGT-3′;
EphB2 reverse, 5′-GGTAGAAACCATTGCGGGAC-3′;
C-Fos forward, 5′-GTTTCAACGCGGACTACGAG-3′;
C-Fos reverse, 5′-TTGGCACTAGAGACGGACAG-3′;
GAPDH forward, 5′-CCTCGTCTCATAGACAAGATGGT-3′;
GAPDH reverse, 5′-GGGTAGAGTCATACTGGAACATG-3′.
Finally, the 2−ΔΔCt method was used to calculate the fold changes in the expression of the target mRNA compared with their expression in the control group.
Statistical analysis
Our experimental detection focused on the dorsal horn of the lumbar spinal cord. In immunohistochemistry and immunofluorescence experiments, three sections were selected from each rat in each group, and three non-overlapping regions that were 0.01 mm2 in size were randomly selected. The total number of positive cells in this region was counted as the cell density. Western blotting was performed using a chemiluminescence imaging system, and the data obtained by RT-PCR were processed according to the 2−△△Ct method. All experimental data are presented as the means ± SEM and were subjected to a general linear model (univariate) followed by the LSD post-hoc test. All analyses were performed with SPSS 20.0 software and p < 0.05 was considered statistically significant.
Results
Our experimental data showed no difference between the SPS groups and SPS-Vehicle groups (Supplementary Figure 1). Therefore, the present data and statistical analyses were only provided for the following groups in the text unless otherwise indicated: control group, SPS day 1 group, SPS day 7 group, SPS day 14 group, and control + EphrinB1-Fc group, SPS day 1 + EphrinB1-Fc group, SPS day 7 + EphrinB1-Fc group, and SPS day 14 + EphrinB1-Fc group.
The effect of SPS and EphrinB1-Fc on visceral sensitization
The present study applied the AWR score to evaluate the visceral sensitization of experimental rats. The statistical data showed that at 40 mm Hg and 60 mmHg, the AWR score was reduced in the SPS day 1 group (40 mmHg: 1.77 ± 0.10 vs. 2.47 ± 0.07, p < 0.001; 60 mmHg: 2.07 ± 0.12 vs. 2.64 ± 0.09, p < 0.001), while this score was increased in the SPS day 7 group (40 mmHg: 3.13 ± 0.07 vs. 2.47 ± 0.07, p < 0.001; 60 mmHg: 3.30 ± 0.06 vs. 2.64 ± 0.09, p < 0.001) and the SPS day 14 group (40 mmHg: 2.80 ± 0.09 vs. 2.47 ± 0.07, p < 0.001; 60 mmHg: 3.00 ± 0.09 vs. 2.64 ± 0.09, p < 0.001) compared with that in the control group (general linear model (univariate) followed by the LSD post-hoc comparison test; ), this score was a most significant increase in the SPS day 7 group. However, at 10 mmHg and 20 mmHg, no significant differences were observed between any of the groups and the control group (all p > 0.05, ).
Figure 1. Detection and comparison of the abdominal withdrawal reflex (AWR) induced by graded colorectal distention (CRD). *p < 0.05, the SPS-only group at each time point compared with the control group, and the SPS + EphrinB1-Fc group at each time point compared with the control + EphrinB1-Fc group. ★p < 0.05, comparison among the three groups on day 1, day 7, and day 14 in the SPS-only group and SPS + EphrinB1-Fc group, respectively. ▲p < 0.05, comparison between the SPS-only group and the SPS + EphrinB1-Fc group at each time point. Ten rats/group. The data are presented as the mean ± SEM.
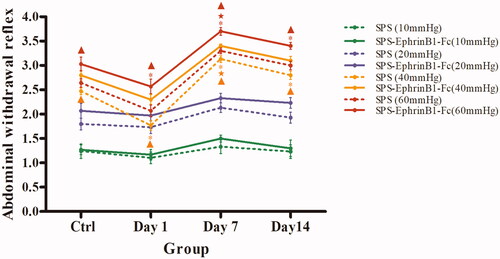
Further experiments involving the intrathecal administration of EphrinB1-Fc, an EphB2 agonist, showed that at 40 and 60 mmHg, the AWR value was reduced in the SPS day 1 + EphrinB1-Fc group (40 mm Hg: 2.30 ± 0.10 vs. 2.80 ± 0.10; 60 mmHg: 2.57 ± 0.15 vs. 3.03 ± 0.14) but increased in the day 7 group (40 mmHg: 3.40 ± 0.04 vs. 2.80 ± 0.10; 60 mmHg: 3.70 ± 0.07 vs. 3.03 ± 0.14) and the day 14 group (40 mmHg: 3.10 ± 0.09 vs. 2.80 ± 0.10; 60 mmHg: 3.40 ± 0.07 vs. 3.03 ± 0.14) compared with the Ctrl + EphrinB1-Fc group (general linear model (univariate) followed by the LSD post-hoc comparison test; ). Comparison of the SPS-only and SPS + EphrinB1-Fc groups showed that the AWR value was significantly different in the corresponding time groups at both 40 mmHg (all p < 0.05) and 60 mmHg (all p < 0.05; general linear model (univariate) followed by the LSD post-hoc comparison test; ), with the most significant difference being in the SPS day 7 + EphrinB1-Fc group. Nevertheless, no significant differences were observed between the SPS-only and SPS + EphrinB1-Fc group at any of the time points analyzed at either 10 mmHg (p > 0.05) or 20 mmHg (p > 0.05, ).
The effect of SPS and EphrinB1-Fc on spinal cord EphB2
Morphological changes in EphB2-positive cells induced by SPS and EphrinB1-Fc
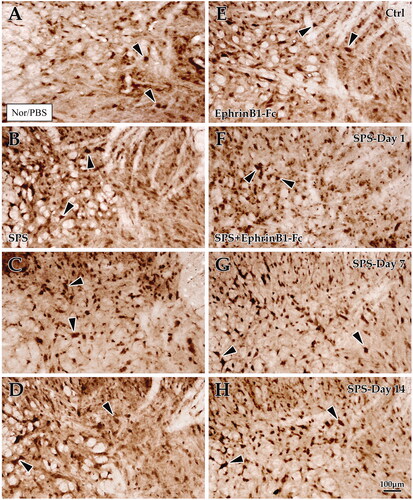
Observation by light microscopy showed that EphB2+ cells were densely distributed in the dorsal horn of the lumbar spinal cord. Statistical data showed that the EphB2+ cell density declined in the SPS day 1 group (15.42 ± 0.46) and increased in the SPS day 7 group (20.71 ± 0.60) compared with the control group (17.51 ± 0.52), but there was no difference in the SPS day 14 group (18.87 ± 0.41; p = 0.65; ). With EphrinB1-Fc administration, the change of EphB2+ cell density was fundamentally consistent with that in the SPS-only group at different time points; the EphB2+ cell density was decreased in the SPS day 1 + EphrinB1-Fc group (17.33 ± 0.47) but increased in the SPS day 7 + EphrinB1-Fc group (23.13 ± 0.50) and SPS day 14 + EphrinB1-Fc group (22.00 ± 0.49) but increased in the Ctrl + EphrinB1-Fc group (20.42 ± 0.65; all p < 0.05; ). Moreover, significant differences were observed between the SPS-only group and the SPS + EphrinB1-Fc group at each time point (all p < 0.05; General Linear Model (Univariate); ).
Figure 2. Immunohistochemical exploration of EphB2 in the spinal dorsal horn. Panels (A–D) show EphB2+ cells in the dorsal horn of the lumbar cord of the control group (A), Day 1 group (B), Day 7 group (C), and Day 14 group (D) in SPS. Panels (E–H) correspond to the SPS + EphrinB1-Fc of the control group (E), Day 1 group (F), Day 7 group (G), and Day 14 group (H). “Ctrl” corresponds to the control, and Day 1, Day 7, and Day 14 correspond to days 1, 7, 14 after SPS, respectively. All images are at the same magnification, scale bar = 100 μm. Black arrows indicate positive cells.
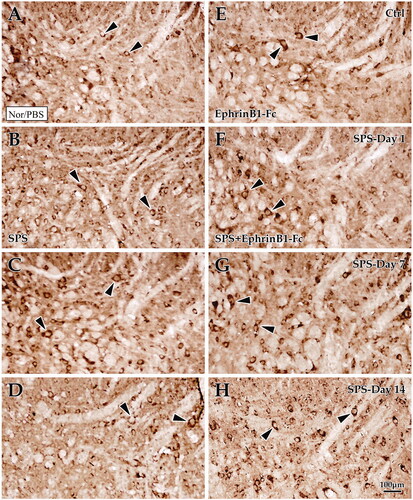
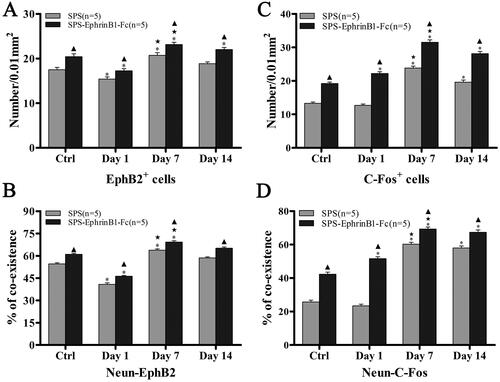
Figure 3. Enumeration and comparison data for EphB2+ and C-Fos + cells. Histograms (A) and (B) showing the comparison results of the numbers of EphB2+ cells and the coexistence rates of NeuN-EphB2 in the different groups; differences were observed among them, especially in the Day 7 group. Histogram (C) showing the comparison result of the numbers of C-Fos + cells; the Day 7 group had the most remarkable changes, and they were more obvious in the SPS + EphrinB1-Fc treatment group than in the SPS-only groups. The histogram (D) (double labeling data for NeuN-C-Fos) showed that the change trend was basically consistent with the results of single-label immunohistochemistry. *p < 0.05, ★p < 0.05, ▲p < 0.05 as same as . Five rats/group. The data are presented as the mean ± SEM.
Immunofluorescence double labeling was used to confirm the types of cells with an EphB2-positive reaction. Experimental exploration showed that an EphB2-positive reaction occurred mainly in NeuN-positive cells (a specific marker of neurons). Statistical data showed that the EphB2-NeuN double-labeling rate was lower in the SPS day 1 group (40.80 ± 1.04%) but higher in the SPS day 7 group (63.76 ± 0.90%) and day 14 group (58.58 ± 0.07%) than in the control group (54.53 ± 0.82%; all p < 0.001; ). The change trends in the SPS + EphrinB1-Fc groups was fundamentally the same as that of the SPS-only group; the EphB2-NeuN colabeling rate was decreased in the SPS day 1 + EphrinB1-Fc group (46.20 ± 0.59%) but increased in the SPS day 7 + EphrinB1-Fc group (69.22 ± 0.87%) and SPS day 14 + EphrinB1-Fc group (65.07 ± 0.84%) compared with that of the Ctrl + EphrinB1-Fc group (61.02 ± 0.70%; all p < 0.001; ). By comparing the SPS-only group and the SPS + EphrinB1-Fc group at each time point, the EphB2-NeuN colabeling rate was significantly increased when EphrinB1-Fc was administered (all p < 0.001; General Linear Model (Univariate); ).
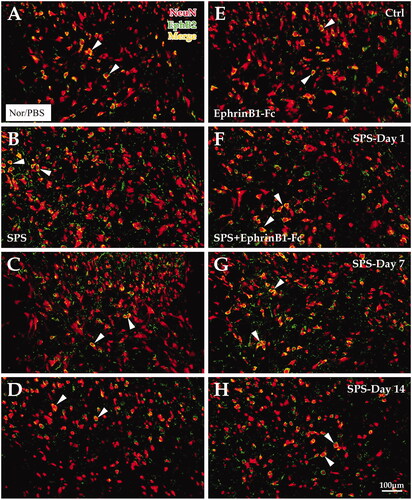
Figure 4. Immunofluorescence double-labeling experiment for NeuN and EphB2. The image shows the immunofluorescence double markers (yellow) of NeuN (red) and EphB2 (green). Panels A-H show the SPS and SPS + EpheinB1-Fc groups, respectively. Panels (A–D) show EphB2+ and NeuN + cells in the dorsal horn of the lumbar cord of the control group (A), Day 1 group (B), Day 7 group (C), and Day 14 group (D) in SPS. Panels (E–H) correspond to the SPS + EphrinB1-Fc of the control group (E), Day 1 group (F), Day 7 group (G), and Day 14 group (H). The abbreviations in this figure are the same as those in , and all the images are at the same magnification; scale bar = 100 μm. White arrows indicate double-labeled cells.
Protein and mRNA level changes affected by SPS and EphrinB1-Fc
EphB2 protein levels were detected by Western blotting. The EphB2 protein level was decreased in the SPS day 1 group (0.74 ± 0.04) but increased in the SPS day 7 group (1.21 ± 0.03), and there was no apparent change in the SPS day 14 group (1.01 ± 0.03) compared with that in the control group (p < 0.001, p < 0.001, p = 0.739; ). Comparisons among the groups showed that the most significant change in EphB2 was in the SPS day 7 group. With EphrinB1-Fc administration, the EphB2 protein level changed with the time of SPS, and the trend was fundamentally similar to that in the SPS alone group; results compared with the Ctrl + EphrinB1-Fc group (1.17 ± 0.03), the EphB2 protein level was reduced in the SPS day 1 + Ephrin-Fc group (0.97 ± 0.03), increased in the SPS day 7 + Ephrin-Fc group (1.36 ± 0.04), and not significantly different from that in the SPS day 14 + Ephrin-Fc group (1.19 ± 0.01; p < 0.001, p < 0.001, p = 0.641, respectively; ). Moreover, the comparison between the SPS-only and the SPS + EphrinB1-Fc groups showed that there were significant differences observed at each time point (p < 0.001; General Linear Model (Univariate); ).
Figure 5. Detection and comparison of the protein and mRNA levels of EphB2 and C-Fos. Panels (A,B) show that the EphB2 and C-Fos protein levels were reduced in the day 1 group but increased in the day 7 group compared with their control groups, respectively. With the administration of EphrinB1-Fc, their protein levels were distinctly upregulated. Histograms (C) and (D) showing the comparison of the EphB2 and C-Fos mRNA levels in the different groups, respectively; the statistical results showed that the EphB2 and C-Fos mRNA levels were upregulated by SPS induction and increased further with EphrinB1-Fc treatment. *p < 0.05, ★p < 0.05, ▲p < 0.05 as described for . Five rats/group. The data are presented as the mean ± SEM.
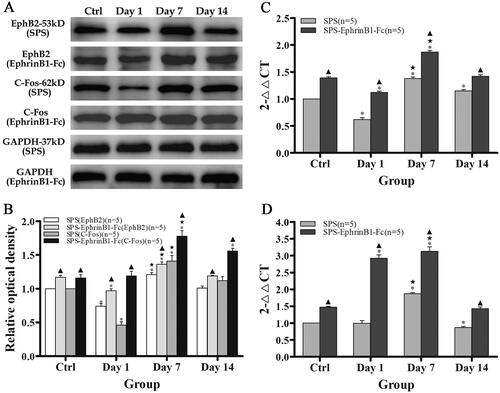
RT-PCR was used to detect changes in EphB2 mRNA expression induced by SPS and EphrinB1-Fc. EphB2 mRNA expression was downregulated in the SPS day 1 group (0.62 ± 0.01) and upregulated in the SPS day 7 group (1.38 ± 0.01) and SPS day 14 group (1.15 ± 0.01) compared with the control group (all p < 0.001, ). With EphrinB1-Fc administration, EphB2 mRNA expression was downregulated in the SPS day 1 + EphrinB1-Fc group (1.12 ± 0.01) but upregulated in the SPS day 7 + EphrinB1-Fc group (1.87 ± 0.01) and not significantly changed in the SPS day 14 + EphrinB1-Fc group (1.42 ± 0.01) compared with the Ctrl + EphrinB1-Fc group (1.39 ± 0.01; p < 0.001, p < 0.001, p = 0.075, ). Further comparison showed that the SPS + EphrinB1-Fc group had significantly higher EphB2 mRNA levels than the SPS-only group at each corresponding time point (p < 0.001; General Linear Model (Univariate), ).
The effect of SPS and EphrinB1-Fc on spinal cord C-Fos
Morphological changes in C-Fos + cells affected by SPS and EphrinB1-Fc
Immunohistochemical examination of C-Fos in the normal spinal gray matter revealed a weak response, especially in the superficial layer of the dorsal horn (). Statistical analyses showed that C-Fos + cell density was significantly increased in the SPS day 7 group (23.84 ± 0.57) and day 14 group (19.62 ± 0.64) compared with the control group (13.29 ± 0.41), but there was no significant difference in C-Fos + cell density in the SPS day 1 group compared with that of the control (12.69 ± 0.38; p < 0.001, p < 0.001, p = 0.447; ). To confirm the effect of EphB2 on spinal cord C-Fos in the pathological process of visceral sensitization, the EphB2 agonist EphrinB1-Fc was used in this experiment. The results showed that with EphrinB1-Fc administration, the C-Fos + cell density was slightly increased in the SPS day 1 + EphrinB1-Fc group (22.22 ± 0.52) and markedly increased in the SPS day 7 + EphrinB1-Fc group (31.51 ± 0.74) and SPS day 14 + EphrinB1-Fc group (28.13 ± 0.65) compared with the Ctrl + EphrinB1-Fc group (19.20 ± 0.44, all p < 0.001; ). Crucially, EphrinB1-Fc treatment induced a dramatic increase in C-Fos + cell density for each time group (p < 0.001; General Linear Model (Univariate); ).
Figure 6. Immunohistochemical exploration of C-Fos in the spinal dorsal horn. Panels (A–D) show C-Fos + cells in the dorsal horn of the lumbar cord of the control group (A), Day 1 group (B), Day 7 group (C), and Day 14 group (D) in SPS. Panels (E–H) correspond to the SPS + EphrinB1-Fc of the control group (E), Day 1 group (F), Day 7 group (G), and Day 14 group (H). “Ctrl” corresponds to the control, and Day 1, Day 7, and Day 14 correspond to days 1, 7, 14 after SPS, respectively. All images are at the same magnification, scale bar = 100 μm. Black arrows indicate positive cells.
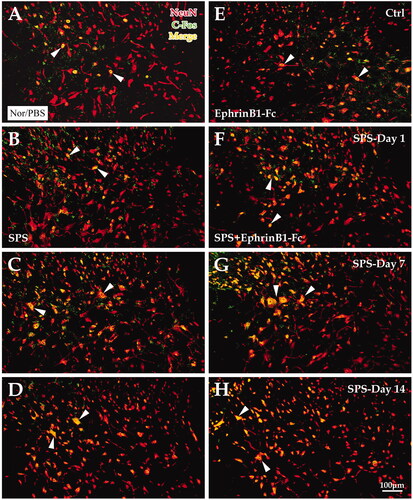
Fluorescence double labeling for C-Fos and NeuN showed that the C-Fos-positive reaction was mainly observed in NeuN-positive neurons. The enumeration data showed that the percentage of C-Fos-NeuN-positive cells was not significantly changed in the SPS day 1 group (23.40 ± 1.00%) but was significantly increased in the SPS day 7 group (60.20 ± 1.17%) and day 14 group (57.96 ± 1.21%) compared to the control group (25.73 ± 1.02%, p = 0.164, p < 0.001, p < 0.001, LSD post-hoc comparison, respectively; ). With EphrinB1-Fc administration, the colabeling rate was observably increased in the SPS day 1 + EphrinB1-Fc group (51.64 ± 1.16%), SPS day 7 + EphrinB1-Fc group (69.27 ± 1.23%), and SPS day 14 + EphrinB1-Fc group (67.36 ± 1.39%) compared with the Ctrl + EphrinB1-Fc group (42.31 ± 1.25%; all p < 0.001, LSD post-hoc comparison, respectively; ). Nevertheless, the comparison between the SPS-only group and the SPS + EphrinB1-Fc group showed significant differences in the colabeling rate at each time point (all p < 0.001; General Linear Model (Univariate), ).
Figure 7. Immunofluorescence double-labeling experiment for NeuN and C-Fos. The image shows the immunofluorescence double markers (yellow) of NeuN (red) and C-Fos (green). Panels A-H show the SPS and SPS + EpheinB1-Fc groups, respectively. Panels (A–D) show C-Fos + and NeuN + cells in the dorsal horn of the lumbar cord of the control group (A), Day 1 group (B), Day 7 group (C), and Day 14 group (D) in SPS. Panels (E–H) correspond to the SPS + EphrinB1-Fc of the control group (E), Day 1 group (F), Day 7 group (G), and Day 14 group (H). All the images are at the same magnification; scale bar = 100 μm. White arrows indicate double-labeled cells.
Changes in C-Fos protein and mRNA levels induced by SPS and EphrinB1-Fc
The Western blotting data showed that the C-Fos protein expression was significantly downregulated in the SPS day 1 group (0.46 ± 0.05) and upregulated in the SPS day 7 group (1.41 ± 0.08) compared with the control group. Meanwhile, there was no significant difference in C-Fos protein expression between the SPS day 14 group (1.12 ± 0.06) and the control group (p < 0.001, p = 0.001, p = 0.131, ). With EphrinB1-Fc administration, C-Fos protein levels in the SPS day 7 + EphrinB1-Fc group (1.78 ± 0.08, p < 0.001) and SPS day 14 + EphrinB1-Fc group (1.56 ± 0.04, p < 0.001) were higher than those in the Ctrl + EphrinB1-Fc group (1.16 ± 0.05), and the highest levels were observed in the SPS day 7 + EphrinB1-Fc group (p < 0.001; ). The comparison between the SPS-only group and the SPS + EphrinB1-Fc group showed that the C-Fos protein level was higher in the SPS + EphrinB1-Fc groups than in the SPS-only group at each corresponding time point (p < 0.001; General Linear Model (Univariate); ). In addition, a significant difference in C-Fos protein levels was observed in the SPS + EphrinB1-Fc day 7 group ().
The RT-PCR experimental results showed that C-Fos mRNA expression was upregulated in the SPS day 7 group (1.87 ± 0.01) and slightly reduced in the SPS day 14 group (0.87 ± 0.01) compared with the control group, but no differences were observed between the control and SPS day 1 groups (0.99 ± 0.02; p < 0.001, p < 0.001, p = 0.604, ). With EphrinB1-Fc administration, C-Fos mRNA expression was upregulated in the SPS day 1 + Ephrin-Fc group (2.92 ± 0.03) and the SPS day 7 + Ephrin-Fc group (3.13 ± 0.03), but no significant difference was observed in the SPS day 14 + Ephrin-Fc group (1.43 ± 0.01) compared with that of the Ctrl + EphrinB1-Fc group (1.47 ± 0.01; p < 0.001, p < 0.001, p = 0.110, ). The comparison between the SPS-only group and the SPS + EphrinB1-Fc group showed that EphrinB1-Fc administration markedly upregulated C-Fos mRNA expression at each time point (p < 0.001; General Linear Model (Univariate); ).
Discussion
The present study aimed to clarify whether EphB2 was involved in visceral sensitization induced by SPS and if so, to further identify its mechanism. Our results confirmed that the changes in AWR values, EphB2, and C-Fos induced by SPS showed dynamic and obvious time-course associations, and the change trends of the AWR values and C-Fos were associated with that of EphB2, especially the effect trend of activating EphB2 in the dorsal horn. The SPS model in our experiment proved to be effective and successful, as demonstrated by the CRD-AWR test; the AWR values decreased on the 1st day after SPS and increased on the 7th and 14th days, with a more significant increase on day 7 than on day 14. The time-course change in this study was consistent with that in previous studies; that is, the visceral sensitivity of rats was decreased significantly at 1 day after SPS and began to increase at 6 days after SPS, with an especially increase at 7 days after SPS.
The sensitization of visceral nociceptive neurons in conditions of inflammation, damage, or stress reduces their activation threshold and enhances their responsiveness to stimuli, leading to allodynia and hyperalgesia (Cervero, Citation2009; Creekmore et al., Citation2018). As the subject of the present study, the EphrinB2/Ephb2 family is thought to be involved in the regulation of various pain types, including neurogenic, nociceptive, and inflammatory pain (Cao et al., Citation2008; Ruan et al., Citation2010; Zhou, Zhang, et al., Citation2015), and the latest research suggests that EphrinB2/EphB2 colocalization in the enteric nervous system (ENS) is involved in the mechanism of intestinal pain in IBS (Cao et al., Citation2008; Ruan et al., Citation2010; Zhou, Zhang, et al., Citation2015). However, studies on EphrinB2/EphB2 activation in the spinal cord in the context of visceral pain induced by PTSD are rarely reported. Our experiment showed that the visceral sensitivity change induced by SPS was consistent with that of EphB2 in the spinal dorsal horn. The present study showed that the expression of EphB2 was downregulated at 1 day after SPS, which may be potentially a mechanism of stress-induced analgesia. Rats treated with SPS experienced temporary visceral analgesia on day 1 after SPS exposure, which may have been mediated by the activation of downward-inhibiting pain pathways as well as by the activation of a large number of neurotransmitters and neuropeptides, such as endogenous opioids, monoamines, cannabinoids, and glutamate systems (Gosselin et al., Citation2010; He et al., Citation2017; Larauche et al., Citation2012). SPS is harmful to neurons, and most neurons expressing EphB2 receptors are injury-specific (Gosselin et al., Citation2010; He et al., Citation2017; Larauche et al., Citation2012). EphB2 expression was dramatically increased at 7 days after SPS and sustained for 14 days. This finding indicates that Ephb2 in the spinal cord is an important regulator that boosts neuronal activity in nociceptive signaling pathways. C-Fos involvement of the spinal cord was confirmed in peripheral chronic nociceptive stimulation (Coggeshall, Citation2005; Tabata et al., Citation2018). Therefore, the present study proved the C-Fos changes in the pathological process of visceral sensitization; C-Fos was increased on the 7th day after SPS and continued to the 14th day, with a noticeable time window. These results indicate that the expression of C-Fos was closely associated with visceral pain. Moreover, C-Fos was correlated with neuronal activation (Takasu et al., Citation2002; Xia et al., Citation2014), and our study favored the effect of C-Fos on neuronal activity during visceral pain sensation. Thus, the C-Fos changes induced by SPS observed herein hinted at changes in neuronal activity in the spinal dorsal horn.
EphrinB1-Fc (an EphB2 agonist) was intrathecally injected to assess the EphB2 effect on visceral sensitivity induced by SPS. Our results showed that with EphrinB1-Fc administration, the changing trend of the time course for the AWR score, EphB2, and C-Fos was basically similar to that of SPS alone at different time points. However, the changes were more observable at each corresponding time point compared with those induced by SPS alone. Because of the absence of the Fc group, which has been reported to have an effect on sensory neurons, we could not completely rule out the effect of Fc. However, various studies have provided evidence that Fc in the spinal cord has no effect on the pathological mechanism of pain (Liu et al., Citation2011; Song, Zheng, et al., Citation2008; Yu et al., Citation2012). Thus, our present results preliminarily indicated that EphB2 activation strengthens the symptoms of visceral pain and that C-Fos strengthened by EphB2 modulates the degree of neuronal activity in the spinal dorsal horn during the process of visceral sensitivity changes. EphrinB2/EphB2 promotes glu-induced post-synaptic Ca2+ influx by enhancing post-synaptic NR2B function, which activates the expression of the Ca2+-regulated early immediate gene (Takasu et al., Citation2002). Additionally, Ephb2 receptor activation can induce the recruitment and activation of NMDAR receptors, causing the phosphorylation of CREB protein, thereby increasing the expression of the neuronal activation marker C-Fos and promoting the transmission of nociceptive information (Yu et al., Citation2017). This ligand-receptor interaction regulates synaptic efficacy by the NMDAR receptor and further transduces synaptic input into prolonged signals in different chronic pain models (Blanke & VanDongen, Citation2009; Theofanous et al., Citation2020; Zhao et al., Citation2010). Indeed, intrathecal injection of exogenous EphrinBs activated the EphB1/2 receptor and enhanced the spinal reflexes to produce hyperalgesia (Yang et al., Citation2018; Zhou, Wang, et al., Citation2015a, Citation2015b). Moreover, the intrathecal injection of EphrinBs-Fc into mice resulted in dose- and time-dependent hyperalgesia with increased C-Fos expression in the spinal cord (Yu et al., Citation2012). In brief, the role of ephrinB2/EphBs in pain signaling mainly depends on the regulation of both neuronal excitability and spinal synaptic plasticity via effects on spinal NMDARs (Battaglia et al., Citation2003; Song, Zheng, et al., Citation2008). Our experiments were consistent with previous studies in other animal models, which suggested that EphB2 participated in this pathological process during changes in visceral sensitivity. Although changes in the EphB2 protein level have been observed via different methods, this study does have some limitations. Regarding the EphB2 antibody, a negative control was examined, but the positive control results was lacking. Future work needs the validation.
In summary, the present results confirmed that changes in the AWR values, EphB2, and C-Fos induced by SPS showed dynamic and obvious time-course associations, and these changes were aggravated by EphrinB1-Fc administration, suggesting that spinal cord EphB2 is involved in the PTSD pathological process induced by SPS.
Author contributions
TC, SC, LSOY, and WLL were involved in the conceptualization of the study. TC, SC, and XFZ were involved in the animal model experiments. SC and XFZ were involved in the morphological test. TC, YFZ, and LJJ were involved in Western blot. TC, SC, and ZYH were involved in the analysis of the dataset. SC and WLL contribute to the study resources. SC, LSOY, and WLL contribute to the funding acquisition. The draft manuscript was written, reviewed, and edited by TC, SC, and WLL. All authors contributed to and approved the final manuscript.
Supplemental Material
Download Zip (1 MB)Disclosure statement
The authors report that they have no biomedical financial interests or potential conflicts of interest to disclose.
Additional information
Funding
Notes on contributors
Tao Chen
Tao Chen, graduated from the Department of Anatomy, Zhongshan School of Medicine, Sun Yat-sen University with a master's degree and engaged the research of stress-induced pain. Now she is studying for a doctor's degree in the Key Laboratory of Tropical Disease Control of Ministry of Education, Sun Yat-sen University.
Si Chen
Dr. Si Chen is a lecturer of Department of Human Anatomy and Histology & Embryology, Zhuhai Campus of Zunyi Medical University. She specializes in stress-induced disease, PTSD and social disorder pathological mechanism.
Xuefeng Zheng
Dr. Xuefeng Zheng is a lecturer of Neuroscience Laboratory for Cognitive and Developmental Disorders, Department of Anatomy, Medical College of Jinan University. He specializes in prevention and treatment of neurodegenerative diseases.
Yaofeng Zhu
Dr.Yaofeng Zhu graduated from the Department of Anatomy of Zhongshan Medical University and is engaged in the research of neurodegenerative diseases and stress-induced pain. His research focus on prevention and treatment of PD and HD.
Ziyun Huang
Ziyun Huang, graduated from the Department of Anatomy, Zhongshan School of Medicine, Sun Yat-sen University with a master's degree and engaged the research of treatment of stress-induced pain.
Linju Jia
Linju Jia, graduated from the Department of Anatomy, Zhongshan School of Medicine, Sun Yat-sen University with a master's degree and engaged the research of treatment of stress-induced pain.
Lisi OuYang
Dr. Lisi Ouyang is a senior lecturer of anatomy at Sun Yat-sen University. She specializes in neuroanatomy,neurobiology, degenerative and infectious diseases in nervous system.
Wanlong Lei
Dr. Wanlong Lei is a professor of Department of Anatomy, Sun Yat-sen University. He specializes in human anatomy, neuroanatomy and neurobiology. Recent years, the research group focus on the role of basal ganglia and the spinal cord in the mechanisms of PD,HD and stress-induced disease.
References
- Battaglia, A. A., Sehayek, K., Grist, J., McMahon, S. B., & Gavazzi, I. (2003). EphB receptors and ephrin-B ligands regulate spinal sensory connectivity and modulate pain processing. Nature Neuroscience, 6(4), 339–340. https://doi.org/10.1038/nn1034
- Blanke, M. L., & VanDongen, A. (2009). Activation mechanisms of the NMDA receptor.
- Bundesen, L. Q., Scheel, T. A., Bregman, B. S., & Kromer, L. F. (2003). Ephrin-B2 and EphB2 regulation of astrocyte-meningeal fibroblast interactions in response to spinal cord lesions in adult rats. The Journal of Neuroscience, 23(21), 7789–7800. https://doi.org/10.1523/JNEUROSCI.23-21-07789.2003
- Campbell, J. N., & Meyer, R. A. (2006). Mechanisms of neuropathic pain. Neuron, 52(1), 77–92. https://doi.org/10.1016/j.neuron.2006.09.021
- Cao, J. L., Ruan, J. P., Ling, D. Y., Guan, X. H., Bao, Q., Yuan, Y., Zhang, L. C., Song, X. J., & Zeng, Y. M. (2008). Activation of peripheral ephrinBs/EphBs signaling induces hyperalgesia through a MAPKs-mediated mechanism in mice. Pain, 139(3), 617–631. https://doi.org/10.1016/j.pain.2008.06.023
- Cervero, F. (2009). Visceral versus somatic pain: similarities and differences. Digestive Diseases, 27(Suppl 1), 3–10. https://doi.org/10.1159/000268115
- Chen, S., Yang, G., Zhu, Y., Liu, Z., Wang, W., Wei, J., Li, K., Wu, J., Chen, Z., Li, Y., Mu, S., OuYang, L., & Lei, W. (2016). A comparative study of three interneuron types in the rat spinal cord. PLOS One, 11(9), e162969.
- Cisse, M., & Checler, F. (2015). Eph receptors: New players in Alzheimer's disease pathogenesis. Neurobiology of Disease, 73, 137–149. https://doi.org/10.1016/j.nbd.2014.08.028
- Coggeshall, R. E. (2005). Fos, nociception and the dorsal horn. Progress in Neurobiology, 77(5), 299–352. https://doi.org/10.1016/j.pneurobio.2005.11.002
- Creekmore, A. L., Hong, S., Zhu, S., Xue, J., & Wiley, J. W. (2018). Chronic stress-associated visceral hyperalgesia correlates with severity of intestinal barrier dysfunction. Pain, 159(9), 1777–1789. https://doi.org/10.1097/j.pain.0000000000001271
- Davy, A., Aubin, J., & Soriano, P. (2004). Ephrin-B1 forward and reverse signaling are required during mouse development. Genes & Development, 18(5), 572–583. https://doi.org/10.1101/gad.1171704
- Gosselin, R. D., O'Connor, R. M., Tramullas, M., Julio-Pieper, M., Dinan, T. G., & Cryan, J. F. (2010). Riluzole normalizes early-life stress-induced visceral hypersensitivity in rats: Role of spinal glutamate reuptake mechanisms. Gastroenterology, 138(7), 2418–2425. https://doi.org/10.1053/j.gastro.2010.03.003
- Hanamura, K., Washburn, H. R., Sheffler-Collins, S. I., Xia, N. L., Henderson, N., Tillu, D. V., Hassler, S., Spellman, D. S., Zhang, G., Neubert, T. A., Price, T. J., & Dalva, M. B. (2017). Extracellular phosphorylation of a receptor tyrosine kinase controls synaptic localization of NMDA receptors and regulates pathological pain. PLOS Biology, 15(7), e2002457. https://doi.org/10.1371/journal.pbio.2002457
- Harding, K., Simpson, T., & Kearney, D. J. (2018). Reduced symptoms of post-traumatic stress disorder and irritable bowel syndrome following mindfulness-based stress reduction among veterans. Journal of Alternative and Complementary Medicine, 24(12), 1159–1165. https://doi.org/10.1089/acm.2018.0135
- Harton, L. R., Richardson, J. R., Armendariz, A., & Nazarian, A. (2017). Dissociation of morphine analgesic effects in the sensory and affective components of formalin-induced spontaneous pain in male and female rats. Brain Research, 1658, 36–41. https://doi.org/10.1016/j.brainres.2017.01.011
- He, Y. Q., Chen, Q., Ji, L., Wang, Z. G., Bai, Z. H., Stephens, R. J., & Yang, M. (2013). PKCgamma receptor mediates visceral nociception and hyperalgesia following exposure to PTSD-like stress in the spinal cord of rats. Molecular Pain, 9, 35.
- He, Y. Q., Lang, X. Q., Lin, L., Ji, L., Yuan, X. Y., Chen, Q., Ran, Y. M., Chen, H. S., Li, L., Wang, J. M., Wang, Z. G., Gregersen, H., Zou, D. W., Liang, H. P., & Yang, M. (2017). P2X3 receptor-mediated visceral hyperalgesia and neuronal sensitization following exposure to PTSD-like stress in the dorsal root ganglia of rats. Neurogastroenterology & Motility, 29(3), e12976. https://doi.org/10.1111/nmo.12976
- Iorio, N., Makipour, K., Palit, A., & Friedenberg, F. K. (2014). Post-traumatic stress disorder is associated with irritable bowel syndrome in African Americans. Journal of Neurogastroenterology and Motility, 20(4), 523–530. https://doi.org/10.5056/jnm14040
- Johnson, A. C., Farmer, A. D., Ness, T. J., & Greenwood-Van Meerveld, B. (2019). Critical evaluation of animal models of visceral pain for therapeutics development: A focus on irritable bowel syndrome. Neurogastroenterology and Motility, 32(4), e13776. https://doi.org/10.1111/nmo.13776
- Joo, I. L., Lai, A. Y., Bazzigaluppi, P., Koletar, M. M., Dorr, A., Brown, M. E., Thomason, L. A., Sled, J. G., McLaurin, J., & Stefanovic, B. (2017). Early neurovascular dysfunction in a transgenic rat model of Alzheimer's disease. Scientific Reports, 7(1), 46427. https://doi.org/10.1038/srep46427
- Keszthelyi, D., Troost, F. J., & Masclee, A. A. (2012). Irritable bowel syndrome: Methods, mechanisms, and pathophysiology. Methods to assess visceral hypersensitivity in irritable bowel syndrome. American Journal of Physiology-Gastrointestinal and Liver Physiology, 303(2), G141–G154. https://doi.org/10.1152/ajpgi.00060.2012
- Kuner, R. (2010). Central mechanisms of pathological pain. Nature Medicine, 16(11), 1258–1266. https://doi.org/10.1038/nm.2231
- Larauche, M., Mulak, A., Kim, Y. S., Labus, J., Million, M., & Tache, Y. (2012). Visceral analgesia induced by acute and repeated water avoidance stress in rats: sex difference in opioid involvement. Neurogastroenterology and Motility, 24(11), 1031–1547. https://doi.org/10.1111/j.1365-2982.2012.01980.x
- Larauche, M., Mulak, A., & Taché, Y. (2011). Stress-related alterations of visceral sensation: animal models for irritable bowel syndrome study. Journal of Neurogastroenterology and Motility, 17(3), 213–234. https://doi.org/10.5056/jnm.2011.17.3.213
- Lee, S. H., Ok, S.-H., Subbarao, R. B., Kim, J.-Y., Bae, S. I., Hwang, Y., Tak, S., & Sohn, J.-T. (2020). Otoprotective effects of zingerone on cisplatin-induced ototoxicity. International Journal of Molecular Sciences, 17(1), 21–32. https://doi.org/10.3390/ijms21103503
- Liu, S., Liu, W. T., Liu, Y. P., Dong, H. L., Henkemeyer, M., Xiong, L. Z., & Song, X. J. (2011). Blocking EphB1 receptor forward signaling in spinal cord relieves bone cancer pain and rescues analgesic effect of morphine treatment in rodents. Cancer Research, 71(13), 4392–4402. https://doi.org/10.1158/0008-5472.CAN-10-3870
- Liu, X. G., & Zhou, L. J. (2014). Long-term potentiation at spinal C-fiber synapses: a target for pathological pain. Current Pharmaceutical Design, 21(7), 895–905. https://doi.org/10.2174/1381612820666141027115949
- Liu, Y., Xu, H., Geng, Y., Xu, D., Zhang, L., Yang, Y., Wei, Z., Zhang, B., Li, S., Gao, X., Wang, R., Zhang, X., Brann, D., & Yang, F. (2017). Dibutyryl-cAMP attenuates pulmonary fibrosis by blocking myofibroblast differentiation via PKA/CREB/CBP signaling in rats with silicosis. Respiratory Research, 18(1), 38. https://doi.org/10.1186/s12931-017-0523-z
- Louwies, T., Ligon, C. O., Johnson, A. C., & Greenwood Van Meerveld, B. (2019). Targeting epigenetic mechanisms for chronic visceral pain: A valid approach for the development of novel therapeutics. Neurogastroenterology and Motility, 31(3), e13500. https://doi.org/10.1111/nmo.13500
- Miampamba, M., Million, M., Yuan, P. Q., Larauche, M., & Tache, Y. (2007). Water avoidance stress activates colonic myenteric neurons in female rats. Neuroreport, 18(7), 679–682. https://doi.org/10.1097/WNR.0b013e3280bef7f8
- O'Brien, J. A., & Austin, P. J. (2019). Effect of photobiomodulation in rescuing lipopolysaccharide-induced dopaminergic cell loss in the male Sprague-Dawley rat. Biomolecules, 9(8), 381. https://doi.org/10.3390/biom9080381
- Rong, R., Xia, X., Peng, H., Li, H., You, M., Liang, Z., Yao, F., Yao, X., Xiong, K., Huang, J., Zhou, R., & Ji, D. (2020). Cdk5-mediated Drp1 phosphorylation drives mitochondrial defects and neuronal apoptosis in radiation-induced optic neuropathy. Cell Death & Disease, 11(9), 720. https://doi.org/10.1038/s41419-020-02922-y
- Rosztoczy, A., Fioramonti, J., Jarmay, K., Barreau, F., Wittmann, T., & Bueno, L. (2003). Influence of sex and experimental protocol on the effect of maternal deprivation on rectal sensitivity to distension in the adult rat. Neurogastroenterology and Motility, 15(6), 679–686. https://doi.org/10.1046/j.1350-1925.2003.00451.x
- Ruan, J., Zhang, H., Lu, X., Liu, Y., & Cao, J. (2010). EphrinBs/EphBs signaling is involved in modulation of spinal nociceptive processing through a mitogen-activated protein kinases-dependent mechanism. Anesthesiology, 112(5), 1234–1249. https://doi.org/10.1097/ALN.0b013e3181d3e0df
- Simren, M., Tornblom, H., Palsson, O. S., Van Oudenhove, L., Whitehead, W. E., & Tack, J. (2019). Cumulative effects of psychologic distress, visceral hypersensitivity, and abnormal transit on patient-reported outcomes in irritable bowel syndrome. Gastroenterology, 157(2), 391–402. https://doi.org/10.1053/j.gastro.2019.04.019
- Smith, T., Al, O. M., Sathish, J., & Djouhri, L. (2015). Increased expression of HCN2 channel protein in L4 dorsal root ganglion neurons following axotomy of L5- and inflammation of L4-spinal nerves in rats. Neuroscience, 295, 90–102. https://doi.org/10.1016/j.neuroscience.2015.03.041
- Song, X., Cao, J., Li, H., Zheng, J., Song, X., & Xiong, L. (2008). Upregulation and redistribution of ephrinB and EphB receptor in dorsal root ganglion and spinal dorsal horn neurons after peripheral nerve injury and dorsal rhizotomy. European Journal of Pain, 12(8), 1031–1039. https://doi.org/10.1016/j.ejpain.2008.01.011
- Song, X., Zheng, J., Cao, J., Liu, W., Song, X., & Huang, Z. (2008). EphrinB-EphB receptor signaling contributes to neuropathic pain by regulating neural excitability and spinal synaptic plasticity in rats. Pain, 139(1), 168–180. https://doi.org/10.1016/j.pain.2008.03.019
- Sripada, R. K., Rauch, S. A., & Liberzon, I. (2016). Psychological mechanisms of PTSD and its treatment. Current Psychiatry Reports, 18(11), 99. https://doi.org/10.1007/s11920-016-0735-9
- Sun, R., Zhang, W., Bo, J., Zhang, Z., Lei, Y., Huo, W., Liu, Y., Ma, Z., & Gu, X. (2017). Spinal activation of alpha7-nicotinic acetylcholine receptor attenuates posttraumatic stress disorder-related chronic pain via suppression of glial activation. Neuroscience, 344, 243–254. https://doi.org/10.1016/j.neuroscience.2016.12.029
- Sun, Y., Liu, F. L., Song, G. Q., Qian, W., & Hou, X. H. (2006). Effects of acute and chronic restraint stress on visceral sensitivity and neuroendocrine hormones in rats. Chinese Journal of Digestive Diseases, 7(3), 149–155. https://doi.org/10.1111/j.1443-9573.2006.00260.x
- Tabata, M., Terayama, R., Maruhama, K., Iida, S., & Sugimoto, T. (2018). Differential induction of c-Fos and phosphorylated ERK by a noxious stimulus after peripheral nerve injury. International Journal of Neuroscience, 128(3), 208–218. https://doi.org/10.1080/00207454.2017.1381697
- Takasu, M. A., Dalva, M. B., Zigmond, R. E., & Greenberg, M. E. (2002). Modulation of NMDA receptor-dependent calcium influx and gene expression through EphB receptors. Science, 295(5554), 491–495. https://doi.org/10.1126/science.1065983
- Theofanous, S. A., Florens, M. V., Appeltans, I., Denadai Souza, A., Wood, J. N., Wouters, M. M., & Boeckxstaens, G. E. (2020). Ephrin‐B2 signaling in the spinal cord as a player in post‐inflammatory and stress‐induced visceral hypersensitivity. Neurogastroenterology & Motility, 32(4), e13782. https://doi.org/10.1111/nmo.13782
- Vasileiou, I., Adamakis, I., Patsouris, E., & Theocharis, S. (2013). Ephrins and pain. Expert Opinion on Therapeutic Targets, 17(8), 879–887. https://doi.org/10.1517/14728222.2013.801456
- Wang, Y., Ying, G. X., Liu, X., Wang, W. Y., Dong, J. H., Ni, Z. M., & Zhou, C. F. (2005). Induction of ephrin-B1 and EphB receptors during denervation-induced plasticity in the adult mouse hippocampus. European Journal of Neuroscience, 21(9), 2336–2346. https://doi.org/10.1111/j.1460-9568.2005.04093.x
- Xia, W. S., Peng, Y. N., Tang, L. H., Jiang, L. S., Yu, L. N., Zhou, X. L., Zhang, F. J., & Yan, M. (2014). Spinal ephrinB/EphB signalling contributed to remifentanil-induced hyperalgesia via NMDA receptor. European Journal of Pain, 18(9), 1231–1239. https://doi.org/10.1002/j.1532-2149.2014.00478.x
- Yang, M., Chen, W., Zhang, Y., Yang, R., Wang, Y., & Yuan, H. (2018). EphrinB/EphB signaling contributes to spinal nociceptive processing via calpain-1 and caspase-3. Molecular Medicine Reports, 18(1), 268–278. https://doi.org/10.3892/mmr.2018.8996
- Yu, L., Zhou, X., Yu, J., Huang, H., Jiang, L., Zhang, F., Cao, J., & Yan, M. (2012). PI3K contributed to modulation of spinal nociceptive information related to ephrinBs/EphBs. PLOS One, 7(8), e40930. https://doi.org/10.1371/journal.pone.0040930
- Yu, L. N., Sun, L. H., Wang, M., Wang, L. J., Wu, Y., Yu, J., Wang, W. N., Zhang, F. J., Li, X., & Yan, M. (2017). EphrinB-EphB signaling induces hyperalgesia through ERK5/CREB pathway in rats. Pain Physician, 20(4), E563–E574.
- Zhang, F., Liu, Q., Wang, Z., Xie, W., Sheng, X., Zhang, H., Yuan, Z., Han, Y., & Weng, Q. (2017). Seasonal expression of oxytocin and oxytocin receptor in the scented gland of male muskrat (Ondatra zibethicus). Scientific Reports, 7(1), 16627. https://doi.org/10.1038/s41598-017-16973-3
- Zhang, R., Zou, N., Li, J., Lv, H., Wei, J., Fang, X., & Qian, J. (2011). Elevated expression of C-Fos in central nervous system correlates with visceral hypersensitivity in irritable bowel syndrome (IBS): a new target for IBS treatment. International Journal of Colorectal Disease, 26(8), 1035–1044. https://doi.org/10.1007/s00384-011-1153-4
- Zhang, Y., Simpson-Durand, C. D., & Standifer, K. M. (2015). Nociceptin/orphanin FQ peptide receptor antagonist JTC-801 reverses pain and anxiety symptoms in a rat model of post-traumatic stress disorder. British Journal of Pharmacology, 172(2), 571–582. https://doi.org/10.1111/bph.12701
- Zhao, J., Yuan, G., Cendan, C. M., Nassar, M. A., Lagerstrom, M. C., Kullander, K., Gavazzi, I., & Wood, J. N. (2010). Nociceptor-expressed ephrin-B2 regulates inflammatory and neuropathic pain. Molecular Pain, 6, 77.
- Zhou, X. L., Wang, Y., Zhang, C. J., Yu, L. N., Cao, J. L., & Yan, M. (2015a). PKA is required for the modulation of spinal nociceptive information related to ephrinB-EphB signaling in mice. Neuroscience, 284, 546–554. https://doi.org/10.1016/j.neuroscience.2014.10.025
- Zhou, X. L., Wang, Y., Zhang, C. J., Yu, L. N., Cao, J. L., & Yan, M. (2015b). COX-2 is required for the modulation of spinal nociceptive information related to ephrinB/EphB signalling. European Journal of Pain, 19(9), 1277–1287. https://doi.org/10.1002/ejp.657
- Zhou, X. L., Zhang, C. J., Wang, Y., Wang, M., Sun, L. H., Yu, L. N., Cao, J. L., & Yan, M. (2015). EphrinB-EphB signaling regulates spinal pain processing via PKCγ. Neuroscience, 307, 64–72. https://doi.org/10.1016/j.neuroscience.2015.08.048
- Zhu, Y., Liu, B., Zheng, X., Wu, J., Chen, S., Chen, Z., Chen, T., Huang, Z., & Lei, W. (2019). Partial decortication ameliorates dopamine depletion-induced striatal neuron lesions in rats. International Journal of Molecular Medicine, 44(4), 1414–1424. https://doi.org/10.3892/ijmm.2019.4288
- Zhu, Y. F., Wang, W. P., Zheng, X. F., Chen, Z., Chen, T., Huang, Z. Y., Jia, L. J., & Lei, W. L. (2020). Characteristic response of striatal astrocytes to dopamine depletion. Neural Regeneration Research, 15(4), 724–730.