
Abstract
The underlying mechanisms of trauma-related disorders are challenging to discover and the disorders are difficult to treat, in part due to the complex and varied expressions of response to traumatic stress. These challenges will be easier to overcome as more is understood about the variability in response to trauma. Incorporating assessment of variability into animal models of traumatic stress may allow better translation to clinical research and treatment development. In this study, we characterized variability in behavioral responses following traumatic stress exposure using a predator exposure (PE) animal model. Elevated plus maze (EPM) and acoustic startle response (SR) were used to study avoidance and arousal symptoms in male Sprague–Dawley rats. Behavioral data were compared between control (n = 31) and predator-exposed (n = 30) rats. PE behavior was clustered using k-means principal components analysis. Four clusters and three distinct subgroups were identified and were characterized as avoidant (Cluster 4, 30%), moderately avoidant (Clusters 2 and 3, 49%), and unaffected (Cluster 1, 17%). These results demonstrate that rodent responses to PE are varied, similar to human presentations following traumatic stress, suggesting it may be possible to develop treatment strategies for varied symptom presentations using a preclinical animal model.
Introduction
Traumatic stress exposure can result in Acute Stress Reactions (ASRs), Acute Stress Disorder (ASD), and/or Post Traumatic Stress Disorder (PTSD) diagnosis (APA, Citation2013; WHO, Citation1993). The symptom classification criteria for ASR include transient emotional, cognitive, somatic, and behavioral symptoms presenting immediately and lasting up to 30 days, while ASD and PTSD classifications include symptom domains of intrusion, negative mood, dissociation, avoidance, and arousal presenting 3–30 days or over 30 days following trauma exposure, respectively. Adler and Svetlitzky (Adler et al., Citation2020) reported that 45% of Soldiers observed team members who exhibited symptoms of an ASR during combat. Of individuals exposed to trauma, 7–28% develop ASD and 4–38% develop PTSD (Bryant et al., Citation2012; Kessler et al., Citation1995; Milliken et al., Citation2007; Scofield et al., Citation2017). Acute and chronic trauma-related symptoms are prevalent following trauma exposure and detrimental to daily functioning.
Trauma-related disorder presentations are complex and there are significant challenges associated with diagnosis, prevention, treatment, and mechanistic understanding of the disorders. Symptom clusters likely vary as a function of many factors including the nature of the traumatic event itself (i.e. type, duration) and the individual characteristics of the patient (i.e. age, sex, biological vulnerabilities). PTSD presentation is quite variable and has been classified by biological subtype (Galatzer-Levy et al., Citation2013; Siegel et al., Citation2021; Yang et al., Citation2021). Evidence also suggests such variability extends to ASR and ASD presentations (Adler et al., Citation2020; Bryant et al., Citation2011). There is a critical need to understand the complexity of trauma-related disorder presentations to implement effective and individualized treatments. This need is greatest for acute trauma-related disorders such as ASR or ASD, which are less understood and for which limited behavioral or no FDA-approved pharmacologic treatments are available.
Animal models have furthered understanding of traumatic-stress-related disorders by revealing mechanistic underpinnings of trauma-related symptoms. Likewise, these models have served as a necessary tool for testing novel treatment strategies. Stratifying animals based on trauma exposure responses may provide a precise and translational avenue for understanding trauma-related pathophysiology. Cohen and Zohar (Citation2004) and Cohen et al. (Citation2006, Citation2012) developed an approach in which rats are classified as maladapted or well-adapted based on anxiety-like responses to trauma. Ritov et al. (Citation2016) also observed variability in anxiety-like and anhedonic behaviors in trauma-exposed rats. Given that only a small percentage of humans exposed to trauma receive diagnoses and there is substantial variability in the presentation of trauma-related disorders, subgrouping animals may better illuminate the vulnerability factors and mechanisms underlying maladaptive responses to traumatic stress.
In the current study, data from both published and previously unpublished studies were compiled and assessed to characterize acute behavioral response variability following traumatic stress using a preclinical predator exposure (PE) model (Cravedi et al., Citation2021; Taylor et al., Citation2020). Standard rodent behavioral tests of the acoustic startle response (SR) and elevated plus maze (EPM) exploration were used to model symptom domains that present in trauma-related disorders, as they can reveal great variation in response severity across subjects. Demonstrating variation in response to traumatic stress exposure in rats has implications for traumatic stress disorder mechanistic understanding and treatment development efforts.
Materials and methods
Subjects
Adult (N = 61), male Sprague–Dawley rats between 10 and 14 weeks of age (Charles River Laboratories) were kept on a 12-h/12-h light-dark cycle (lights on at 0600) in an AAALAC-accredited animal facility. Rats acclimated to the facility for at least seven days, after which they were singly housed and handled for at least 5 days before experimental manipulations. For the duration of the study, rats were maintained on a mild food restriction procedure in which daily allotments of food were provided to maintain bodyweights between 330 and 350 g (±15 g). Water was provided ad libitum. At the time of this study, mild food restriction was utilized as a standard procedure in the laboratory’s studies to avoid reaching floor effects in assays that incorporated a degree of motivated behavior (e.g. open field test and elevated plus maze), due to previous observations of decreased exploratory behavior in these assays following stress exposure. Single housing was maintained to ensure all subjects received a full daily allotment of food chow without the chance of social hierarchy dynamics affecting access to food. All procedures were conducted during the light phase, was in accordance with the “Guide for the Care and Use of Laboratory Animals” (National Academic Press, Citation2011) and were approved by the Institutional Animal Care and Use Committee of Walter Reed Army Institute of Research. The data was from three studies conducted across 4 years and included vehicle-treated predator-exposed and control rats or predator-exposed and control rats (i.e. rats that were not administered any injections). Thus, studies differed with respect to the times at which data were collected and whether or not rats received injections. Rats received injections on a maximum of three occasions and before behavioral testing. Importantly, across studies, all experimental procedures (i.e. predator exposure, control procedures, and behavioral testing) were conducted at the same post-stress time window (for all 61 rats at 24-h; for 42 out of 61 rats, a 48-h timepoint was collected as well) and thus did not differ greatly with respect to time of day. Additionally, rats from each study were distributed approximately evenly to both predator exposed and control groups; therefore, any spurious effects of specific experimental factors are unlikely to influence observed differences between groups. In addition, the possible contribution of study differences on outcome variables was accounted for through statistical analyses described below. Results from physiological endpoints using the blood samples taken are also presented as a part of other scientific communications.
Experimental procedure
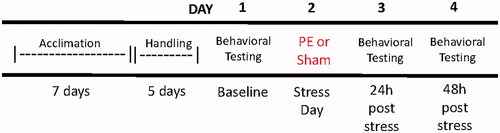
As shown in , on Day 1, a blood sample from the lateral tail vein (∼0.1 mL) was collected before behavioral assessments. On Day 2, all rats underwent the predator exposure procedure. On Day 3, behavioral tests were repeated for all 61 rats (24-h post-predator exposure). Behavioral tests were repeated on Day 4 for 42 of the 61 rats at 48-h post-predator exposure.
Figure 1. General experimental procedure for all studies. Forty-two of 61 rats were tested at the 48-h timepoint.
Predator exposure
PE was performed by exposing rats to three live predator species in sequence within a single day. This procedure has been previously characterized in our lab (Cravedi et al., Citation2021) and was modified slightly for the present study. Predators used (in order of exposure) were a snake (ball python), 2–3 black-footed ferrets, and two pairs of domestic cats. PE involved exposure to a single predator (snake) or multiple predators simultaneously (ferrets and cats); exposures took place in the housing rooms of the predator species. Rats were placed in a protective non-restraining enclosure specifically designed to allow the perception of visual, olfactory, and auditory cues associated with the predators without the possibility of direct physical contact. Enclosures were placed within the feeding chamber of the snake and the housing area of the ferrets or cats. To maximize odor presence for the snake exposure, pieces of dried shed snake skin were placed inside the enclosure with the rats. To maximize odor cues in cat exposures, the enclosure holding the rat was placed on a bed of soiled (wet) cat litter with cat toys hanging above the enclosure to increase the engagement of the cats. Exposure lasted 10-min for the snake, followed by 5-min for ferrets, and 10-min for cats. After the cat exposure, rats were placed into fresh, clean home cages. Control rats were placed individually in the same size protective restrainers as were used for PE for 25-min. While in restrainers, control rats were moved to different locations in a predator-free laboratory area after a period of 10-min, 5-min, and finally 10-min to mimic the PE exposure duration per species.
Behavioral measures
Elevated plus maze (EPM)
The EPM is a behavioral test that assesses exploration of ambiguous spaces which reflects impulsivity and/or hyperarousal when increased and heightened threat sensitivity, hypervigilance, anxiety, fear, and/or avoidance when decreased compared to control animals. The EPM consisted of four tinted plastic arms (50 × 10 cm) segmented into two separate parts in a “plus” configuration (Kinder Scientific, Poway, CA). Two arms were closed with walls 40 cm in height and the other two arms were open with no walls. Testing consisted of 5-min sessions with dim lighting (lux: seven for open arms, one for closed arms, two for intersection) and a white noise generator (70 dB) in the test room.
Each test started with the rat being placed at the intersection of the maze and pointed toward an open arm, and the apparatus was cleaned immediately (PURE Hard Surface Spray; PURE Bioscience, Inc., El Cajon, CA, USA) following each test to mitigate the possibility of introducing pheromonal cues across subjects. The animal movement was measured using Kinder Scientific automated software and photobeam tracking. For data analysis, basic movements (i.e. the count of consecutive photobeam breaks) were used as a measure of exploratory behavior. Basic movements are well-correlated to the total distance traveled and are a useful measure to track within-subject behavioral performance on the EPM (Schrader et al., Citation2018). In addition, measures of anxiety-like behavior (i.e. open arm distance) were analyzed.
Acoustic startle response (SR)
SR is a behavioral test that assesses hypersensitivity and hyperactivity when increased and numbing when decreased compared to control animals or baseline behavior. Eight computer-controlled SR chambers (Kinder Scientific, Poway, CA) were used to measure acoustic startle response and related measures (e.g. habituation, startle reactivity). Each rat was placed in an enclosure within a sound- and light-attenuated, ventilated chamber. The enclosure rested on a platform that measured changes in force as a result of a startle response. Each session began with a 5-min acclimation period to a background level of white noise (70 dB), followed by 30 pseudo-randomized trials of pulse-only acoustic stimuli (115 dB; 40-ms). The mean inter-trial interval for all experiments was 20-s (range: 10–30 s) and the recording window, which began at the beginning of each trial, was 250-ms. Startle response was recorded for each trial in Newtons (N).
For data analysis, the max startle magnitudes for pulse-only trials were averaged across replicates and were used to infer the startle response, with the first five pulse-only trials being used as a measure of startle reactivity. The measure of average maximum startle was calculated similarly by averaging the max startle force across all 30 trials. For the habituation measure, the average of the max startle magnitudes for the last five trials was subtracted from the average of the max startle magnitudes for the first five trials and divided by that same first five trial average then multiplied by 100.
Statistical analyses
All data are represented as the mean ± SEM. GraphPad Prism 7.0 microcomputer software or R (GraphPad Software, La Jolla, CA, USA) was used to graph and analyze all data. Statistical significance was indicated by a probability level of 0.05 or lower. The data were analyzed in three steps: (a) analyses of differences between control and PE subjects across time with the investigation of contributing variables to behavioral endpoints; (b) characterization of PE animal behavioral variability using unbiased k means principal component clustering of subjects change from baseline at 24 h; and (c) characterization of these clusters. We then assessed the behavioral attributes of each cluster to classify the behavioral responses to PE. As behavioral data at the 48-h time-point was collected in only a subset of the data, most of the analyses were focused on the baseline and 24-h timepoints.
Analyses of differences between exposure groups across time
A mixed-effects analysis of variance (ANOVA) was used to examine group (PE or control) and time (baseline or 24-h) differences for EPM behavioral endpoints (total entries, basic movements, intersection entries, total distance, open arm distance) and SR behavioral endpoints (average startle, habituation, and startle reactivity). Covariates included a study and a random intercept of subject ID to account for repeated measures. An additional mixed effects ANOVA was used to assess behavioral endpoints for a subset of subjects for which data was collected at 48-h post-exposure. This analysis included group (PE or control), time (baseline, 24-h, or 48-h), study as a covariate, and subject ID as a random intercept. Tukey’s multiple comparisons post-hoc tests were conducted to follow up on the main effects and interactions.
Investigation of variable contributions to behavioral endpoints
Additional exploratory analyses were conducted to assess how the variability of outcome measures contributed to principal components analysis (PCA) using a bi-plot of individual subjects and dependent variables. The dataset was normalized by centering onto a unit scale before PCA to remove biases and obtain optimum PCA performance. The bi-plot PCA axes are dimensions 1 and 2 which include the behavioral results. The angle from which all individual outcome points have a minimal squared sum of errors from the slope also maximizes the distance between all points. The direction of maximum spread is called the principal axis (x-axis), dimension 1. The direction of the second highest maximum spread is called dimension 2, which is the y-axis on the bi-plot. The correlation arrow plot shows the relationships between all dependent variables and the behavioral measures. Positively correlated variables are grouped together while negatively correlated variables are positioned on opposite quadrants. The length of the arrow and the color of the arrow reflect the quality of the variables. Individual subjects are visualized with a PCA plot and each group has a 95% confidence ellipse representing the estimate of true group position.
Examining behavioral variability in predator exposed rats
To evaluate variability in PE rats, but to reduce contribution of individual study variability, a change from baseline at 24 h was calculated and used for the k-means clustering analysis with scaling also performed to standardize the dataset. As the primary goal was to assess heterogeneity of response to predator exposure, the 24 h timepoint at which we measured behavior from all animals was selected for PCA analysis. The gap statistic method was used to determine the optimal number of clusters to partition for the k-means clustering based on the eight behavioral endpoints in the PE rats. A k-means model was then created to cluster change from baseline observations. K-means cluster membership was then combined with an unsupervised PCA dimension reduction to visualize the clusters with confidence ellipses on dimensions 1 and 2 using the methodology of Ding and He (Citation2004). To identify key characteristics of each cluster, a one-way ANOVA was conducted and post-hoc tests were conducted to follow up on the main effects. Additionally, the percent change from baseline was calculated to look at the direction of change for all outcome measures in each cluster.
Results
Analysis of differences between exposure groups across time
outlines all ANOVA analyses and results and provides an overview of behavioral outcomes on the EPM () and SR (). Mixed effects ANOVAs were conducted for both EPM and SR on all subjects using the baseline and 24-h timepoint. No group differences were observed for SR measures. These analyses demonstrated only a main effect of group for open arm distance on the EPM, with the PE group having an overall lower open arm distance compared to the control group (F1, 56 = 5.69, p = 0.02; ). Mixed effects ANOVAs were also conducted to examine the effect of timepoint and group on behavior with the subset of subjects that had behavioral assessments conducted at 24- and 48-h post-PE. There was a significant interaction between group and timepoint for total entries (F2, 99 = 4.49, p = 0.01), with the PE group having fewer total entries on the EPM than the control group at the 48-h timepoint (p = 0.002; ). There was also an interaction of group and timepoint for basic movements on the EPM (F2, 99 = 3.48, p = 0.03), with the PE group having a lower number of basic movements than the control group at both the 24-h (p = 0.03) and 48-h (p = 0.01) timepoints (). There was also a significant interaction of group and timepoint for intersection entries (F2, 99 = 5.06, p < 0.01), with the PE group having a significantly lower number of intersection entries on the EPM than the control group at the 48-h timepoint (p < 0.01; ). Finally, there was a trend for an interaction of group and timepoint for total distance on the EPM (F2, 99 = 2.95, p = 0.06), with a tendency for PE rats to have lower distance traveled at both the 24-h and 48-h timepoints (). For group by timepoint interactions for all measures, there were within-group changes in behavior across timepoints for total entries (), intersection entries (), basic movements (), and total distance (). There was also a significant main effect of the exposure group for open arm distance, with the PE group having a lower open arm distance than the control group (F1, 56 = 5.79, p = 0.02; ).
Figure 2. Behavioral endpoints from EPM (A–E) and SR (F–H) comparing PE and control rats. Significant results are described in the body of the text.
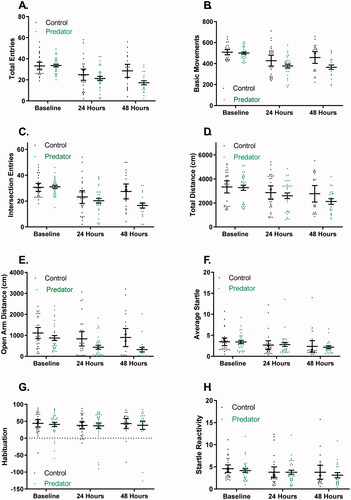
Table 1. Two EPM and SR data sets differing in timepoints. One dataset contains baseline and 24-h timepoint data only while the other contains baseline, 24-h, and 48-h data (as seen in the “data” column).
Investigation of variables contributions to behavioral endpoints
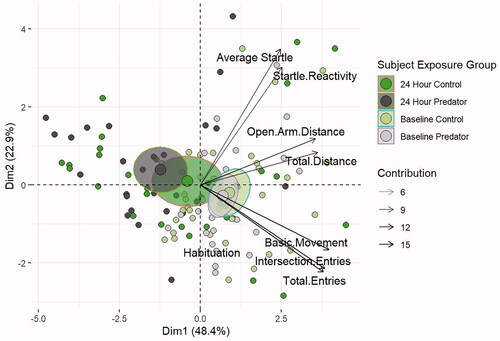
The bi-plot shown in contains exploratory information about individual subject behavior (small points), the averages of group variability (ellipse and large points), and the dependent behavioral measures. shows a separation of the average behaviors based on principal component differences between baseline and 24-h behavior. While baseline averages and their ellipses are overlapping in the fourth quadrant, the 24-h averages show separation by exposure group and a large change from baseline, with the control group spanning across the line into the second quadrant and the PE group fully in the second quadrant. The arrow plot shows that behavioral measures cluster into three groups based on startle measures, EPM distance measures, and EPM arm entry measures. The level of transparency of the arrows reflects the extent of the contribution of the behavioral endpoints—EPM total arm entries, intersection entries, and basic movements—to the partitioning of clusters. Within the first dimension, EPM components account for just under 85% of the explained variance while SR components account for just 15%. Dimension 2 is comprised of almost 37% EPM component contribution and 63% SR component contribution. Overall, these results demonstrate that EPM behavioral endpoints contribute to most of the variability observed across subjects and across dimensions.
Figure 3. Bi-plot PCA shows separation of rats 24-h post-PE compared to baseline and control rats. Gradation of the line qualitatively depicts the strength of the association. Rats at baseline have overlapping clusters indicating similar behavior. Compared to the 24-h control cluster (dark green circle), the 24-h PE cluster (dark grey circle) was separated more from the baseline clusters.
Investigation of behavioral variability 24-h after predator exposure
The gap statistic method determined the optimal number of clusters for PE subjects is four according to the majority rule giving a 71.59% quality of partition (). The 24-h change from baseline behavior for PE subjects was analyzed with k-means clustering to account for any effects of different studies on the data. The PCA plot of k-means clusters shows overlaps of the ellipses for Clusters 3 and 4, with Cluster 2 being distinct but with two individual subjects located within Clusters 3 and 4 (). Cluster 1 is comprised of five rats and is the cluster most clearly unaffected by PE based on the analysis. The percent change from baseline at 24-h was calculated and plotted by behavioral assay and cluster membership ( and ). This qualitative analysis of each behavior indicates that Cluster 1 was the only cluster to show an increase from baseline in EPM endpoints values (), with almost no change from baseline SR endpoint values (). Cluster 1 exploratory behavior was higher than baseline behavior and higher compared to other clusters; while startle response was unaffected by PE. Altogether, this behavioral profile is inconsistent with typical aberrant traumatic stress-like symptoms observed in both human traumatic stress disorders as well as animal models of traumatic stress, when the endpoints include avoidance, inactivity, or anxiety-like behavior on the EPM, and hyperarousal-like behavior on SR measures. Therefore, this cluster may represent a stress-resilient phenotype. Cluster 2 was composed of 11 rats, and compared to baseline, subjects demonstrated lower EPM exploratory behavior compared to baseline (), especially for open arm distance; SR habituation was increased and average max startle was decreased compared to baseline (). In contrast, the SR endpoints generally trended toward reduced hyperarousal-like behavior, which is the opposite of what is described for human trauma-related disorders. Therefore, Cluster 2 may represent a moderate stress phenotype. Cluster 3 was composed of four rats, which demonstrated a similar pattern of behavior to Cluster 2. Like Cluster 2, Cluster 3 showed decreased EPM exploratory behavior () and increased SR habituation compared to baseline behavior on the EPM (). Cluster 3 had reduced startle reactivity compared to baseline behavior, indicating a trend toward decreased SR after PE exposure (). Therefore, like Cluster 2, Cluster 3 may represent a moderate stress phenotype. Cluster 4 was comprised of 10 rats and was the cluster most affected by PE. Cluster 4 subjects had the lowest EPM exploratory values relative to baseline behavior and compared to the other clusters (). Cluster 4 was the only cluster that demonstrated decreased SR habituation compared to baseline (). There was also a decrease in average max startle after PE seen in Cluster 4 (). Therefore, Cluster 4 subjects exhibited behaviors most consistent with traumatic-stress-related behavior in both humans with traumatic-stress disorders and animal models of traumatic stress disorders. This is because Cluster 4 subjects generally exhibited lower exploratory behavior and increased hyperarousal-like behavior. As such, Cluster 4 may represent a significant stress phenotype. In sum, 16% of the sample comprised Cluster 1, 36% comprised Cluster 2, 13% comprised Cluster 3, and 33% comprised Cluster 4.
Figure 4. The gap statistic method was used on 24-h change from baseline PE animal behavior data to determine the optimal number of clusters. The highest frequency among all indices was four clusters.
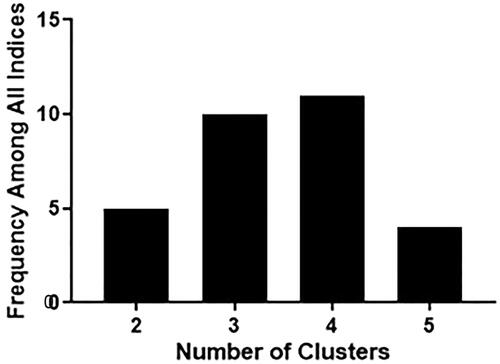
Figure 5. K-means clustering and PCA of unbiased 24-h change from baseline PE endpoint behavior showing separation into four clusters.
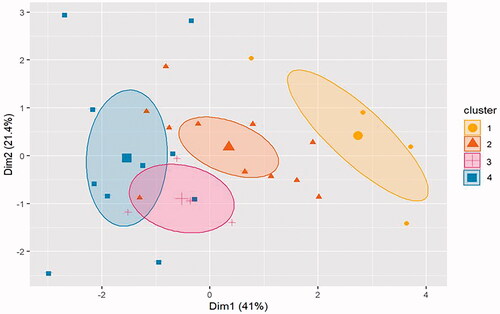
Figure 6. Percent change from baseline at 24-h EPM behavioral endpoints plotted by cluster. (A) Cluster 1 shows increases from baseline behavior for total entries, intersection entries, and open arm distance, (B,C) Clusters 2 and 3 show minimal decreases from baseline EPM behavior across all measures with open arm distance decreasing the most, and (D) Cluster 4 shows major decreases from baseline behavior on all EPM measures.
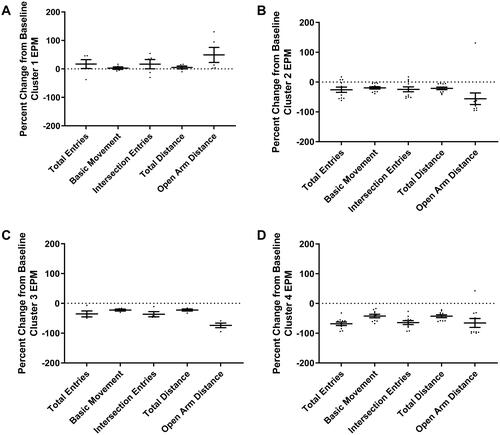
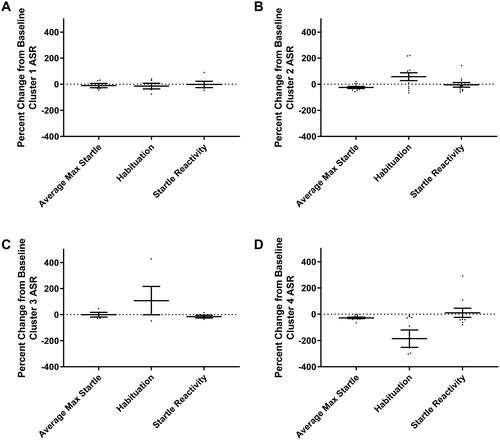
Figure 7. Percent change from baseline SR behavioral endpoints plotted by cluster. (A) Cluster 1 shows no change from baseline in SR behaviors, (B,C) Clusters 2 and 3 both exhibit increases in habituation from baseline to 24-h, and (D) Cluster 4 is the only cluster with a decrease in habituation compared to baseline. One data point representing habituation in Cluster 4 is outside the axis limit.
The quantitative ANOVA analysis on the change from baseline behaviors of PE group animals confirmed that there were significant differences between clusters on several EPM variables including total entries (F3, 26 = 7.14, p < 0.01; ), basic movements (F3, 26 = 9.14, p < 0.01; ), intersection entries (F3, 26 = 7.37, p < 0.01; ), total distance (F3, 26 = 20.12, p < 0.01; ), and open arm distance (F3, 26 = 25.64, p < 0.01; ). In contrast, no significant differences were observed between any of the clusters with the same analysis for SR measures (p > 0.05; all results are reported in ; ). Post-hoc tests indicated that Cluster 1 subjects had a significantly greater number of total entries () and intersection entries () than subjects in Cluster 4 (p < 0.01). A significantly lower number of basic movements was found in Cluster 4 than in Clusters 1 and 2 (p < 0.05; ). Cluster 1 subjects traveled a significantly greater total distance than Cluster 2, 3, and 4, subjects (p < 0.01; ). Cluster 4 subjects also traveled a significantly lower total distance than Cluster 2 (p < 0.01; ). All clusters were significantly different from one another in open arm distance except Clusters 2 and 4 (p > 0.05; ). Cluster 1 had the greatest open arm distance traveled while Cluster 3 traveled less than Clusters 2 and 4 in the open arm (p < 0.01; ). Overall, Cluster 1 subjects engaged in the highest levels of exploratory behavior, and Cluster 4 subjects exhibited the lowest levels of exploratory behavior, while Clusters 2 and 3 had intermediate levels of exploratory behavior.
Figure 8. EPM and SR change from baseline behavior plotted across clusters. A one-way ANOVA analysis revealed significant main effects of cluster for all EPM measures (A–E). No significant effects were found for any SR endpoints (F–H).
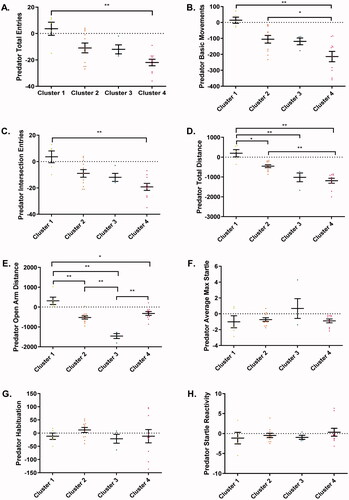
Table 2. EPM and SR data grouped by cluster were analyzed using one-way ANOVA with a main effect of cluster and post-hoc comparisons (alpha = 0.05).
Discussion
In the current study, PE was utilized to model traumatic stress exposure in humans. Following PE or sham exposure, PE and control rats exhibited group differences in behavior on the EPM with minimal differences in SR behavior. PCA revealed that behavioral subtypes exist within the PE group, with most of the variability reflected in the EPM-related behavioral responses. As the current study incorporated repeated behavioral testing, mild food restriction, and single housing for all subjects, it should be taken into account that these factors could have impacted behavioral responses; however, the inclusion of sham controls reduces the impact of each factor on the interpretation of results. Therefore, the current results indicate a rodent model of traumatic stress exposure results in anxiety-like behavior with behavioral subtypes, consistent with the heterogeneity present in humans exposed to traumatic stress.
The current group-based results replicate previous findings for EPM measures, with reduced exploration suggestive of increased anxiety-like behavior following PE exposure. Specifically, total entries and intersection entries were reduced at 48-h and basic movements were reduced at 24-h post-PE compared to control rats as well as at 48-h post-exposure in PE-exposed rats compared to control rats in the subset tested at both time-points. Overall, open arm distance was reduced in both analyses including subjects tested only at 24-h post-PE and in the subset of rats tested at both 24-h and 48-h post-exposure. These findings agree with other studies from our laboratory using PE with either a single 15-min exposure to cats or serial 10-min exposures to three predator species (cats, ferrets, and snakes) across 3 days during adolescence. In these studies, reduced overall exploration and time spent in the open arms of the EPM were observed following PE (Genovese & Dobre, Citation2017; Moore et al., Citation2016). Other laboratories have observed trauma-related behaviors following cat exposure, including reduced open arm exploration (Adamec et al., Citation1997; Campos et al., Citation2013) and increased startle responding (Adamec et al., Citation2010).
There were no group differences in SR behavior, though SR decreased from baseline at 24-h post-PE. The lack of significant startle response in the current study may be due to a numbing effect immediately after PE, which may be supported by the observation that SR decreased from baseline to 24-h in PE subjects. As prior pre-clinical and clinical literature identifies increased SR as a reliable effect of stress exposure, it is curious that this was not observed following PE in the current study. The lack of increased SR observations may be related to the fact that increased SR has generally been observed after exposure to more chronic traumatic stress in both animal models (Khan & Liberzon, Citation2004) and humans with PTSD (Holstein et al., Citation2010). Therefore, enhanced startle may not be an acute effect of traumatic stress, and thus is not able to be measured at the acute timepoints used in the current study.
Consistent with findings from previous animal and human studies, individual differences in responsivity to traumatic stress exposure were observed in the present study. Our results suggest there are four presentations of behavior following PE that consist of subjects exhibiting low, intermediate, and high responsivity to traumatic stress. In the current study, Cluster 1 rats, consisting of 17% of the sample, were largely unaffected and not avoidant following traumatic stress. It is unknown what percentage of humans are completely resilient to traumatic stress, but it is known that some individuals experience posttraumatic growth following traumatic stress (Duan et al., Citation2015), suggesting there is a subset of individuals that is resilient to or responds in a more positive manner to traumatic stress than do those individuals who eventually develop PTSD. In the current study, Clusters 2 and 3 rats, consisting of 13 and 36% of the sample respectively, were moderately avoidant and demonstrated an intermediate exploratory behavior profile. Subthreshold ASD and PTSD are less well-characterized than ASD and PTSD, but subthreshold PTSD symptoms have been observed in 13–25% of individuals exposed to trauma, with both health and psychosocial functioning of these individuals impacted (Adler et al., Citation2020; Pietrzak et al., Citation2009). Therefore, subjects in Clusters 2 and 3 may be a good model for individuals with subthreshold symptoms following traumatic stress. Finally, Cluster 4 rats, consisting of 30% of the sample, were most affected and exhibited an avoidant behavior profile, with this cluster exhibiting the largest decrease from baseline exploratory behavior compared to the others. Interestingly, the composition of Cluster 4 also aligns with rates of ASD and PTSD following traumatic stress, as 7–28% of individuals develop ASD and 4–38% of individuals develop PTSD following exposure to traumatic stress (Bryant et al., Citation2012; Kessler et al., Citation1995; Milliken et al., Citation2007; Scofield et al., Citation2017). The current study revealed that subjects can be subgrouped by behavioral response following PE in a similar manner as stressor-exposed humans, with a subset that is unaffected or resilient, a subset that is moderately affected, and a subset that is greatly affected and might be described as displaying a traumatized phenotype. Notably, the current behavioral groupings are based on behavioral data collected at acute timepoints that more closely model ASRs or ASD than PTSD. Early behavioral responses are, in fact, predictive of later symptomology. Therefore, although it is possible the current findings would extend to modeling PTSD, future assessments should also capture more protracted timepoints to assess for heterogeneity that might more closely model PTSD. This observation is also similar to, but extends, the findings reported by Cohen and Zohar (Citation2004) and Cohen et al. (Citation2006, Citation2012) that rats could be classified as either maladapted or well-adapted based on the extent to which they exhibited anxiety-like responses to predator scent exposure. In the current study, most of the variability in responding observed was due to differences in exploratory behavior. The emergence of post-PE subgroups has interesting implications for future research, and for improving and individualizing the treatment of disorders by addressing symptom presentation, rather than simply focusing on a “one-size-fits-all” traumatic stress disorder diagnosis. It will be interesting in future studies to determine whether, and to what extent, similar clustering patterns are evident in females and/or evident with different behavioral outcome measures.
The complex manner in which traumatic-stress-related disorders develop and present results in significant challenges for the diagnosis, prevention, treatment, and understanding of the underlying pathophysiology. Analysis of possible symptom combinations in PTSD based on the DSM-5 diagnostic criteria revealed 636,120 distinct symptom combinations for the disorder (Galatzer-Levy et al., Citation2013). The subtyping of response patterns to traumatic stress has interesting implications for treatment development. In a recent report, it was suggested that there are two novel distinct epigenetic biotypes for PTSD in Service Members (Yang et al., Citation2021). Rasmusson and Pineles (Citation2018) also describe a variety of molecular endpoints that have been observed in subpopulations of individuals with PTSD and argue that clinical PTSD phenotypes based on molecular subtyping may be needed to adequately treat individuals with the disorder. The National Institute of Mental Health has developed a Research Domain Criteria (RDoC) initiative to Insel et al. (Citation2010) to identify cross-cutting neurobiological and genetic outcomes agnostic of psychopathology diagnosis. For example, this initiative describes the use of neurobehavioral testing to identify individuals that may respond to a particular treatment. With this in mind, it is potentially important to capture the heterogeneity of behavior observed in both preclinical models and humans to refine treatments for behavioral health symptoms. For one, refined behavioral analyses may be more directly compared to human symptoms following traumatic stress exposure, thereby making it easier to develop individualized treatments. Additionally, it is possible that differential molecular and mechanistic endpoints underlie the presentation of preclinical behavioral subgroups. For example, genetic differences may exist between different clusters and would help in understanding key genetic differences in low, intermediate, and high responsivity to traumatic stress. Therefore, novel and refined treatments for humans may be more readily developed by characterizing the variability of responses to traumatic stress in animal models.
Disclaimer
Material has been reviewed by the Walter Reed Army Institute of Research. There is no objection to its presentation and/or publication. The opinions or assertions contained herein are the private views of the author and are not to be construed as official, or as reflecting true views of the Department of the Army or the Department of Defense. The research was conducted under an approved animal use protocol in an AAALAC accredited facility in compliance with the Animal Welfare Act and other federal statutes and regulations relating to animals and experiments involving animals and adheres to principles stated in the Guide for the Care and Use of Laboratory Animals, NRC Publication, 2011 edition.
Acknowledgments
The authors thank present and previous lab members for laboratory assistance, Dr. Samantha Riedy for statistical assistance, and Dr. Tom Balkin for his helpful manuscript edits. The authors also thank the Veterinary Services Program of Walter Reed Army Institute of Research for their veterinary support, guidance, and animal care for the present study.
Disclosure statement
No potential conflict of interest was reported by the author(s).
Notes on contributors
Emily Scott MS is a data manager and bioinformatician in the Performance Assessment and Chemical Evaluation Laboratory at Walter Reed Army Institute of Research, Silver Spring, MD.
Matthew May MS is lab manager and researcher in the Performance Assessment and Chemical Evaluation Laboratory at Walter Reed Army Institute of Research, Silver Spring, MD.
Gabriella Silva BS is a researcher in the Performance Assessment and Chemical Evaluation Laboratory at Walter Reed Army Institute of Research, Silver Spring, MD.
Rachel Taylor PhD is Chief of Preclinical Operations in the Performance Assessment and Chemical Evaluation Laboratory at Walter Reed Army Institute of Research, Silver Spring, MD.
Nicole Fenlon PhD is Deputy Chief of Research Development and Integration at United States Army Medical Research Institute of Chemical Defense.
Emily Lowery-Gionta PhD is PI of the Performance Assessment and Chemical Evaluation Laboratory and Section Chief at Walter Reed Army Institute of Research, Silver Spring, MD.
Liana Matson PhD is Director of the Behavioral Biology Branch at Walter Reed Army Institute of Research, Silver Spring, MD.
Additional information
Funding
References
- Adamec, R. E., Shallow, T., & Budgell, J. (1997). Blockade of CCK(B) but not CCK(A) receptors before and after the stress of predator exposure prevents lasting increases in anxiety-like behavior: implications for anxiety associated with posttraumatic stress disorder. Behavioral Neuroscience, 111(2), 435–449. https://doi.org/10.1037/0735-7044.111.2.435
- Adamec, R., Fougere, D., & Risbrough, V. (2010). CRF receptor blockade prevents initiation and consolidation of stress effects on affect in the predator stress model of PTSD. The International Journal of Neuropsychopharmacology, 13(6), 747–757. https://doi.org/10.1017/S1461145709990496
- Adler, A. B., Svetlitzky, V., & Gutierrez, I. A. (2020). Post-traumatic stress disorder risk and witnessing team members in acute psychological stress during combat. BJPsych Open, 6(5), e98. https://doi.org/10.1192/bjo.2020.81
- American Psychological Association (2013). Diagnostic and statistical manual of mental disorders (5th ed.). American Psychological Association.
- Bryant, R. A., Creamer, M., O'Donnell, M., Silove, D., & McFarlane, A. C. (2012). The capacity of acute stress disorder to predict posttraumatic psychiatric disorders. Journal of Psychiatric Research, 46(2), 168–173. https://doi.org/10.1016/j.jpsychires.2011.10.007
- Bryant, R. A., Friedman, M. J., Spiegel, D., Ursano, R., & Strain, J. (2011). A review of acute stress disorder in DSM-5. Depression and Anxiety, 28(9), 802–817. https://doi.org/10.1002/da.20737
- Campos, A. C., Ferreira, F. R., da Silva, W. A., & Guimarães, F. S. (2013). Predator threat stress promotes long lasting anxiety-like behaviors and modulates synaptophysin and CB1 receptors expression in brain areas associated with PTSD symptoms. Neuroscience Letters, 533, 34–38. https://doi.org/10.1016/j.neulet.2012.11.016
- Cohen, H., & Zohar, J. (2004). An animal model of posttraumatic stress disorder: The use of cut-off behavioral criteria. Annals of the New York Academy of Sciences, 1032, 167–178. https://doi.org/10.1196/annals.1314.014
- Cohen, H., Liu, T., Kozlovsky, N., Kaplan, Z., Zohar, J., & Mathé, A. A. (2012). The neuropeptide Y (NPY)-ergic system is associated with behavioral resilience to stress exposure in an animal model of post-traumatic stress disorder. Neuropsychopharmacology, 37(2), 350–363. https://doi.org/10.1038/npp.2011.230
- Cohen, H., Zohar, J., Gidron, Y., Matar, M. A., Belkind, D., Loewenthal, U., Kozlovsky, N., & Kaplan, Z. (2006). Blunted HPA axis response to stress influences susceptibility to posttraumatic stress response in rats. Biological Psychiatry, 59(12), 1208–1218. https://doi.org/10.1016/j.biopsych.2005.12.003
- Cravedi, K. D., May, M. D., Abettan, J. A., Huckleberry, K. A., Trettel, S. G., Vuong, C. V., Altman, D. E., Gauchan, S., Shansky, R. M., Matson, L. M., Sousa, J. C., Lowery-Gionta, E. G., & Moore, N. L. T. (2021). Response and recovery of endocrine, behavioral, and neuronal morphology outcomes after different traumatic stressor exposures in male rats. Psychoneuroendocrinology, 133, 105394. https://doi.org/10.1016/j.psyneuen.2021.105394
- Ding, C., & He, X. (2004). Cluster structure of K-means clustering via principal component analysis. In Lecture notes in computer science. Springer.
- Duan, W., Guo, P., & Gan, P. (2015). Relationships among trait resilience, virtues, post-traumatic stress disorder, and post-traumatic growth. PLOS One, 10(5), e0125707. https://doi.org/10.1371/journal.pone.0125707
- Galatzer-Levy, I. R., Nickerson, A., Litz, B. T., & Marmar, C. R. (2013). Patterns of lifetime PTSD comorbidity: A latent class analysis. Depression and Anxiety, 30(5), 489–496. https://doi.org/10.1002/da.22048
- Genovese, R. F., & Dobre, S. (2017). Mitigation of adverse behavioral impact from predator exposure by the nociceptin/orphanin FQ peptide antagonist J-113397 in rats. Behavioural Pharmacology, 28(7), 521–530. https://doi.org/10.1097/FBP.0000000000000329
- Holstein, D. H., Vollenweider, F. X., Jäncke, L., Schopper, C., & Csomor, P. A. (2010). P50 suppression, prepulse inhibition, and startle reactivity in the same patient cohort suffering from posttraumatic stress disorder. Journal of Affective Disorders, 126(1–2), 188–197. https://doi.org/10.1016/j.jad.2010.02.122
- Insel, T., Cuthbert, B., Garvey, M., Heinssen, R., Pine, D. S., Quinn, K., Sanislow, C., & Wang, P. (2010). Research domain criteria (RDoC): Toward a new classification framework for research on mental disorders. The American Journal of Psychiatry, 167(7), 748–751. https://doi.org/10.1176/appi.ajp.2010.09091379
- Kessler, R. C., Sonnega, A., Bromet, E., Hughes, M., & Nelson, C. B. (1995). Posttraumatic stress disorder in the National Comorbidity Survey. Archives of General Psychiatry, 52(12), 1048–1060. https://doi.org/10.1001/archpsyc.1995.03950240066012
- Khan, S., & Liberzon, I. (2004). Topiramate attenuates exaggerated acoustic startle in an animal model of PTSD. Psychopharmacology, 172(2), 225–229. https://doi.org/10.1007/s00213-003-1634-4
- Milliken, C. S., Auchterlonie, J. L., & Hoge, C. W. (2007). Longitudinal assessment of mental health problems among active and reserve component soldiers returning from the Iraq war. JAMA, 298(18), 2141–2148. https://doi.org/10.1001/jama.298.18.2141
- Moore, N. L. T., Altman, D. E., Gauchan, S., & Genovese, R. F. (2016). Adulthood stress responses in rats are variably altered as a factor of adolescent stress exposure. Stress, 19(3), 295–302. https://doi.org/10.1080/10253890.2016.1191465
- National Academic Press (2011). Guide for care and use of laboratory animals. National Academic Press.
- Pietrzak, R. H., Goldstein, M. B., Malley, J. C., Johnson, D. C., & Southwick, S. M. (2009). Subsyndromal posttraumatic stress disorder is associated with health and psychosocial difficulties in veterans of Operations Enduring Freedom and Iraqi Freedom. Depression and Anxiety, 26(8), 739–744. https://doi.org/10.1002/da.20574
- Rasmusson, A. M., & Pineles, S. L. (2018). Neurotransmitter, peptide, and steroid hormone abnormalities in PTSD: Biological endophenotypes relevant to treatment. Current Psychiatry Reports, 20(7), 52. https://doi.org/10.1007/s11920-018-0908-9
- Ritov, G., Boltyansky, B., & Richter-Levin, G. (2016). A novel approach to PTSD modeling in rats reveals alternating patterns of limbic activity in different types of stress reaction. Molecular Psychiatry, 21(5), 630–641. https://doi.org/10.1038/mp.2015.169
- Schrader, A. J., Taylor, R. M., Lowery-Gionta, E. G., & Moore, N. L. T. (2018). Repeated elevated plus maze trials as a measure for tracking within-subjects behavioral performance in rats (Rattus norvegicus). PLOS One, 13(11), e0207804. https://doi.org/10.1371/journal.pone.0207804
- Scofield, D. E., Proctor, S. P., Kardouni, J. R., Hill, O. T., & McKinnon, C. J. (2017). Risk factors for mild traumatic brain injury and subsequent post-traumatic stress disorder and mental health disorders among United States Army Soldiers. Journal of Neurotrauma, 34(23), 3249–3255. https://doi.org/10.1089/neu.2017.5101
- Siegel, C. E., Laska, E. M., Lin, Z., Xu, M., Abu-Amara, D., Jeffers, M. K., Qian, M., Milton, N., Flory, J. D., Hammamieh, R., Daigle, B. J., Gautam, A., Dean, K. R., Reus, V. I., Wolkowitz, O. M., Mellon, S. H., Ressler, K. J., Yehuda, R., Wang, K., … Marmar, C. R. (2021). Utilization of machine learning for identifying symptom severity military-related PTSD subtypes and their biological correlates. Translational Psychiatry, 11(1), 227. https://doi.org/10.1038/s41398-021-01324-8
- Taylor, R. M., Jeong, I. H., May, M. D., Bergman, E. M., Capaldi, V. F., Moore, N. L. T., Matson, L. M., & Lowery-Gionta, E. G. (2020). Fear expression is reduced after acute and repeated nociceptin/orphanin FQ (NOP) receptor antagonism in rats: therapeutic implications for traumatic stress exposure. Psychopharmacology, 237(10), 2943–2958. https://doi.org/10.1007/s00213-020-05582-0
- World Health Organization (1993). The ICD-10 classification of mental and behavioural disorders. World Health Organization.
- Yang, R., Gautam, A., Getnet, D., Daigle, B. J., Miller, S., Misganaw, B., Dean, K. R., Kumar, R., Muhie, S., Wang, K., Lee, I., Abu-Amara, D., Flory, J. D., Hood, L., Wolkowitz, O. M., Mellon, S. H., Doyle, F. J., Yehuda, R., Marmar, C. R., … Jett, M. (2021). Epigenetic biotypes of post-traumatic stress disorder in war-zone exposed veteran and active duty males. Molecular Psychiatry, 26(8), 4300–4314. https://doi.org/10.1038/s41380-020-00966-2