
Abstract
Chronic sleep disorders (CSD) comprise a potential risk factor for metabolic and cardiovascular diseases, obesity and stroke. Thus, the identification of biomarkers for CSD is an important step in the early prevention of metabolic dysfunctions induced by sleep dysfunction. Diagnostic saliva samples can be easily and noninvasively collected. Thus, we aimed to identify whole microRNA (miRNA) profiles of saliva in control and psychophysiologically stressed CSD mouse models and compare them at Zeitgeber time (ZT) 0 (lights on) and ZT12 (lights off). The findings of two-way ANOVA revealed that the expression of 342 and 109 salivary miRNAs was affected by CSD and the time of day, respectively. Interactions were found in 122 miRNAs among which, we identified 197 (ZT0) and 62 (ZT12) upregulated, and 40 (ZT0) and seven (ZT12) downregulated miRNAs in CSD mice. We showed that miR-30c-5p, which is elevated in the plasma of patients with hypersomnia, was upregulated in the saliva of CSD mice collected at ZT0. The miRNAs, miR-10a-5p, miR-146b-5p, miR-150-5p, and miR-25-3p are upregulated in the serum of humans with poor sleep quality, and these were also upregulated in the saliva of CSD mice collected at ZT0. The miRNAs miR-30c, miR146b-5p, miR150, and miR-25-5p are associated with cardiovascular diseases, and we found that plasma concentrations of brain natriuretic peptides were significantly increased in CSD mice. The present findings showed that salivary miRNA profiles could serve as useful biomarkers for predicting CSD.
Introduction
Sleep disorders are associated with cumulative neurobehavioral deficits, impaired cognitive functions (Van Dongen et al., Citation2003), and mood and anxiety disorders such as depression (Taylor et al., Citation2005). These can be risk factors for hypertension (Makarem et al., Citation2019), obesity and diabetes (Spiegel et al., Citation2009), cardiovascular disease (Cappuccio et al., Citation2011; Grandner et al., Citation2012), and stroke (Wallace et al., Citation2012). Although the pathophysiological mechanisms of chronic sleep disorders (CSDs) are not fully understood, mental stress might be related to the mechanisms underlying CSDs in humans (Kalmbach et al., Citation2018). The hypothalamic–pituitary–adrenal (HPA) axis that regulates and controls responses to stress, plays important roles in modulating sleep. Dysfunction of the HPA axis can disrupt sleep regulation (sleep homeostasis and circadian rhythms) and maintain chronic insomnia (Buckley & Schatzberg, Citation2005). Corticotropin-releasing hormone, a major neuromodulator of the neuroendocrine stress response, has been suggested to mediate the wakefulness (F. C. Chang & Opp, Citation2001). Recently, Ono et al. demonstrated that the circadian regulation of wakefulness was transmitted via corticotropin-releasing factor neurons in the paraventricular nucleus of the hypothalamus to orexin neurons in the lateral hypothalamus (Ono et al., Citation2020). Indeed, animal models of psychological stress, such as immobilization stress and social defeat stress, showed impaired sleep quality (Cespuglio et al., Citation1995; Meerlo et al., Citation1997). Therefore, psychophysiological stress biomarkers are important to identify for early CSD prevention and diagnosis.
Conventional mouse models of sleep disruption include disk-over-water, gentle handling, and slowly rotating wheels (Toth & Bhargava, Citation2013). However, information derived from forced physical sleep deprivation is limited to evaluating the effects of chronic psychophysiological stress on sleep disorders. We previously developed a mouse model of CSD induced by long-term psychophysiological stress (Miyazaki et al., Citation2013). Plasma levels of catecholamines are upregulated by long-term psychophysiological stress in CSD mice, suggesting activation of the sympathetic–adrenal medullary axis (Miyazaki et al., Citation2013). The amplitude of circadian rhythms of wheel running, sleep–wake cycles, sleep fragmentation, and hyperphagia is reduced in CSD model mice for several weeks without adaptation (Higo-Yamamoto et al., Citation2019; Oishi et al., Citation2014, Citation2018, Citation2020). The CSD mice developed hypoleptinemia-induced hyperphagia and impaired glucose tolerance (Oishi et al., Citation2014, Citation2018) as do insomniac humans (Briançon-Marjollet et al., Citation2015). Thus, understanding CSD biomarkers in mouse models should lead to the discovery of novel and potential biomarkers of early sleep dysfunction in humans.
Saliva is easy to collect, noninvasive, and a cost-effective target for clinical diagnosis. Saliva collection does not require trained professionals and has no risk of infection by contaminated needles (Bonne & Wong, Citation2012). Among several diagnostic targets in saliva, miRNAs might be reliable markers of CSD, as exosomes protect miRNAs from enzymatic degradation (Valadi et al., Citation2007). Salivary miRNAs might be diagnostic biomarkers of head and neck (Salazar et al., Citation2014), pancreatic (Humeau et al., Citation2015), and colorectal (Majem et al., Citation2019) cancers, as well as neuropsychiatric disorders, such as autism spectrum disorder (Hicks et al., Citation2016) and Parkinson disease (Cressatti et al., Citation2020). However, whether salivary miRNAs could be a diagnostic target for CSD remains unknown. Sleep problems in the clinical setting have been evaluated using the Pittsburgh Sleep Quality Index and the St. Mary’s Hospital Sleep Questionnaire. However, biomarkers should be more useful than subjective questionnaires for diagnosing CSD, because they can objectively indicate early manifestations of sleep problems. Thus, we quantified whole salivary miRNA profiles in CSD mouse models. We found that CSD affected the expression of several salivary miRNAs. Blood levels of some of them, namely miR-10a-5p, miR-146b-5p, miR-150-5p, and miR25-3p, might be associated with poor sleep quality in humans (Baek et al., Citation2021). Among these CSD-sensitive miRNAs, miR-146b-5p, miR-150-5p, and miR25-3p are associated with cardiovascular diseases and stroke (T. Y. Chang et al., Citation2017; Li et al., Citation2021; R. Zhang et al., Citation2015). We also quantified blood–brain natriuretic peptide (BNP), a biomarker of cardiac impairment, in the CSD mice to determine whether the altered expression of these salivary miRNAs indicates CSD-induced cardiovascular dysfunction.
Materials and methods
Animals
Five-week-old male C3H/HeN mice (Japan SLC Inc., Hamamatsu, Japan) were individually maintained in plastic cages containing paper chip bedding and running wheels (SW-15; Melquest Y.K, Toyama, Japan) were provided free access to a standard diet (AIN-93G; Oriental Yeast, Tokyo) under a 12-h light/dark cycle (LD 12:12; lights on at Zeitgeber time [ZT] 0). A white fluorescent lamp placed at cage level provided light (350 lx) for 2 weeks until daily wheel-running activity reached a plateau (Miyazaki et al., Citation2013).
The mice were assigned to the following groups (n = 5 per group): control (not stressed) at ZT0 and ZT12, and CSD at ZT0 and ZT12. The CSD mice were created by exposing them to psychophysiological stress for 1 week as described (Miyazaki et al., Citation2013). Briefly, we replaced paper-chip bedding in the cages with 1.5 cm of water, which caused the mice to remain on wheels 24 h per day for 7 days. The paradigm of CSD model shows minimal effect on body weight gain in mice (Oishi et al., Citation2014). Wheel-running activity was continuously recorded at 1-min intervals using a Chronobiology Kit® (Stanford Software Systems, Stanford, CA, USA). The Animal Care and Use Committee at the National Institute of Advanced Industrial Science and Technology (AIST) approved all animal experiments (Permission #2021-0338).
Sample collection
After 1 week of CSD, all mice were anesthetized using isoflurane at ZT0 and ZT12, then intraperitoneally injected with 15 mg/kg of pilocarpine–HCl (FujiFilm Wako Pure Chemical Corp., Osaka, Japan), which induces parotid saliva secretion by stimulating M1 and M3 muscarinic acetylcholine receptors (Gautam et al., Citation2004). Salivary samples (200 µL) were collected from each mouse after a few minutes using a micropipette. Immediately thereafter, the samples were centrifuged at 5,800×g for 15 min at 4 °C and stored at −80 °C.
Salivary microRNA-seq
Total RNA isolated from the salivary samples using miRNeasy Serum/Plasma Kits (Qiagen, Hilden, Germany) was analyzed at DNA Chip Research Inc. (Tokyo, Japan). The quality of the RNA samples was assessed using an Agilent 2100 Bioanalyzer (Agilent Technologies Inc., San Jose, CA, USA) with Agilent RNA6000 Pico and small RNA kits (Agilent Technologies). We confirmed that the samples mostly comprised sRNAs.
Sequencing libraries were constructed using QIAseq miRNA Library Kits (Qiagen) with a unique molecular indices (UMIs) tag that eliminates PCR and sequencing bias, allows and accurate quantitation of mature miRNAs. The quality of the libraries was assessed using an Agilent 2100 Bioanalyzer (Agilent Technologies) with High-Sensitivity DNA kits (Agilent Technologies). We confirmed that the sequences were 155–200 bp in length.
We sequenced equally pooled libraries with 76-basepair (bp) single-end reads in 20 samples (n = 5 per group per time point) using a NextSeq 500 (Illumina, Inc., San Diego, CA, USA). Over 1 × 10⁷ reads generated from all samples were aligned to miRBase v21 (http://www.mirbase.org) and piRNABank (http://pirnabank.ibab.ac.in/) using the GeneGlobe data analysis center (Qiagen). All reads assigned to a specific miRNA or piRNA were counted and associated UMIs were aggregated to quantify unique molecules. A matrix of miRNAs or piRNAs with UMIs was analyzed downstream using Strand NGS 3.4. The UMIs were normalized using the trimmed mean of M values (TMM) (Robinson & Oshlack, Citation2010). A lower limit of miRNA expression was not set.
Hierarchical clustering
All samples were hierarchically clustered using miRNA gene sets, and similarities were compared among samples using clustering algorithms, Euclidean distance, and the Ward method. Hierarchical clusters were analyzed using Strand NGS.
Gene Ontology and pathway analysis
We used Gene Ontology (GO) terms and pathways to summarize the biological aspects of miRNA-targeted genes. We determined the probability of a gene corresponding to those categorized by GO using Strand NGS. Pathways were statistically analyzed using the collection in the WikiPathways database (Slenter et al., Citation2018) and the PathVisio tool (Kutmon et al., Citation2015). We then determined pathways with the most changes in expression considering the numbers of genes measured and those that were differentially expressed. Under hypergeometric distribution, z scores were calculated by subtracting the predicted number of genes meeting the criterion from the actual number, then dividing the difference by the standard deviation of the actual number.
Measurements of BNP
Blood collected from CSD and control mice by puncturing the inferior vena cava under inhaled anesthesia was stored in tubes coated with ethylenediaminetetraacetic acid and centrifuged at 4,500×g at 4 °C for 10 min. The supernatant was stored at −80 °C. Blood BNP levels were measured using a RayBiotech Mouse/Rat BNP Enzyme Immunoassay Kit (RayBiotech, Peachtree Corners, GA, USA), as described by the manufacturer.
Statistical analysis
Data for wheel-running activity were statistically evaluated using two-way analysis of variance (ANOVA) followed by Tukey–Kramer multiple comparisons using Excel-Tokei 2010 (Social Survey Research Information Co. Ltd., Osaka, Japan). Values with p < 0.05 were considered statistically significant.
We determined the false discovery rate (FDR) using the methods of Benjamini and Hochberg (Citation1995) and Storey and Tibshirani (Citation2003) to control p for multiple comparisons. The significance threshold was set at a q < 0.05. We initially analyzed the effects of CSD and the time of day (ZT0 or ZT12) on salivary miRNAs using two-way ANOVA, then applied Welch t tests to determine salivary miRNAs in the mice that were significantly affected by CSD, ZT, or significant interactions between them. Data were statistically analyzed using Strand NGS 3.4. Pathways were considered significantly related to CSD at values for z > 1.96 and permuted p < 0.05.
Results
Circadian wheel-running activity by CSD model mice
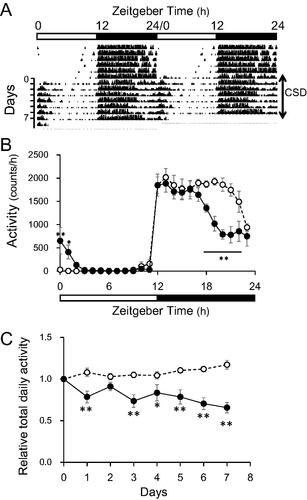
The circadian disruption of wheel-running induced by CSD persisted without adaptation and exhaustion throughout the study (). Nocturnal wheel-running by the mice with CSD decreased, whereas that in the morning increased as described (). Total daily activity gradually decreased by 56% during the week ().
Figure 1. Wheel-running activity of control and CSD mice. (A) Representative double-plot actogram shows wheel-running behavior in CSD mice (n=?). (B) Temporal patterns of wheel-running activities in control and CSD mice. Horizontal unfilled and filled bars indicate day and night, respectively. (C) Relative changes in total daily activity. Unfilled and filled circles indicate control and CSD mice, respectively. Data are shown as means ± SEM (n = 5) of significant main effects or interactions. *p < 0.05 and **p < 0.01 Tukey–Kramer multiple comparisons; significant differences at corresponding time or day between groups. CSD: chronic sleep disorder.
Salivary microRNA-seq of CSD model mice
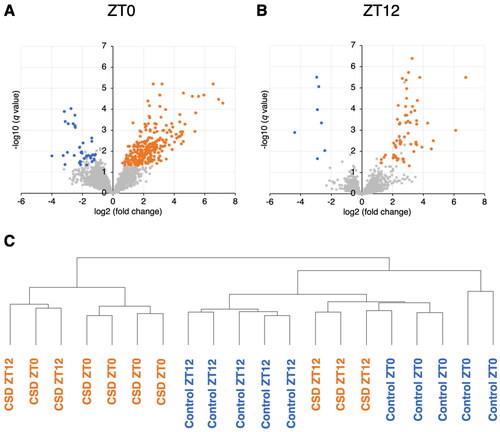
Micro RNAs in saliva from control and CSD mice were sequenced at ZT0 and ZT12. Wheel-running activity decreased and slightly increased during the active and inactive phases in CSD, compared with control mice (data not shown) as previously described (Oishi et al., Citation2014). The two-way ANOVA revealed that the expression of 342 and 109 salivary miRNAs was significantly affected by CSD and the time of day (ZT0 or ZT12), respectively (Supplementary Table S1). We also found interaction effects between CSD and timing in 122 salivary miRNAs (Supplementary Table S1). Among the salivary miRNAs that were significantly affected by CSD or interactions, 197 and 40 were respectively upregulated, whereas 62 and 7 were respectively downregulated in the CSD mice at ZT0 (; Supplementary Tables S2 and S3), and ZT12, respectively (; Supplementary Tables S4 and S5). Among the salivary miRNAs that were significantly affected by timing or interactions, 52 and 65 miRNAs fluctuated >2-fold between ZT0 and ZT12 in controls (Supplementary Table S6) and CSD (Supplementary Table S7) mice, respectively. Among the 52 rhythmic miRNAs in control mice, 41 and 11 miRNAs were increased at ZT0 and ZT12, respectively, although among 53 and 12 of the 65 rhythmic miRNAs, were increased in CSD mice at ZT0 and ZT12, respectively. Among them, only six miRNAs fluctuated in both control and CSD mice. The hierarchical clustering results revealed that the data obtained from CSD and control saliva collected at ZT0 could be classified into different groups. However, those collected at ZT12 were closer between the control and CSD ().
Figure 2. Volcano plots of miRNAs affected by CSD in mouse saliva. Saliva collected at (A) ZT0 and (B) ZT12 (n=each 5). Red and blue dots, significantly upregulated and downregulated miRNAs respectively, in CSD, vs. control mice (q < 0.05 Welch t tests; fold change >2 or <–2). These miRNAs were also significantly affected by CSD or significant interaction between CSD and timing (two-way ANOVA). (C) Hierarchical clustering analysis based on miRNA profiles of 20 samples from control and CSD mice collected at ZT0 and ZT12.
Identification of pathways of miRNA-target genes affected by CSD
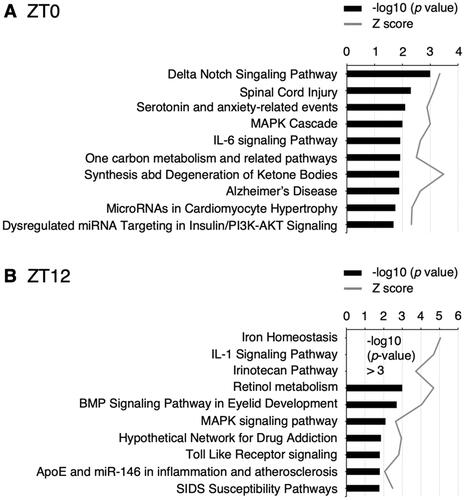
Gene Ontology analyses revealed that pathways associated with neurodegenerative diseases, spinal cord injury, Alzheimer disease, inflammation, IL-6 and IL-1 signaling, were related to CSD (; Supplementary Tables S8 and S9).
Figure 3. Top 10 pathways significantly associated with the miRNA-target genes modulated by CSD and z scores. Saliva was collected at ZT0 (A) and ZT12 (B).
Blood BNP levels in control vs. CSD mice
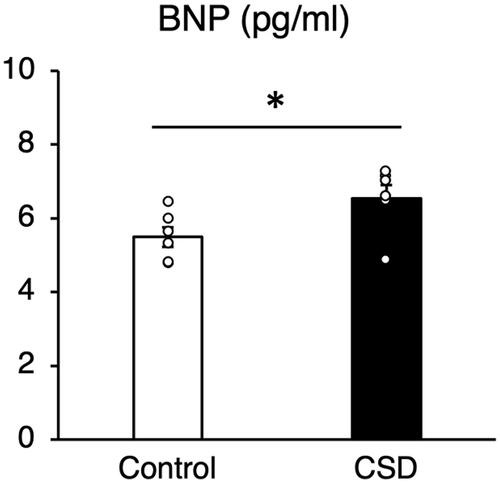
Levels of BNP were upregulated in CSD, compared with control mice, indicating that CSD affects the cardiovascular system (Struthers, Citation2002; ).
Figure 4. Blood–brain natriuretic peptide (BNP) concentrations in blood of control and CSD mice. Values are shown as means ± SE (pg/mL). *p < 0.05 Welch t tests (n=6).
Discussion
The CSD model mice used herein developed disrupted circadian rhythms of locomotor activity and sleep–wake cycles, sleep fragmentation, and hyperphagia, for several weeks without adaptation (Oishi et al., Citation2014, Citation2018, Citation2020). These mice also developed hyperphagia with hypoleptinemia and impaired glucose tolerance (Oishi et al., Citation2014, Citation2018) that are also found in humans with insomnia (Briançon-Marjollet et al., Citation2015). Thus, investigating biomarkers of CSD in these mouse models should facilitate the discovery of novel and potential biomarkers of sleep dysfunction in humans.
The present study found that 342 and 109 salivary miRNAs were affected by CSD and timing, respectively (; Supplementary Table S1). Among them, 197 and 62 miRNAs were upregulated at ZT0 and ZT12, respectively (Supplementary Table S2 and S4), whereas 40 and 7 were downregulated at ZT0 and ZT12, respectively (Supplementary Table S3 and S5), in CSD mice. The hierarchical clustering results revealed that the data obtained at ZT0 were classified into different groups, but the data obtained at ZT12 were not (). The results of the two-way ANOVA revealed interaction effects of CSD and the time of day in 122 salivary miRNAs (Supplementary Table S1), and more miRNAs were significantly affected by CSD at ZT0 than at ZT12 (). These results suggested that CSD affects the salivary miRNA profiles depending on the time of day and that the effects of CSD might be reflected more obviously in saliva collected at ZT0 than ZT12. Locomotor activity significantly decreased during the second half of the dark period, despite an increase at the start of the light period in the CSD mice (). Inactivity during the active phase would affect miRNA expression at ZT0 in CSD mice. Decreased wheel-running activity might reduce miRNA turnover by suppressing miRNA decay and increasing miRNA expression in CSD mice.
We found that miR-30c-5p was upregulated in the saliva of CSD mice at ZT0 (Supplementary Table S2). Serum miR-30c is consistently upregulated in young patients with forced sleep deprivation (Weigend et al., Citation2019). Thus, salivary and blood levels of miR-30c might be associated, indicating that it could be a biomarker of sleep dysfunction. Further functional analyses of miR-30c should expand understanding of the pathophysiology of CSD and circadian rhythm dysfunction caused by CSD. Micro RNA-30c induces hypertrophy in rat cardiomyocytes (Jentzsch et al., Citation2012), and miR-30c plays an important role in diabetic cardiomyopathy (Yin et al., Citation2019). Therefore, the function of miR-30c might be related to the molecular mechanisms underlying cardiovascular diseases caused by sleep disorders (Cappuccio et al., Citation2011; Grandner et al., Citation2012). We also found that CSD significantly affected upregulated salivary miR-137-5p (Supplementary Table S1), in CSD mice at ZT0. Orexin signaling might directly regulate miR-137, which is involved in sleep–wake stability (Holm et al., Citation2022). These results indicated that miR-137-5p is involved in the disruption of sleep–wake cycles in CSD model mice.
Among 59 miRNAs that are altered in the serum of humans with poor sleep quality (Baek et al., Citation2021), four (miR-10a-5p, miR-146b-5p, miR-150-5p, and miR-25-3p) were upregulated in saliva from CSD mice (Supplementary Table S2). Therefore, these miRNAs clearly reflect poor sleep. The miR-10a-5p directly modulates brain-derived neurotrophic factor (BDNF) expression (X.-Y. Zhang et al., Citation2018). The increase in salivary miR-10a-5p levels might reflect psychophysiological stress in CSD mice because salivary BDNF concentrations are reduced in rats stressed by social isolation (Nakagawa et al., Citation2019). Increased levels of miR-10a-5p might be involved in sleep dysfunction-related neurobehavioral deficits such as impaired cognitive function (Van Dongen et al., Citation2003). In addition, miR-146b-5p, miR-150, and miR-25-5p are associated with cardiovascular diseases and stroke. Plasma levels of miR-146b-5p and miR-150 are upregulated in patients with coronary artery disease (CAD) and acute myocardial infarction (T. Y. Chang et al., Citation2017; R. Zhang et al., Citation2015), whereas plasma miR-25-5p levels are downregulated in patients CAD (Li et al., Citation2021). Cardiovascular diseases are associated with sleep disorders (Cappuccio et al., Citation2011; Grandner et al., Citation2012; Wallace et al., Citation2012), and electrocardiography has revealed heart failure in CSD model mice with pathogenic CD4+ cell transfer or microinjected cytokines (Arima et al., Citation2017). We found upregulated blood BNP levels in CSD model mice, suggesting that these miRNAs are associated with cardiovascular diseases induced by sleep disorders.
We identified 52 and 65 miRNAs that significantly fluctuated between ZT0 and ZT12 in control and CSD mice, respectively (Supplementary Tables S6 and S7). Notably, only six miRNAs (piR-020553, miR-297b-5p, miR-3085-3p, miR-466q, miR-669f-3p, and miR-6918-3p) were rhythmically expressed in the control and CSD mice (Supplementary Tables S6 and S7). These miRNAs might be directly regulated by the core component of the molecular clock because the circadian mRNA expression of clock genes was not significantly affected in the CSD mice (Miyazaki et al., Citation2013; Oishi et al., Citation2014).
Several pathways were significantly affected by the CSD (; Supplementary Tables S8 and S9). The range of salivary miRNAs remarkably differed between ZT0 and ZT12 in control and CSD mice (Supplementary Tables S2–S5), and pathways affected by CSD were also dependent on sampling time (Supplementary Tables S8 and S9). Pathways associated with neural injury and neurodegenerative diseases, such as spinal cord injury and Alzheimer disease, were significantly affected by CSD at ZT0 (). Sleep disorders bidirectionally interact with neurodegenerative disorders, such as Alzheimer disease (Abbott & Videnovic, Citation2016). Chronic sleep restriction increases amyloid-β plaque formation, which is considered a contributing factor to the development of Alzheimer disease in mice (Kang et al., Citation2009). Our findings suggested that salivary miRNAs could serve as biomarkers of neural injury and neurodegenerative diseases induced by sleep disorders.
Pathways associated with inflammation, such as IL-6 and IL-1 signaling were significantly affected by CSD at ZT0 and ZT12, respectively (). Secreted inflammatory cytokines, such as IL-6 and IL-1β, as well as oxidative stress might be involved in the multi-organ injury induced by sleep deprivation (Periasamy et al., Citation2015). Plasma IL-6 concentrations in healthy humans have biphasic circadian patterns, with nadirs at 08:00. and 21:00 and zeniths at 19:00 and 05:00 a.m. (Vgontzas et al., Citation1999). In contrast, sleep deprivation does not affect overall plasma IL-6 secretion, but IL-6 concentrations in humans with sleep deprivation increase and decrease during the daytime and nighttime, respectively (Vgontzas et al., Citation1999). Paradoxical sleep deprivation upregulates serum IL-6 concentrations and miRNAs associated with inflammatory responses (Brianza-Padilla et al., Citation2018), and sleep deprivation elevates serum IL-1β and IL-6 levels in mice (Periasamy et al., Citation2015). Specifically, brain microglia comprise a crucial source of IL-1β, which is involved in regulating the duration of non-rapid eye movement sleep (Krueger et al., Citation2008; Schmidt et al., Citation2015). Thus, the IL-1 signaling pathway identified herein might indicate inflammation in the central nervous system. Oxidative stress levels are elevated in various brain regions in animal models of sleep deprivation (Villafuerte et al., Citation2015), and supplementation with dietary natural cocoa, containing antioxidant and neuroprotective flavonoids, ameliorates sleep disorders in CSD model mice by affecting the central nervous system (Oishi et al., Citation2020). Thus, the present findings provide further evidence that sleep disorders induce inflammatory responses that are mediated by miRNAs and suggest that salivary miRNA profiles indicate inflammation in the central nervous system.
Our study has some limitations. First, we collected pilocarpine-induced saliva from mice under isoflurane anesthesia, whereas such processes are not needed to obtain human saliva. The effects of pilocarpine or isoflurane on salivary miRNA expression might require consideration. Second, we used only male mice in the present study. Risk of sleep disorders is higher in women, than in men. Gender differences in the effects of sleep disturbances on salivary miRNA expression await further investigation.
In conclusion, the present findings showed that chronic psychophysiological stress alters salivary miRNA profiles in mouse models of CSD. Animal models have the advantage of a controlled genetic and environmental background, compared with humans. The present study revealed that CSD and circadian rhythms affect many salivary miRNAs, many of which corresponded to findings in humans with poor sleep quality. We identified over 200 miRNAs that were modulated by CSD. Although the functions of these miRNAs are largely unknown, further functional analyses of miRNAs will expand understanding of the pathophysiological mechanisms of sleep disorders and CSD-related metabolic and psychological diseases. Taken together, the present findings revealed novel miRNA biomarkers in saliva that could be useful for the early noninvasive diagnosis of sleep dysfunction
Supplemental Material
Download Zip (858.4 KB)Acknowledgments
We are grateful to the staff of DNA Chip Research Inc. for the miRNA-seq of saliva samples and data analysis.
Disclosure statement
No potential conflict of interest was reported by the author(s).
Correction Statement
This article has been republished with minor changes. These changes do not impact the academic content of the article.
Additional information
Funding
References
- Abbott, S. M., & Videnovic, A. (2016). Chronic sleep disturbance and neural injury: Links to neurodegenerative disease. Nature & Science of Sleep, 8, 55–61. https://doi.org/10.2147/NSS.S34842
- Arima, Y., Ohki, T., Nishikawa, N., Higuchi, K., Ota, M., Tanaka, Y., Nio-Kobayashi, J., Elfeky, M., Sakai, R., Mori, Y., Kawamoto, T., Stofkova, A., Sakashita, Y., Morimoto, Y., Kuwatani, M., Iwanaga, T., Yoshioka, Y., Sakamoto, N., Yoshimura, A., & Murakami, M. (2017). Brain micro-inflammation at specific vessels dysregulates organ-homeostasis via the activation of a new neural circuit. eLife, 6, e25517. https://doi.org/10.7554/eLife.25517
- Baek, S.-J., Ban, H.-J., Park, S.-M., Lee, B., Choi, Y., Baek, Y., Lee, S., & Cha, S. (2021). Circulating microRNAs as potential diagnostic biomarkers for poor sleep quality. Nature & Science of Sleep, 13, 1001–1012. https://doi.org/10.2147/NSS.S311541
- Benjamini, Y., & Hochberg, Y. (1995). Controlling the false discovery rate: A practical and powerful approach to multiple testing. Journal of the Royal Statistical Society: Series B (Methodological), 57(1), 289–300. https://doi.org/10.1111/j.2517-6161.1995.tb02031.x
- Bonne, N. J., & Wong, D. T. (2012). Salivary biomarker development using genomic, proteomic and metabolomic approaches. Genome Medicine, 4(10), 82–12. https://doi.org/10.1186/gm383
- Briançon-Marjollet, A., Weiszenstein, M., Henri, M., Thomas, A., Godin-Ribuot, D., & Polak, J. (2015). The impact of sleep disorders on glucose metabolism: Endocrine and molecular mechanisms. Diabetology & Metabolic Syndrome, 7(1), 1–16. https://doi.org/10.1186/s13098-015-0018-3
- Brianza-Padilla, M., Sánchez-Muñoz, F., Vázquez-Palacios, G., Huang, F., Almanza-Pérez, J. C., Bojalil, R., & Bonilla-Jaime, H. (2018). Cytokine and microRNA levels during different periods of paradoxical sleep deprivation and sleep recovery in rats. Peer Journal, 6, e5567. https://doi.org/10.7717/peerj.5567
- Buckley, T. M., & Schatzberg, A. F. (2005). On the interactions of the hypothalamic-pituitary-adrenal (HPA) axis and sleep: Normal HPA axis activity and circadian rhythm, exemplary sleep disorders. The Journal of Clinical Endocrinology & Metabolism, 90(5), 3106–3114. https://doi.org/10.1210/jc.2004-1056
- Cappuccio, F. P., Cooper, D., D'Elia, L., Strazzullo, P., & Miller, M. A. (2011). Sleep duration predicts cardiovascular outcomes: A systematic review and meta-analysis of prospective studies. European Heart Journal, 32(12), 1484–1492. https://doi.org/10.1093/eurheartj/ehr007
- Cespuglio, R., Marinesco, S., Baubet, V., Bonnet, C., & El Kafi, B. (1995). Evidence for a sleep-promoting influence of stress. Advances in Neuroimmunology, 5(2), 145–154. https://doi.org/10.1016/0960-5428(95)00005-M
- Chang, F. C., & Opp, M. R. (2001). Corticotropin-releasing hormone (CRH) as a regulator of waking. Neuroscience & Biobehavioral Reviews, 25(5), 445–453. https://doi.org/10.1016/S0149-7634(01)00024-0
- Chang, T.-Y., Tsai, W.-C., Huang, T.-S., Su, S.-H., Chang, C.-Y., Ma, H.-Y., Wu, C.-H., Yang, C.-Y., Lin, C.-H., Huang, P.-H., Cheng, C.-C., Cheng, S.-M., & Wang, H.-W. (2017). Dysregulation of endothelial colony-forming cell function by a negative feedback loop of circulating miR-146a and-146b in cardiovascular disease patients. PLoS One, 12(7), e0181562. https://doi.org/10.1371/journal.pone.0181562
- Cressatti, M., Juwara, L., Galindez, J. M., Velly, A. M., Nkurunziza, E. S., Marier, S., Canie, O., Gornistky, M., & Schipper, H. M. (2020). Salivary microR‐153 and microR‐223 levels as potential diagnostic biomarkers of idiopathic Parkinson’s disease. Movement Disorders, 35(3), 468–477. https://doi.org/10.1002/mds.27935
- Gautam, D., Heard, T. S., Cui, Y., Miller, G., Bloodworth, L., & Wess, J. (2004). Cholinergic stimulation of salivary secretion studied with M1 and M3 muscarinic receptor single-and double-knockout mice. Molecular Pharmacology, 66(2), 260–267. https://doi.org/10.1124/mol.66.2.260
- Grandner, M. A., Jackson, N. J., Pak, V. M., & Gehrman, P. R. (2012). Sleep disturbance is associated with cardiovascular and metabolic disorders. Journal of Sleep Research, 21(4), 427–433. https://doi.org/10.1111/j.1365-2869.2011.00990.x
- Hicks, S. D., Ignacio, C., Gentile, K., & Middleton, F. A. (2016). Salivary miRNA profiles identify children with autism spectrum disorder, correlate with adaptive behavior, and implicate ASD candidate genes involved in neurodevelopment. BMC Pediatrics, 16(1), 1–11. https://doi.org/10.1186/s12887-016-0586-x
- Higo-Yamamoto, S., Yamamoto, S., Miyazaki, K., Nakakita, Y., Kaneda, H., Takata, Y., Nakamura, T., & Oishi, K. (2019). Dietary heat-killed Lactobacillus brevis SBC8803 attenuates chronic sleep disorders induced by psychophysiological stress in mice. Journal of Nutritional Science & Vitaminology, 65(2), 164–170. https://doi.org/10.3177/jnsv.65.164
- Holm, A., Possovre, M.-L., Bandarabadi, M., Moseholm, K. F., Justinussen, J. L., Bozic, I., Lemcke, R., Arribat, Y., Amati, F., Silahtaroglu, A., Juventin, M., Adamantidis, A., Tafti, M., & Kornum, B. R. (2022). The evolutionarily conserved miRNA-137 targets the neuropeptide hypocretin/orexin and modulates the wake to sleep ratio. Proceedings of the National Academy of Sciences of the United States of America, 119(17), e2112225119. https://doi.org/10.1073/pnas.2112225119
- Humeau, M., Vignolle-Vidoni, A., Sicard, F., Martins, F., Bournet, B., Buscail, L., Torrisani, J., & Cordelier, P. (2015). Salivary microRNA in pancreatic cancer patients. PLoS One, 10(6), e0130996. https://doi.org/10.1371/journal.pone.0130996
- Jentzsch, C., Leierseder, S., Loyer, X., Flohrschütz, I., Sassi, Y., Hartmann, D., Thum, T., Laggerbauer, B., & Engelhardt, S. (2012). A phenotypic screen to identify hypertrophy-modulating microRNAs in primary cardiomyocytes. Journal of Molecular & Cellular Cardiology, 52(1), 13–20. https://doi.org/10.1016/j.yjmcc.2011.07.010
- Kalmbach, D. A., Anderson, J. R., & Drake, C. L. (2018). The impact of stress on sleep: Pathogenic sleep reactivity as a vulnerability to insomnia and circadian disorders. Journal of Sleep Research, 27(6), e12710. https://doi.org/10.1111/jsr.12710
- Kang, J.-E., Lim, M. M., Bateman, R. J., Lee, J. J., Smyth, L. P., Cirrito, J. R., Fujiki, N., Nishino, S., & Holtzman, D. M. (2009). Amyloid-beta dynamics are regulated by orexin and the sleep-wake cycle. Science, 326(5955), 1005–1007. https://doi.org/10.1126/science.1180962
- Krueger, J. M., Rector, D. M., Roy, S., Van Dongen, H. P. A., Belenky, G., & Panksepp, J. (2008). Sleep as a fundamental property of neuronal assemblies. Nature Reviews: Neuroscience, 9(12), 910–919. https://doi.org/10.1038/nrn2521
- Kutmon, M., van Iersel, M. P., Bohler, A., Kelder, T., Nunes, N., Pico, A. R., & Evelo, C. T. (2015). PathVisio 3: An extendable pathway analysis toolbox. PLoS Computational Biology, 11(2), e1004085. https://doi.org/10.1371/journal.pcbi.1004085
- Li, P., Li, Y., Chen, L., Ma, X., Yan, X., Yan, M., Qian, B., Wang, F., Xu, J., Yin, J., Xu, G., & Sun, K. (2021). Long noncoding RNA uc003pxg. 1 regulates endothelial cell proliferation and migration via miR-25-5p in coronary artery disease. International Journal of Molecular Medicine, 48(2), 1–13. https://doi.org/10.3892/ijmm.2021.4993
- Majem, Á.-C., Díaz-Peña, A., Suárez-Cabrera, G.-M., Santamaría, L.-L., & Muinelo-Romay, S.-C. (2019). A novel saliva-based miRNA signature for colorectal cancer diagnosis. Journal of Clinical Medicine, 8(12), 2029. https://doi.org/10.3390/jcm8122029
- Makarem, N., Shechter, A., Carnethon, M. R., Mullington, J. M., Hall, M. H., & Abdalla, M. (2019). Sleep duration and blood pressure: Recent advances and future directions. Current Hypertension Reports, 21(5), 1–12. https://doi.org/10.1007/s11906-019-0938-7
- Meerlo, P., Pragt, B. J., & Daan, S. (1997). Social stress induces high intensity sleep in rats. Neuroscience Letters, 225(1), 41–44. https://doi.org/10.1016/S0304-3940(97)00180-8
- Miyazaki, K., Itoh, N., Ohyama, S., Kadota, K., & Oishi, K. (2013). Continuous exposure to a novel stressor based on water aversion induces abnormal circadian locomotor rhythms and sleep-wake cycles in mice. PLoS One, 8(1), e55452. https://doi.org/10.1371/journal.pone.0055452
- Nakagawa, Y., To, M., Saruta, J., Yamamoto, Y., Yamamoto, T., Shimizu, T., Kamata, Y., Matsuo, M., & Tsukinoki, K. (2019). Effect of social isolation stress on saliva BDNF in rat. Journal of Oral Science, 61(4), 516–520. https://doi.org/10.2334/josnusd.18-0409
- Oishi, K., Ohyama, S., & Higo-Yamamoto, S. (2018). Chronic sleep disorder induced by psychophysiological stress induces glucose intolerance without adipose inflammation in mice. Biochemical & Biophysical Research Communications, 495(4), 2616–2621. https://doi.org/10.1016/j.bbrc.2017.12.158
- Oishi, K., Okauchi, H., Yamamoto, S., & Higo-Yamamoto, S. (2020). Dietary natural cocoa ameliorates disrupted circadian rhythms in locomotor activity and sleep–wake cycles in mice with chronic sleep disorders caused by psychophysiological stress. Nutrition, 75–76, 110751. https://doi.org/10.1016/j.nut.2020.110751
- Oishi, K., Yamamoto, S., Itoh, N., Miyazaki, K., Nemoto, T., Nakakita, Y., & Kaneda, H. (2014). Disruption of behavioral circadian rhythms induced by psychophysiological stress affects plasma free amino acid profiles without affecting peripheral clock gene expression in mice. Biochemical & Biophysical Research Communications, 450(1), 880–884. https://doi.org/10.1016/j.bbrc.2014.06.083
- Ono, D., Mukai, Y., Hung, C. J., Chowdhury, S., Sugiyama, T., & Yamanaka, A. (2020). The mammalian circadian pacemaker regulates wakefulness via CRF neurons in the paraventricular nucleus of the hypothalamus. Science Advances, 6(45), eabd0384. https://doi.org/10.1126/sciadv.abd0384
- Periasamy, S., Hsu, D.-Z., Fu, Y.-H., & Liu, M.-Y. (2015). Sleep deprivation-induced multi-organ injury: Role of oxidative stress and inflammation. EXCLI Journal, 14, 672–683. https://doi.org/10.17179/excli2015-245
- Robinson, M. D., & Oshlack, A. (2010). A scaling normalization method for differential expression analysis of RNA-seq data. Genome Biology, 11(3), R25–9. https://doi.org/10.1186/gb-2010-11-3-r25
- Sakamoto, K., Higo-Yamamoto, S., Egi, Y., Miyazaki, K., & Oishi, K. (2020). Memory dysfunction and anxiety-like behavior in a mouse model of chronic sleep disorders. Biochemical & Biophysical Research Communications, 529(2), 175–179. https://doi.org/10.1016/j.bbrc.2020.05.218
- Salazar, C., Nagadia, R., Pandit, P., Cooper-White, J., Banerjee, N., Dimitrova, N., Coman, W. B., & Punyadeera, C. (2014). A novel saliva-based microRNA biomarker panel to detect head and neck cancers. Cellular Oncology (Dordrecht), 37(5), 331–338. https://doi.org/10.1007/s13402-014-0188-2
- Schmidt, E.-M., Linz, B., Diekelmann, S., Besedovsky, L., Lange, T., & Born, J. (2015). Effects of an interleukin-1 receptor antagonist on human sleep, sleep-associated memory consolidation, and blood monocytes. Brain, Behavior, & Immunity, 47, 178–185. https://doi.org/10.1016/j.bbi.2014.11.012
- Slenter, D. N., Kutmon, M., Hanspers, K., Riutta, A., Windsor, J., Nunes, N., Mélius, J., Cirillo, E., Coort, S. L., Digles, D., Ehrhart, F., Giesbertz, P., Kalafati, M., Martens, M., Miller, R., Nishida, K., Rieswijk, L., Waagmeester, A., Eijssen, L. M. T., & Willighagen, E. L. (2018). WikiPathways: A multifaceted pathway database bridging metabolomics to other omics research. Nucleic Acids Research, 46(D1), D661–D667. https://doi.org/10.1093/nar/gkx1064
- Spiegel, K., Tasali, E., Leproult, R., & Van Cauter, E. (2009). Effects of poor and short sleep on glucose metabolism and obesity risk. Nature Reviews: Endocrinology, 5(5), 253–261. https://doi.org/10.1038/nrendo.2009.23
- Storey, J. D., & Tibshirani, R. (2003). Statistical significance for genomewide studies. Proceedings of the National Academy of Sciences of the United States of America, 100(16), 9440–9445. https://doi.org/10.1073/pnas.1530509100
- Struthers, A. D. (2002). Introducing a new role for BNP: As a general indicator of cardiac structural disease rather than a specific indicator of systolic dysfunction only. Heart, 87(2), 97–98. https://doi.org/10.1136/heart.87.2.97
- Taylor, D. J., Lichstein, K. L., Durrence, H. H., Reidel, B. W., & Bush, A. J. (2005). Epidemiology of insomnia, depression, and anxiety. Sleep, 28(11), 1457–1464. https://doi.org/10.1093/sleep/28.11.1457
- Toth, L. A., & Bhargava, P. (2013). Animal models of sleep disorders. Comparative Medicine, 63(2), 91–104. https://doi.org/10.1007/978-981-10-5981-0_12
- Valadi, H., Ekström, K., Bossios, A., Sjöstrand, M., Lee, J. J., & Lötvall, J. O. (2007). Exosome-mediated transfer of mRNAs and microRNAs is a novel mechanism of genetic exchange between cells. Nature Cell Biology, 9(6), 654–659. https://doi.org/10.1038/ncb1596
- Van Dongen, H. P. A., Maislin, G., Mullington, J. M., & Dinges, D. F. (2003). The cumulative cost of additional wakefulness: Dose–response effects on neurobehavioral functions and sleep physiology from chronic sleep restriction and total sleep deprivation. Sleep, 26(2), 117–126. https://doi.org/10.1093/sleep/26.2.117
- Vgontzas, A. N., Papanicolaou, D. A., Bixler, E. O., Lotsikas, A., Zachman, K., Kales, A., Prolo, P., Wong, M. L., Licinio, J., Gold, P. W., Hermida, R. C., Mastorakos, G., & Chrousos, G. P. (1999). Circadian interleukin-6 secretion and quantity and depth of sleep. The Journal of Clinical Endocrinology & Metabolism, 84(8), 2603–2607. https://doi.org/10.1210/jcem.84.8.5894
- Villafuerte, G., Miguel-Puga, A., Murillo Rodríguez, E., Machado, S., Manjarrez, E., & Arias-Carrión, O. (2015). Sleep deprivation and oxidative stress in animal models: A systematic review. Oxidative Medicine & Cellular Longevity, 2015, 1–15. https://doi.org/10.1155/2015/234952
- Wallace, D. M., Ramos, A. R., & Rundek, T. (2012). Sleep disorders and stroke. International Journal of Stroke, 7(3), 231–242. https://doi.org/10.1111/j.1747-4949.2011.00760.x
- Weigend, S., Holst, S. C., Meier, J., Brock, M., Kohler, M., & Landolt, H.-P. (2019). Prolonged waking and recovery sleep affect the serum microRNA expression profile in humans. Clocks & Sleep, 1(1), 75–86. https://doi.org/10.3390/clockssleep1010008
- Yin, Z., Zhao, Y., He, M., Li, H., Fan, J., Nie, X., Yan, M., Chen, C., & Wang, D. W. (2019). MiR-30c/PGC-1β protects against diabetic cardiomyopathy via PPARα. Cardiovascular Diabetology, 18(1), 1–15. https://doi.org/10.1186/s12933-019-0811-7
- Zhang, R., Lan, C., Pei, H., Duan, G., Huang, L., & Li, L. (2015). Expression of circulating miR-486 and miR-150 in patients with acute myocardial infarction. BMC Cardiovascular Disorder, 15, 1–7. https://doi.org/10.1186/s12872-015-0042-0
- Zhang, X.-Y., Tang, X.-Y., Li, N., Zhao, L.-M., Guo, Y.-L., Li, X.-S., Tian, C.-J., Cheng, D.-J., Chen, Z.-C., & Zhang, L.-X. (2018). GAS5 promotes airway smooth muscle cell proliferation in asthma via controlling miR-10a/BDNF signaling pathway. Life Sciences, 212, 93–101. https://doi.org/10.1016/j.lfs.2018.09.002