
Abstract
Prenatal adversity is associated with behavioral obesogenic features such as preference for palatable foods. Salt appetite may play a role in the development of adiposity and its consequences in individuals exposed to prenatal adversity, and sodium consumption involves individual differences in accumbal µ-opioid receptors function. We investigated the hedonic responses to salt and the levels of µ-opioid receptors and tyrosine hydroxylase in the nucleus accumbens (Nacc) of pups from an animal model of prenatal dietary restriction. In children, we evaluated the interaction between fetal growth and the genetic background associated with the accumbal µ-opioid receptor gene (OPRM1) expression on sodium consumption during a snack test. Sprague-Dawley dams were randomly allocated from pregnancy day 10 to receive an ad libitum (Adlib) or a 50% restricted (FR) diet. The pups’ hedonic responses to a salt solution (NaCl 2%) or water were evaluated on the first day of life. FR and Adlib pups differ in their hedonic responses to salt, and there were decreased levels of accumbal µ-opioid and p-µ-opioid receptors in FR pups. In humans, a test meal and genotyping from buccal epithelial cells were performed in 270 children (38 intrauterine growth restricted—IUGR) at 4 years old from a Canadian prospective cohort (MAVAN). The OPRM1 genetic score predicted the sodium intake in IUGR children, but not in controls. The identification of mechanisms involved in the brain response to prenatal adversity and its consequences in behavioral phenotypes and risk for chronic diseases later in life is important for preventive and therapeutic purposes.
1. Introduction
There is compelling evidence linking disturbances in the fetal environment, leading to intrauterine growth restriction (IUGR), and a subsequent higher risk for cardiovascular diseases, type II diabetes mellitus, and metabolic syndrome (D’Agostin et al., Citation2023; Kramer, Citation2000). Fetal exposure to a paucity of nutritional resources affects the offspring’s food preferences in different ages, and the findings seem to converge to an increased intake of palatable (or high energy-dense) foods in IUGR individuals [reviewed in Dalle Molle et al. (Citation2016)].
An animal model of prenatal adversity based on 50% food restriction initiated on gestational day 10 (Desai et al., Citation2007), which leads to IUGR, was established as a useful approach able to mimic many of the adverse outcomes frequently observed in fetal growth-restricted humans, including decreased plasma leptin levels, obesity, increased percentage of body fat, insulin resistance, and catch-up growth (Cunha et al., Citation2015; Desai et al., Citation2005). More recently, this model has been used to investigate alterations in feeding behavior as one of the features involved in their thrifty phenotype (Alves et al., Citation2015; Citation2019; Dalle Molle et al., Citation2015; Laureano, Dalle Molle, Alves et al., Citation2016; Citation2019). Strikingly, these findings on the relationship between exposure to prenatal adversity and altered food intake and preferences bear an extremely close parallel with well-known effects in humans (Barbieri et al., Citation2009; Bischoff et al., Citation2018; Campbell et al., Citation2016; Crume et al., Citation2014; Doornweerd et al., Citation2017; Eloranta et al., Citation2018; Ester et al., Citation2019; Hvelplund et al., Citation2016; Johnson et al., Citation2016; Kampmann et al., Citation2019; Kaseva et al., Citation2013; Lussana et al., Citation2008; Migraine et al., Citation2013; Perälä et al., Citation2012; Portella et al., Citation2019; Sharafi et al., Citation2016; Silveira et al., Citation2018; Silveira et al., Citation2012).
An altered response to palatable foods in those growth-restricted at birth can be seen as early as the first day of life (Ayres et al., Citation2012; Laureano, Molle, Portella et al., Citation2016), likely as an adaptive behavior to improve survival or growth in these individuals. For instance, hedonic responses to a sweet solution delivered in preterm newborns’ mouths are related to the degree of IUGR (Ayres et al., Citation2012). Interestingly, sweet and salty taste preferences are strongly and positively correlated (Mennella et al., Citation2014), and there is evidence that salty taste acceptance at 2 months and salt liking in preschoolers are inversely related to birth weight (Stein et al., Citation2006). In terms of long-term effects, it is known that sensitivity to basic tastes influences food liking and acceptance in young and older children (Ervina et al., Citation2020; Fry Vennerød et al., Citation2018; Schwartz et al., Citation2009), which may contribute to the establishment of specific and healthy/unhealthy eating patterns. Although there is some discrepancy in the literature regarding the innate component of salt appetite (Liem, Citation2017), we consider sodium (specifically sodium chloride (NaCl)) as part of the spectrum of palatable foods and sought to 1) model the effect of fetal growth restriction on salt taste perception in newborn rodents to explore the potential mechanisms involved, as we have performed with sweet solution (Laureano, Dalle Molle, Alves et al., Citation2016) 2) back-translate these findings to humans to investigate the association with long-term food intake in older IUGR children, who are known to be vulnerable to developing increased adiposity and metabolic syndrome (Lakshmy, Citation2013; Pilgaard et al., Citation2011).
Food consumption is, among other factors, influenced by brain systems related to pleasure and incentive salience (Berridge, Citation2009b). The dopaminergic mesocorticolimbic pathway and the accumbal opioid system are two neurobiological substrates associated with hedonic eating (Berridge, Citation2009a). Furthermore, the midbrain opioidergic system regulates salt appetite (Lucas et al., Citation2007; Na et al., Citation2012), as well as the development of dopaminergic pathways that are involved in the incentive salience for palatable foods later in life (Gugusheff et al., Citation2015; Laureano, Dalle Molle, Alves et al., Citation2016). Opioid receptors (µ and κ) mRNA is detected in the mesostriatal and mesolimbic systems during prenatal development in rodents (Georges et al., Citation1998), suggesting an early expression of these receptors on dopaminergic terminal fibers and their role in the ontogeny of feeding pathways. We hypothesized that IUGR would lead to an altered hedonic response to NaCl, and that this behavioral feature would be linked to differences in accumbal µ-opioid receptor levels in newborn rat pups, potentially interfering with the dopaminergic response to the palatable solution. Therefore, we measured both µ-opioid receptor (total and phosphorylated) and tyrosine hydroxylase (total and phosphorylated) in accumbal samples of newborn rats from an animal model of prenatal dietary restriction, which induces IUGR. Additionally, we evaluated the interaction between fetal growth and the genetic background associated with µ-opioid receptor gene (OPRM1) expression in the nucleus accumbens (Nacc) on sodium consumption in a sample of children.
2. Materials and methods
2.1. Experimental data
2.1.1. Rats
Eighteen 75 days old primiparous Sprague Dawley females and ten 75 days old males (CEMIB Laboratory Animal Reference Center, Campinas, SP, Brazil) were randomly selected for time-mating at our animal facility by vaginal smear visualization. They were single-housed in Plexiglas home cages (49 × 34 × 16 cm) during pregnancy and maintained in a controlled environment: altered dark/light cycle (lights on between 9AM and 7PM), temperature of 22 ± 2 °C cage, cleaning once a week, food and water provided ad libitum. The animal model employed is a well-established model of prenatal adversity, based on food restriction of 50% which starts at day 10 of gestation to mimic human fetal growth restriction and its consequences, without effects on oocyte implementation, organogenesis or survival (Desai, Gayle, Babu et al., Citation2005; Citation2007; Desai, Gayle, Han et al., Citation2007; Jelks et al., Citation2009; Khorram et al., Citation2015, Citation2007; Yee et al., Citation2011). At 10 days of gestation, dams were randomly allocated to two groups: control receiving an ad libitum diet (Adlib) of standard laboratory chow (Nuvilab®) and 50% food restricted (FR) receiving 50% of the ad libitum-fed dam’s intake (determined by quantification of normal intake in a cohort of pregnant Sprague Dawley rats). The standard laboratory chow contained at least 2700 mg/kg of sodium. The food restriction occurred from day 10 of pregnancy until birth. Within 24 hours after birth, rat pups were weighed and limited to 8 per litter (4 males and 4 females), cross-fostered to control dams and used for other experimental projects. The excess pups [n total = 48; Adlib-Water: n = 13 (6 males and 7 females, derived from 4 litters); Adlib-Salt: n = 13 (7 males and 6 females, derived from 4 litters); FR-Water: n = 12 (6 males and 6 females, derived from 7 litters); FR-Salt: n = 10 (4 males and 6 females, derived from 7 litters)] performed the taste reactivity test within 24 hours after birth, ranging from 6-24h of life, with lights on (between 2PM–6PM) and were immediately euthanized thereafter for brain collection. No more than 2 pups from the same sex per litter were used in the experiments.
All animal procedures were approved by the Research Ethics Committee of Hospital de Clínicas de Porto Alegre (GPPG/HCPA, projects numbers 14-0111 and 13-0544).
2.1.2. Taste reactivity test
Rat pups at 1 day of life were randomly divided and tested for hedonic responses by receiving either a droplet (10 µL) of distilled water or salt solution (NaCl 2%) (Lucas et al., Citation2007). This concentration is specifically linked to the rat brain endogenous µ-opioid receptor signaling (Dadam et al., Citation2018). The pups were gently held to receive the droplet, but they were able to move their head and paws while testing the solution. After dripping the droplet on pup’s mouth, using a 100 µL micropipette, facial responses were filmed for 90 seconds. Films were watched frame-by-frame (30 frames/second) using the KMPlayer® software and scored by an observer blinded to the group allocation. The frequency of tongue protrusions (licking) and rhythmic mouth movements - considered as positive facial responses (hedonic responses) - were analyzed during the first 60 seconds according to the protocol proposed by Berridge (Berridge, Citation2000). The frequency of gapes were registered as aversive reactions (Berridge, Citation2000). After being filmed for 90 seconds, rat pups were immediately decapitated.
Affective taste reactivity response patterns were scored using time bin scoring procedures developed to assess hedonic versus aversive taste valuations. This is an objective evaluation done by counting the number of frames in which affective taste reactions are exhibited by the animal after stimulus. A time bin scoring procedure was used to ensure that taste reactivity components of different relative frequencies were balanced in their contribution to the final affective totals. This evaluation was based on the classical and well-established method of microstructural analysis of ingestive behavior, extensively described by Berridge and collaborators in their reviews and original studies (Berridge, Citation2000, Citation2009a, Citation2009; Wyvell and Berridge, Citation2000). The microstructural analysis of taste reactivity is a very detailed inspection of the behavioral responsivity done by watching the videos frame by frame and scoring the films in 2-seconds time bins, which allows to deepen the understanding of the behavioral output. Every 2 seconds the frames containing affective responses were counted. Individual totals were calculated for each rat by summing all frames contained in affective responses exhibited during the first 60 seconds and every 2 seconds as described in the method by Berridge (Citation2000). Hedonic responses included rhythmic midline tongue protrusions and lateral tongue protrusions, and aversive response included gapes (Berridge, Citation2000). The analysis performed in the current study followed the same rationale previously applied in our lab (Laureano, Dalle Molle, Alves et al., Citation2016).
2.1.3. Neurochemical analysis
The rat pups had their brains quickly removed after decapitation. The region of interest (Nacc) was identified and carefully isolated, and tissue was collected from 1-mm-diameter punches, and frozen at −80 °C until being processed for Western blot analysis as described below. Tissue samples were homogenized in RIPA buffer (Sigma-Aldrich R0278) supplemented with protease (Complete, Roche) and phosphatase inhibitors (Phostop, Roche) and centrifuged at 13000 rpm for 10 minutes at 4 °C. Total protein was quantified using a BCA kit with bovine serum albumin as a standard (Thermo Scientific). Samples containing 35 µg of total protein were subjected to electrophoresis on a 4 to 12% polyacrylamide gradient gel (Invitrogen) before being transferred to a nitrocellulose membrane (GE Healthcare). A gradient containing standard molecular weight markers (Magic Marker, Invitrogen) was run in parallel for molecular weight estimation. Blots were blocked in Tris buffer saline containing 5% nonfat milk concentrate and 1% Tween-20. The membranes were incubated overnight at 4 °C with Anti-Phospho-µ Opioid Receptor (Ser375) Polyclonal antibody (1:1000) (Assay Biotech, cat: A0022), Rabbit Anti-µ Opioid receptor Polyclonal antibody (1:1000) (Bioss antibodies, cat: bs-3623R), TH 1:5000 (anti-tyrosine hydroxylase, Sigma-Aldrich, T2928) or pTH 1:1000 (anti-phospho tyrosine hydroxylase (Ser40), Invitrogen, 368600), followed by incubation with anti-rabbit antibody (1:2500) (Anti-Rabbit IgG, Cell signaling, cat: 7074s) or anti-mouse (1:2500) (Cell Signaling, 7076s) at room temperature for 45 minutes.
All the membranes were exposed to ECL (ECL western blotting analysis system, GE healthcare, RNP 2106) and the image was captured using the ImageQuant TL Software (GE Healthcare Life Sciences). The intensity of Western blot bands was quantified by densitometry analysis using ImageJ software (National Institute of Health, USA). Results were calculated as a ratio between the intensity of the protein of interest and the intensity of the Monoclonal Anti-α-Tubulin 1:2000 (Sigma-Aldrich, T 6074) in the same membrane. The results were expressed as percentage of controls.
2.2. Clinical data
2.2.1. Sample
Data from children participating in an established prospective birth cohort (Maternal Adversity, Vulnerability and Neurodevelopment - MAVAN) were analyzed (O’Donnell et al., Citation2014). This cohort included children from Montreal (Quebec) and Hamilton (Ontario), Canada, and recruited mothers with ≥18 years old with singleton pregnancies and fluency in French or English. Mothers were excluded from the study if they had severe chronic illness, placenta previa, a history of incompetent cervix, impending delivery, or had a fetus/infant born at gestational age <37 weeks or born with a major anomaly. Mother and child dyads were evaluated longitudinally at home or in the laboratory during child development. Approval for the MAVAN project was obtained from obstetricians performing deliveries at the study hospitals and by the institutional review boards at hospitals and university affiliates: McGill University, l’Université de Montréal, the Royal Victoria Hospital, Jewish General Hospital, Center Hospitalier de l’Université de Montréal, Hôpital Maisonneuve-Rosemont, St Joseph’s Hospital, and McMaster University, Hamilton, Ontario, Canada. Informed consent was obtained from the parents/guardians of the participants.
Children were assessed at 4 years of age for several food-related measures and anthropometric measures: standing height without shoes measured to the nearest 0.1 cm with the use of a stadiometer (Perspective Enterprises, PE-AIM-101, Portage, Michigan) and body weight in light clothing measured to the nearest 0.1 kg with the use of a digital scale (TANITA BF625, Arlington Heights, Illinois). Body mass index (BMI) was calculated as weight in kilograms divided by height in meters squared (kg/m2), and BMI-for-age z-scores according to WHO (de Onis, Citation2006) were calculated.
2.2.1.1. Fetal growth restriction definition
The definition of IUGR was based on the birth weight ratio (BWR): ratio between the infant birth weight and the sex-specific mean birth weight for each gestational age for the Canadian population (Kramer et al., Citation2001). Children with BWR of <0.85 was classified as IUGR (Kramer et al., Citation1999).
2.2.2. Snack test
The snack test lasted 30 minutes and was performed approximately at 10:30 a.m. for children and mothers in a laboratory room of 30 m2. There was a table with two sets of plates in the center of the room. Mother and child were seated facing one another and a cushion was placed on the child’s chair to facilitate accessibility to the foods presented. Mothers were instructed to not share plates or verbally influence the children’s choices and the test was videotaped to assure compliance. The visit was scheduled on the birthday month to ensure that children were within a few weeks of being 4 years old at the time of the test.
The plates available on the table included pre-weighed portions of different types of food (Frosted Flakes, sliced apple, muffin with chocolate drops, 3.25% milk, maple sirup flavored baked beans, croissant, cooked egg, cheddar cheese, All Bran, white bread, orange juice) (Silveira et al., Citation2014; Levitan et al., Citation2015) with similar colors to avoid foods with vivid colors that could be especially attractive to the children. The foods chosen to be part of the snack test were carefully selected based on a dietitian recommendation, who knew the eating habits of the study population. The parents were instructed to offer a light breakfast to the children at home prior to the test. By the end of the session, the remaining foods were weighed to measure intake. The amount of energy, fat, carbohydrates, protein and sodium consumed was calculated according to the nutritional contents of each food (USDA—National Nutrient Database for Standard Reference Release 26) and the amount eaten.
2.2.3. Genotyping and genetic score
Buccal epithelial cells were collected by gently brushing over the inside of the child’s cheeks (Catch-All Swabs, Epicenter, USA) and the DNA was isolated using the high salt method. As described elsewhere (Silveira et al., Citation2017) autosomal SNPs were genotyped from 200 ng of genomic DNA, using genome-wide platforms (the Infinium PsychArray-24 v1.1/v1.2 or the PsychChip v1 (15048346 A manifest), Illumina, Inc.). Participant samples with a low call rate (< 90%) were removed, as well as SNPs with a low call rate (< 95%), a minor allele frequency less than 5% or a Hardy–Weinberg equilibrium test p < 1 × 10 − 30, resulting in 358 participants and 229,456 autosomal SNPs. We used PLINK 1.9 (Chang et al. Citation2015) for quality control procedures. The remaining SNPs were submitted for imputation to the Sanger Imputation Service using the Haplotype Reference Consortium (HRC) as the reference panel (release 1.1) (McCarthy et al., Citation2016). Following post-imputation quality control 16,249,769 autosomal SNPs with imputation accuracy greater than 0.80 were retained. We recoded imputed dosage genotypes to hard-called genotypes using posterior genotype probability greater than 0.90. Genetic scores were calculated based on hard-called genotypes.
We examined population structure using principal component analysis (Patterson et al., Citation2006; Price et al., Citation2006). Genotyped SNPs with high linkage disequilibrium (r2 >0.20) were pruned with a sliding window of 50 SNPs in increments of 5 SNPs using PLINK 1.9. We performed principal component analysis using SMARTPCA (Patterson et al., Citation2006) on this pruned data set and generated a scree plot. Based on the inspection of the scree plot, the first 3 principal components were the most informative of population structure and were included in all analyses as covariates.
We then created a genetic score reflecting the genotype-related gene expression of the opioid receptor gene, which has nearly 5000 SNPs. To gather all the existing SNPs from OPRM1 gene we utilized biomaRt package (Durinck et al. (Citation2009), GRCh37.p13). We selected only those SNPs that were present in the MAVAN genotyping data, merged this list with SNPs that were available on GTEx (Nucleus accumbens gene expression data), and retained the resulting list of SNPs after linkage disequilibrium clumping (r2 > 0.20, a moving window of 500 kb). The final list included 24 SNPs (see Supplementary Table 1). Based on the children’s genotype data, alleles at a given cis-SNP were weighed by the estimated effect of the genotype on gene expression (GTEx Nucleus accumbens, in which the effect allele is the alternative allele). The final genetic score was obtained by summation over all SNPs. Hence, for the genetic score calculation, we 1) identify all the SNPs that exist on the OPRM1 gene; 2) identify which of these SNPs exist on our cohort MAVAN; 3) identify which of these SNPs exist in GTEx Nucleus accumbens; 4) the common list of SNPs between 1), 2) and 3) was put together (total 534 SNPs, and then clumped to eliminate SNPs in linkage disequilibrium, resulting in a final list of 24 SNPs) (Barth et al., Citation2020; Silveira et al., Citation2017). Enrichment analysis of the SNPs included in the score was done using MetaCore® (Clarivate Analytics; https://portal.genego.com/), in which the list of SNPs included in the score was uploaded and the command Workflow and Reports/Analyze Single Experiment were used. This command uses the information from the list of 24 SNPs included in the genetic score as identifiers for the enrichment analysis.
2.3. Statistical analysis
Data were analyzed using the Statistical Package for the Social Sciences (SPSS), version 27.0 (SPSS Inc., Chicago, IL, USA) and R Studio (R Core Team, Citation2015). Continuous variables were described using mean and standard error of the mean (SEM) and categorical variables as percentage (number of subjects). Generalized Estimation Equations (GEE) method was used to analyze the pups’ birth weight, using the litter as a cluster and adjusting the analysis by litter size and sex. The area under the curve (AUC) for frequency of hedonic reactions and the AUC for the number of frames contained in hedonic responses were calculated. Although the plots were depicted separately by solution to facilitate visualization (see ), all the rats were analyzed together considering their neonatal group (Adlib or FR) and solution received (Water or Salt). Our previous studies did not identify sex differences or interaction between neonatal group and sex in the taste reactivity analysis, and therefore the rats were analyzed altogether, and the analysis was adjusted by sex. The associations between 4 groups (Adlib-Water, Adlib-Salt, FR-Water, FR-Salt) and the AUC for frequency of hedonic reactions and the AUC for the number of frames were analyzed using GEE, taking into consideration the relatedness between the pups and birthweight. In addition, GEE adjusted for sex and birthweight was applied to evaluate if there were differences over time in the number of frames in which hedonic responses were exhibited within groups, applying LSD correction for multiple comparisons. Western blot results were expressed as percentages of the control group (Adlib). In other words, the mean value for the Adlib group in each membrane was set as 100%, and each FR rat had their measure calculated as a % relative to this mean. Therefore, the mean value for the control group was 100, but there was variability at the individual level as seen in the plots. Student’s t-tests were used to compare the levels of TH, pTH, µ-opioid and p µ-opioid receptors between the groups (Adlib and FR).
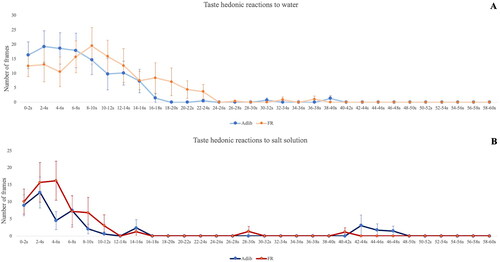
Figure 1. Taste reactivity test. The X axis depicts the 2s time bins, and the Y axis demonstrates the number of frames in which positive hedonic reactions are elicited (30 frames/second). A) responses to distilled water, and B) responses to salt solution (NaCl 2%). Visual inspection of the plots clearly shows that most behavioral activity after the ingestion of the solutions happened in the first 20 seconds, and even more evidently during the first 10 seconds. GEE analysis of these first 10 seconds revealed a significant effect of time only in the groups that received salt solution (Adlib-salt Wald= 23.169; df= 3; p < 0.001; FR-salt Wald= 45.288; df= 3; p < 0.001). Adlib-salt pups decreased their hedonic responses over time, while FR-salt pups kept exhibiting hedonic responses on a crescendo up until 6 seconds.
For the gene-environment interaction analysis, linear regression analysis was applied to examine the effects of interaction between the OPRM1 genetic score and IUGR on food intake measures, adjusted by population stratification, BMI z-score, and sex. For the analyses with a significant interaction term, simple slope analysis was conducted to describe the effect of OPRM1 genetic score on food intake measures for each group. Significance level for all measures was set at α < 0.05. A post hoc power analysis was conducted. Given the sample size of 270, the clinical data were able to detect a small effect size association (f2=0.02) in interaction models with a power of 64% and a medium effect size association (f2=0.15) with a power of 99%.
3. Results
3.1. Experimental data
3.1.1. Taste reactivity test
Analysis of the rat pups’ birth weight (Adlib, n = 26; FR, n = 22) confirmed that the 50% food restriction model, well established in our laboratory (Alves et al., Citation2019; Dalle Molle et al., Citation2015; Laureano, Dalle Molle, Alves et al., Citation2016), induced IUGR [Estimated means ± SEM for Adlib group 7.40 ± 0.11 g, and FR group 6.89 ± 0.20 g, Wald = 5.345; df = 1; p = 0.021).
The descriptive data of the frequency and duration of positive and aversive reactions at each 2-seconds time bin is shown in Supplementary Table 2. Aversive reactions were barely seen (only 3 rats and very infrequently), therefore the deeper analysis focused on positive hedonic reactions only.
The AUC of the frequency of hedonic responses exhibited during the first 60 seconds after receiving the solution (water or salt) or the AUC of the number of frames in which hedonic responses were exhibited were different between the groups (Adlib-Water, Adlib-Salt, FR-Water, FR-Salt). More precisely, the GEE analysis with litter as a cluster variable and adjusted by sex and birthweight showed a significant group effect on the AUCs (frequency of hedonic responses: Wald Chi-square = 12.946, df= 3, p = 0.005; number of frames: Wald Chi-square = 9.370, df= 3, p = 0.025). AUC of the frequency of hedonic responses were lower in the Adlib-Salt group (6.45 ± 1.49) when compared to FR-Salt (13.89 ± 2.36), Adlib-Water (17.73 ± 5.30) and FR-Water (19.83 ± 4.71) groups (LSD post hoc test, p < 0.05). Similar results were found when comparing the AUC of the number of frames between groups (Adlib-Salt = 85.70 ± 20.90; FR-Salt = 181.43 ± 35;65; Adlib-Water = 227.88 ± 71.40; FR-Water = 232.97 ± 48.00).
Visual inspection of the plots () clearly shows that most behavioral activity after the ingestion of the solutions happened in the first 20 seconds, and even more evidently during the first 10 seconds. The GEE analysis, with litter as a cluster variable and adjusted by sex and birthweight, of the AUCs focused on the first 20 and 10 seconds also showed a significant group effect (Adlib-Water, Adlib-Salt, FR-Water, FR-Salt) on the frequency of hedonic responses (20 sec: Wald Chi-square= 15.943, df= 3, p = 0.001; 10 sec: Wald Chi-square= 8.802, df= 3, p = 0.032) and on the number of frames eliciting tongue protrusions (20 sec: Wald Chi-square = 13.445, df= 3, p = 0.004; 10 sec: Wald Chi-square= 8.119, df= 3, p = 0.044). In the first 20 seconds, the AUC of the frequency of hedonic responses and the AUC of the number of frames were lower in the Adlib-Salt compared to the other groups, as observed in the first 60 seconds. In the first 10 seconds, differences were observed only between Adlib-Salt and Adlib-Water, in which Adlib-Salt group showed less hedonic responses (Supplementary Table 3).
To characterize the microstructural behavioral differences (Berridge, Citation2000), we analyzed the duration of the hedonic responses in number of frames throughout the first 10 seconds withing groups using GEE with litter as a cluster variable and adjusted for sex and birthweight. There was a significant effect of time on the number of frames in which hedonic responses were exhibited only in the groups that received salt solution (Adlib-Salt Wald= 23.169; df= 4; p < 0.001; FR-Salt Wald= 45.288; df= 4; p < 0.001). Adlib-Salt pups decreased their hedonic responses over time (duration of the hedonic expressions were longer at 4 seconds compared to 6 and 10 seconds, LSD post hoc test, 4 vs. 6: p = 0.012, 4 vs. 10: p = 0.023). FR-Salt pups kept exhibiting hedonic responses on a crescendo up until 6 seconds (duration of the hedonic expressions was longer at 4 seconds compared to 2 seconds, and longer at 6 seconds compared to 8 and 10 seconds, LSD corrected, 4 vs. 2: p = 0.016, 6 vs. 8: p = 0.033, 6 vs. 10: p = 0.043) ().
3.1.2. Neurochemical analysis
3.1.2.1. µ Opioid receptor in the Nacc
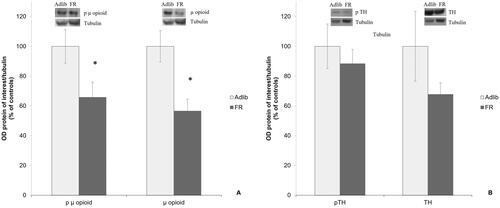
shows the results of the µ opioid and phosphorylated (p) µ-opioid receptors’ levels in the Nacc in Adlib and FR rats. µ-opioid and p µ-opioid receptors’ levels in the Nacc were lower in the FR group when compared to the control group (Student’s t-test; µ opioid: t = 3.278, df= 22, p = 0.003; p µ opioid: t = 2.258, df = 22, p = 0.034, n = 12/group). The ratio p µ-opioid/µ-opioid was not different between the groups (Adlib 1.11 ± 0.13, FR 1.32 ± 0.26, Student’s t-test t = 0.72, df = 22, p = 0.479).
Figure 2. A) µ-opioid receptor and its phosphorylated form in the Nacc of Adlib and FR rats. * µ-opioid and p µ-opioid receptors levels in the Nacc were lower in the FR group when compared to the control group (student’s t-test; µ opioid: t = 3.278, df = 22, p = 0.003; p µ opioid: t = 2.258, df = 22, p = 0.034). n = 12/group. B) Tyrosine hydroxylase (TH) and its phosphorylated form in the Nacc of Adlib and FR rats. No statistically significant differences were seen between the groups. n = 12/group.
3.1.2.2. Tyrosine hydroxylase in the Nacc
The levels of TH and pTH in the Nacc were not different between groups (Student’s t-test; TH: t = 1.309, df= 22, p = 0.204; pTH: t = 0.656, df= 22, p = 0.518, n = 12/group) (). The ratio pTH/TH was also similar between the groups (Adlib 1.50 ± 0.27, FR 1.49 ± 0.20, Student’s t-test t = 0.008, df= 22, p = 0.994).
3.2. Clinical data
There were 270 children (38 IUGR) with both phenotyping and genotyping data available, and no significant differences were found in main confounders between those born with IUGR or not (), except for birth weight as expected. describes the consumption of macronutrients in the snack test, as well as the total caloric and sodium intake according to birth weight. There were no significant differences in these outcomes between the groups, neither when adjusting the nutrients consumption by the total calories’ intake (data not shown).
Table 1. Participants’ characteristics in MAVAN.
Table 2. Macronutrients, energy and sodium consumption in the snack test.
However, a linear regression model demonstrates a statistically significant interaction effect between the OPRM1 genetic score and the quality of the fetal environment on the consumption of sodium during the snack test (, estimated beta= − 0.16, p = 0.04), while adjusting for genetic principal components, BMI z-score at the time of the test and sex. Simples slope analysis shows that in IUGR children, there is an increase in sodium intake as the OPRM1 genetic score decreases (, estimated beta= − 0.14, p = 0.05), while there is no effect of OPRM1 genetic score in those born with normal birth weight (estimated beta= 0.018, p = 0.59). The region of significance is located to the left of the red line on the plot (). To obtain a distribution and 95% confidence interval (95% CI) for the interaction effect we applied nonparametric bootstrap based on 1000 replicates. The estimated interaction effect is −0.163 with SE 0.064 (95% CI: −0.2843, −0.0302). No other significant interaction effects or main effects on nutrients’ consumption were observed ().
Figure 3. Interaction between µ opioid receptor (OPRM1) genetic score and fetal growth on the consumption of sodium during the snack test. Intrauterine growth restricted (IUGR) children consume more sodium as the OPRM1 genetic score decreases. The OPRM1 genetic score had no effect on children with normal birth weight (BW). The difference between IUGR and normal BW is statistically significant to the left of the red line.
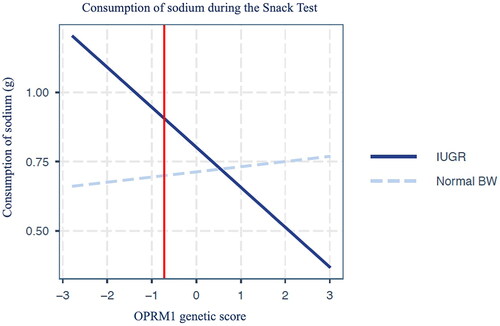
Table 3. Interaction effect between OPRM1 genetic score and quality of fetal environment, as well as main effects of quality of fetal environment and OPRM1 genetic score on nutrients consumption during the snack test.
We calculated the OPRM1 genetic score in other brain regions for which the expression of OPRM1 was available in GTEx (prefrontal cortex, hypothalamus, cingulate cortex, cerebellum and cerebellar hemisphere). There was no interaction effect between IUGR and these other genetic scores on sodium consumption during the snack test (See Supplementary Table 4), reinforcing the finding that the OPRM1 genetic score in the Nacc is a specific marker for salt appetite especially in IUGR children.
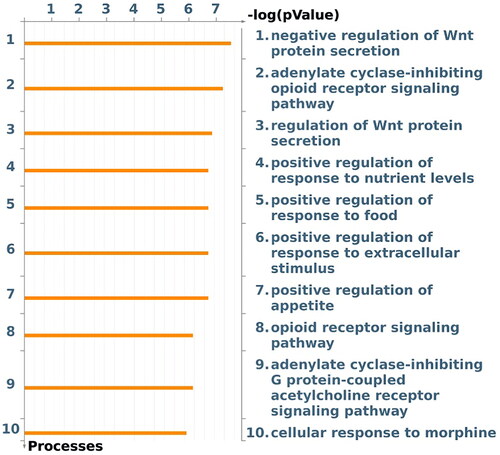
Enrichment analysis of the SNPs that comprise the Nacc OPRM1 genetic score in MetaCore® demonstrates that they are significantly enriched for gene ontology processes related to the opioid receptor signaling as expected, but also regulation of Wnt protein secretion, response to nutrient levels, regulation of appetite and regulation of the response to food ().
Figure 4. Enrichment analysis of the SNPs that comprise the µ opioid receptor (OPRM1) genetic score using MetaCore®.
4. Discussion
In our experiment, we found that prenatal dietary restriction, which induces IUGR, modifies the hedonic component of salt-elicited taste reactivity in newborn rat pups. FR rat pups exhibited a different pattern of hedonic responses compared to control rat pups in the first day of life, with increased responses to the salt solution on the first six seconds of the experiment. These findings are similar to those of previous experimental and clinical studies, in which IUGR was related to an altered response to a sweet solution (Ayres et al., Citation2012; Laureano, Dalle Molle, Alves et al., Citation2016; Rubio-Navarro et al., Citation2014). In animal models, IUGR increased hedonic responses to a sweet solution at postnatal day 1 (Laureano, Dalle Molle, Alves et al., 2016) and postnatal day 3 (Rubio-Navarro et al., Citation2014), whereas in humans, the more intense the IUGR, the lower the frequency of hedonic responses on the first day of life (Ayres et al., Citation2012). However, the human assessment was performed in extremely premature newborns in the neonatal intensive care unit. Even though the directionality of the results in the different species is not the same, it is interesting to observe that fetal growth is linked to taste reactivity in newborns in both species.
We also confirmed our hypothesis that the altered behavior would be linked to differences in the opioidergic system, which together with the dopaminergic signaling is involved in two important processes for palatable food consumption: ‘‘wanting” and ‘‘liking.” “Wanting” is dependent on mesolimbic dopamine circuits and related to the motivation to acquire the reward, whereas ‘‘liking” is related to the elicited pleasure per se and has the opioid system as the main circuit involved (Berridge, Citation2009a). In the present study, we observed that the altered “liking” behavior of FR rat pups for a salt solution was related to lower levels of µ-opioid and p µ-opioid receptors in the Nacc. The neurobehavioral differences observed between FR and control rat pups in response to a salt solution in the first day of life strengthen the hypothesis that the response to salt flavor is prenatally programmed in IUGR individuals, as previously observed with sucrose (Ayres et al., Citation2012; Laureano, Dalle Molle, Alves et al., Citation2016). Interestingly, a study that investigated an opposite scenario, exposure to a high-fat diet during gestation and lactation, observed higher levels of angiotensin II receptor type 1 (AT1) in the circumvallate papilla at weaning and a higher preference for salty taste in the offspring exposed to a high-fat diet during fetal life and throughout development (Serirukchutarungsee et al., Citation2023). Their results reinforce the idea that the response to salt flavor can be programmed early in life. The programming of such behavior when fetal growth is impaired might be adaptive to guarantee an effective and rapid growth early in life, since studies show that NaCl plays a role in postnatal growth (Haycock, Citation1993) especially in preterm neonates [for a review, see Bischoff et al. (Citation2016)], which was also demonstrated in experimental studies (Wassner, Citation1989; Citation1991). Although newborn infants commonly reject salt solution compared to water (Beauchamp et al., Citation1994) and salt taste and hunger evolve throughout development (Formaker and Hill, Citation1990; Leshem, Citation1999), it seems that an innate response to salt flavor exists, probably because of its importance in maintaining the balance of this mineral in the body (Krause and Sakai, Citation2007).
Studies suggest that sodium depletion modulates dopamine responses by changing the activity of the dopaminergic system (Fortin and Roitman, Citation2018) and other brain systems, e.g. opioidergic system (Krause and Sakai, Citation2007). The administration of furosemide to induce salt intake increases mRNA expression of enkephalin, an endogenous opioid, in the Nacc shell (Lucas et al., Citation2003). Lucas et al. (Lucas et al., Citation2007) also demonstrated that the manipulation of the delta-opioid receptors by agonist and antagonist injections in the ventral tegmental area changes salt intake. Furthermore, systemically administered naltrexone (opioid antagonist) reduced positive hedonic responses and enhanced negative affective responses in sodium-depleted rats (Na et al., Citation2012), suggesting that the opioidergic system mediates salt palatability and intake. However, the mechanism by which sodium imbalance produces changes in opioid activity and whether such changes affect dopamine transmission needs to be elucidated (Levitan et al., Citation2015). Tandon et al. (Tandon et al., Citation2012) observed that a subset of the neuronal population in the lateral hypothalamus, central amygdala, and Nacc codes for the increased motivational and/or hedonic value of a salt solution in salt-deprived state rats. More specifically, findings in the Nacc shell and core point toward potential common neural substrates for salt appetite and drug-seeking behavior. Fortin and Roitman (Fortin and Roitman, Citation2018) identified hindbrain sodium deprivation-responsive neurons that project directly to the ventral tegmental area, where dopamine neuron cell bodies reside and dynamically track body fluid homeostasis and respond to water and salt stimuli in a state- and taste-dependent manner. Our study found decreased levels of µ-opioid and p µ-opioid receptors in the Nacc of rat pups exposed to intrauterine growth restriction mapping onto increased salt taste-elicited hedonic responses. It is worth noting that the animal model of 50% food restriction employed in our study did not impose an important depletion of sodium to the pregnant rats, whose sodium intake was higher than the suggested daily requirement of 0.05% of dietary intake (Baker et al., Citation2013). Our results suggest that IUGR impact the opioidergic system and as a consequence the pleasure elicited by a salt solution, which throughout development might have a role in the modulation of the dopaminergic response to salt stimuli and consequently in salt appetite. Interestingly, we observed an interaction effect between IUGR and accumbal OPRM1 genetic score on sodium intake in a spontaneous snack test at 4 years old, in which the lower the OPRM1 genetic score, the higher the sodium intake but only for those children who were growth restricted at birth. Results from a previous study indicate that β-endorphin, an agonist for mu opioid receptors, is implicated in NaCl consumption. β-endorphin knockout mice and heterozygous mutant mice consume approximately 50% less 2% NaCl solution than wild-type mice after sodium depletion (Franchini et al., Citation2003). Although our study did not establish a causal relationship between OPRM1, IUGR and salt intake, this and other evidence reviewed here strongly suggest that alterations in the function of OPRM1 induced by FR are involved in the behavioral differences in salt taste reactivity. Though we cannot exclude that other genes may play a role too, the expression of the OPRM1 gene is critical for salt palatability/intake phenotype. Future studies modifying the expression of this gene in the context of fetal growth restriction should explore the associations described here.
An interesting point to discuss is about the regular responsivity to water and salt solutions observed in our data. The differences in hedonic responses between water and NaCl are subtle, and more evident in the Adlib (control) animals. This may be due to the fact that most research investigating taste reactivity to NaCl has measured this behavior in response to salt depletion or deficiency, which makes the responses more exuberant (Grill and Bernstein, Citation1988; Sorge et al., Citation2002). In our study, we accessed the behavior of newborn pups at baseline (no depletion), with a NaCl concentration that was reportedly related to brain activation of pathways involved in pleasure in the brain (Dadam et al., Citation2018). The practical absence of aversive reactions in our data confirms that the protocol was successful. Therefore, it was expected that this concentration, age and set up of the behavioral assessment would elicit very subtle differences in behavior between the groups as seen in our findings.
It is well established that sodium intake is a risk factor for hypertension and cardiovascular disease, and there is emerging evidence suggesting that high salt intake is associated with metabolic syndrome. Interestingly, both excessive and deficient sodium intake will result in long-term morbidity [reviewed by Wu et al. (Citation2023)]. Early in life excessive sodium intake predisposes to higher blood pressure in childhood and adult hypertension (Brion et al., Citation2008; Emmerik et al., Citation2020), whereas inadequate intake leads to programming of higher sodium consumption later in life (Shirazki et al., Citation2007). It is important to note that IUGR individuals are known to be at an increased risk to develop chronic diseases over the life course (D’Agostin et al., Citation2023), for which their increased salt appetite reported here might be playing a role. Furthermore, one study described that a higher preference for salty taste correlated positively with percentage of body fat in 5 to 10 years old children (Mennella et al., Citation2014). As we have demonstrated that impulsivity seems to be an important behavioral feature associated with palatable food intake in IUGR children and adolescents (Reis et al., Citation2016; Silveira et al., Citation2012), and considering that pharmacological manipulation of either dopamine D2/D3 receptors or μ-opioid receptors alters reward impulsivity in humans (Weber et al., Citation2016), the results from our experimental study may be suggestive on the putative pathways involved in the behavioral findings in children.
The prenatal environment sets the foundation for a healthy development and has long-term effects on an individual’s health trajectory over the life course. A recent series of articles published in one of the most prestigious medical journals highlighted the fact that one in four newborns experienced significant adversities during the intrauterine period with an impact on their growth and development (Ashorn et al., Citation2023; Lawn et al., Citation2023). Worldwide, the causes of being born small are multiple and varied (e.g., genetic diseases, congenital malformations, infections, maternal diabetes, hypertension, drug use or malnutrition); however, the high prevalence is consistently found independently of the country’s economic status. Overall, pregnancies affected by placental insufficiency will invariably lead to a fetus that does not reach its full growth capacity (Ashorn et al., Citation2023; Lawn et al., Citation2023), with short- and long-term consequences for their health. Animal models exploring the causes and consequences of this condition are therefore extremely important. They allow the exploration of mechanistic processes and observation of life-time effects but are limited in the extend to which neurobiological findings can be extrapolated to humans. Clinical studies, on the other hand, elicit interesting associations but can rarely be informative in terms of mechanisms. The use of advanced genomics tools informed by neurobiological findings, as we have done here, has enormous potential in the translation of the extensive knowledge derived from animal models to practical applications (e.g., identification of biomarkers) in human populations (Silveira and Meaney, Citation2023).
Prenatal programming of salt appetite, as demonstrated in this study, is an adjuvant to previous evidence that early dietary sodium intake correlates with its ingestion later in life (Curtis et al., Citation2004). That is, IUGR is associated with an innate preference for salt, especially depending on the OPRM1 genetic score. These results contribute to the idea that identifying behavioral phenotypes associated with vulnerability to chronic diseases is relevant for clinical practice, especially early in life.
Supplemental Material
Download MS Word (55.4 KB)Acknowledgements
The authors acknowledge Zihan Wang and Sachin Patel for performing the genetic scores calculation.
Disclosure statement
No potential conflict of interest was reported by the author(s).
Additional information
Funding
Notes on contributors
Adrianne Rahde Bischoff
Adrianne Rahde Bischoff, MD, received her medical degree in Medicine from the Federal University of Rio Grande do Sul, Brazil. She completed a Neonatal Perinatal Medicine Fellowship at University of Toronto / Hospital for Sick Children, and a Neonatal Hemodynamics Fellowship at University of Iowa. Currently she is a Clinical Assistant Professor of Pediatrics-Neonatology at the University of Iowa, US.
Roberta Dalle Molle
Roberta Dalle Molle, PhD, received her Bachelor’s in Nutrition, and her MSc and PhD in Medicine (focus on Child and Adolescent Health) from the Federal University of Rio Grande do Sul, Brazil. This was followed by a postdoctoral fellowship at the McGill University. Currently she is a Research Associate at the Douglas Mental Health University Institute, Montreal, Canada.
Amanda Brondani Mucellini
Amanda Brondani Mucellini, PhD, received her Bachelor’s in Biology from the Federal University of Santa Maria, Brazil, and her MSc in Physiology and PhD in Psychiatry from the Federal University of Rio Grande do Sul, Brazil.
Irina Pokhvisneva
Irina Pokhvisneva, MSc, is a biostatistician at the Douglas Mental Health University Institute based in Montreal, Canada with expertise in data management, processing, and statistical analysis of longitudinal and cross-sectional studies. Her academic background lies in the fields of biostatistics and applied mathematics.
Robert D. Levitan
Robert D. Levitan, MD PhD, is a Full Professor in the Department of Psychiatry with a cross-appointment in the Department of Physiology, University of Toronto. Dr. Levitan holds the Cameron Parker Holcombe Wilson Chair in Depression studies at University of Toronto and CAMH. He is a full member of the Institute of Medical Sciences at University of Toronto.
Michael J. Meaney
Michael J. Meaney, PhD, is a James McGill Professor in the departments of Psychiatry and Neurology, and Neurosurgery at McGill University. He is also the Programme Director for the Translational Neuroscience domain at the Singapore Institute for Clinical Sciences, Agency for Science, Technology and Research (A*STAR).
Patrícia P. Silveira
Patrícia P. Silveira, MD PhD, is an Associate Professor at the Department of Psychiatry at McGill University, Canada, with unique training that involves Neuroscience (PhD), Developmental Biology (postdoctoral training), Pediatrics and Neonatal Follow-up. She is also the Scientific Director of the Genomic & Epigenetics Pillar at the Ludmer Centre for Neuroinformatics and Mental Health.
References
- Alves, M. B., Laureano, D. P., Dalle Molle, R., Machado, T. D., Salvador, A. P. D A., Miguel, P. M., Lupinsky, D., Dalmaz, C., & Silveira, P. P. (2019). Intrauterine growth restriction increases impulsive behavior and is associated with altered dopamine transmission in both medial prefrontal and orbitofrontal cortex in female rats. Physiology & Behavior, 204, 1–13. https://doi.org/10.1016/j.physbeh.2019.03.010
- Alves, M., Dalle Molle, R., Desai, M., Ross, M., & Silveira, P. (2015). Increased palatable food intake and response to food cues in intrauterine growth-restricted rats are related to tyrosine hydroxylase content in the orbitofrontal cortex and nucleus accumbens. Behavioural Brain Research, 287, 73–81. https://doi.org/10.1016/j.bbr.2015.03.019
- Ashorn, P., Ashorn, U., Muthiani, Y., Aboubaker, S., Askari, S., Bahl, R., Black, R. E., Dalmiya, N., Duggan, C. P., Hofmeyr, G. J., Kennedy, S. H., Klein, N., Lawn, J. E., Shiffman, J., Simon, J., & Temmerman, M, UNICEF–WHO Low Birthweight Estimates Group. (2023). Small vulnerable newborns-big potential for impact. Lancet (London, England), 401(10389), 1692–1706. https://doi.org/10.1016/S0140-6736(23)00354-9
- Ayres, C., Agranonik, M., Portella, A. K., Filion, F., Johnston, C. C., & Silveira, P. P. (2012). Intrauterine growth restriction and the fetal programming of the hedonic response to sweet taste in newborn infants. International Journal of Pediatrics, 2012, 657379. https://doi.org/10.1155/2012/657379
- Baker, H. J., Lindsey, J. R., & Wesibroth, S. H. (2013). The Laboratory Rat: Biology and Disease (Vol. 1). Academic Press.
- Barbieri, M. A., Portella, A. K., Silveira, P. P., Bettiol, H., Agranonik, M., Silva, A. A., & Goldani, M. Z. (2009). Severe intrauterine growth restriction is associated with higher spontaneous carbohydrate intake in young women. Pediatric Research, 65(2), 215–220. https://doi.org/10.1203/PDR.0b013e31818d6850
- Barth, B., Bizarro, L., Miguel, P. M., Dubé, L., Levitan, R., O’Donnell, K., Meaney, M. J., & Silveira, P. P. (2020). Genetically predicted gene expression of prefrontal DRD4 gene and the differential susceptibility to childhood emotional eating in response to positive environment. Appetite, 148, 104594. https://doi.org/10.1016/j.appet.2020.104594
- Beauchamp, G. K., Cowart, B. J., Mennella, J. A., & Marsh, R. R. (1994). Infant salt taste: developmental, methodological, and contextual factors. Developmental Psychobiology, 27(6), 353–365. https://doi.org/10.1002/dev.420270604
- Berridge, K. C. (2000). Measuring hedonic impact in animals and infants: microstructure of affective taste reactivity patterns. Neuroscience and Biobehavioral Reviews, 24(2), 173–198. https://doi.org/10.1016/s0149-7634(99)00072-x
- Berridge, K. C. (2009a). “Liking” and “wanting” food rewards: brain substrates and roles in eating disorders. Physiology & Behavior, 97(5), 537–550. https://doi.org/10.1016/j.physbeh.2009.02.044
- Berridge, K. C. (2009b). Wanting and liking: Observations from the neuroscience and psychology laboratory. Inquiry (Oslo, Norway), 52(4), 378–398. https://doi.org/10.1080/00201740903087359
- Bischoff, A. R., Portella, A. K., Paquet, C., Dalle Molle, R., Faber, A., Arora, N., Levitan, R. D., Silveira, P. P., & Dube, L. (2018). Low birth weight is associated with increased fat intake in school-aged boys. The British Journal of Nutrition, 119(11), 1295–1302. Jun https://doi.org/10.1017/S0007114518000892
- Bischoff, A. R., Tomlinson, C., & Belik, J. (2016). Sodium Intake Requirements for Preterm Neonates: Review and Recommendations. Journal of Pediatric Gastroenterology and Nutrition, 63(6), e123–e129. Dec https://doi.org/10.1097/MPG.0000000000001294
- Brion, M.-J., Ness, A. R., Davey Smith, G., Emmett, P., Rogers, I., Whincup, P., & Lawlor, D. A. (2008). Sodium intake in infancy and blood pressure at 7 years: Findings from the Avon Longitudinal Study of Parents and Children. European Journal of Clinical Nutrition, 62(10), 1162–1169. https://doi.org/10.1038/sj.ejcn.1602837
- Campbell, C. P., Raubenheimer, D., Badaloo, A. V., Gluckman, P. D., Martinez, C., Gosby, A., Simpson, S. J., Osmond, C., Boyne, M. S., & Forrester, T. E. (2016). Developmental contributions to macronutrient selection: a randomized controlled trial in adult survivors of malnutrition. Evolution, Medicine, and Public Health, 2016(1), 158–169. https://doi.org/10.1093/emph/eov030
- Chang, C. C., Chow, C. C., Tellier, L. C., Vattikuti, S., Purcell, S. M., & Lee, J. J. (2015). Second-generation PLINK: rising to the challenge of larger and richer datasets. GigaScience, 4(1), 7. https://doi.org/10.1186/s13742-015-0047-8
- Crume, T. L., Scherzinger, A., Stamm, E., McDuffie, R., Bischoff, K. J., Hamman, R. F., & Dabelea, D. (2014). The long-term impact of intrauterine growth restriction in a diverse U.S. cohort of children: the EPOCH study. Obesity (Silver Spring, Md.), 22(2), 608–615. https://doi.org/10.1002/oby.20565
- Cunha, F. D S., Dalle Molle, R., Portella, A. K., Benetti, C. D S., Noschang, C., Goldani, M. Z., & Silveira, P. P. (2015). Both food restriction and high-fat diet during gestation induce low birth weight and altered physical activity in adult rat offspring: The “Similarities in the Inequalities” model. PloS One, 10(3), e0118586. https://doi.org/10.1371/journal.pone.0118586
- Curtis, K. S., Krause, E. G., Wong, D. L., & Contreras, R. J. (2004). Gestational and early postnatal dietary NaCl levels affect NaCl intake, but not stimulated water intake, by adult rats. American Journal of Physiology. Regulatory, Integrative and Comparative Physiology, 286(6), R1043–50. Jun https://doi.org/10.1152/ajpregu.00582.2003
- Dadam, F., Zádor, F., Caeiro, X., Szűcs, E., Erdei, A. I., & Samavati, R. (2018). The effect of increased NaCl intake on rat brain endogenous μ-opioid receptor signalling. Journal of Neuroendocrinology. 30(4), e12585. https://doi.org/10.1111/jne.12585
- D’Agostin, M., Di Sipio Morgia, C., Vento, G., & Nobile, S. (2023). Long-term implications of fetal growth restriction. World Journal of Clinical Cases, 11(13), 2855–2863. https://doi.org/10.12998/wjcc.v11.i13.2855
- Dalle Molle, R., Bischoff, A. R., Portella, A. K., & Silveira, P. P. (2016). The fetal programming of food preferences: Current clinical and experimental evidence. Journal of Developmental Origins of Health and Disease, 7(3), 222–230. https://doi.org/10.1017/S2040174415007187
- Dalle Molle, R., Laureano, D. P., Alves, M. B., Reis, T. M., Desai, M., Ross, M. G., & Silveira, P. P. (2015). Intrauterine growth restriction increases the preference for palatable foods and affects sensitivity to food rewards in male and female adult rats. Brain Research, 1618, 41–49. https://doi.org/10.1016/j.brainres.2015.05.019
- de Onis, M., WHO Team. (2006). WHO child growth standards: length/height-for-age, weight-for-age, weight-for-length, weight-for-height and body mass index-for-age: methods and development (pp. 0–312). WHO Press.
- Desai, M., Gayle, D., Babu, J., & Ross, M. G. (2005). Programmed obesity in intrauterine growth-restricted newborns: Modulation by. American Journal of Physiology. Regulatory, Integrative and Comparative Physiology, 288(1), R91–6. https://doi.org/10.1152/ajpregu.00340.2004
- Desai, M., Gayle, D., Babu, J., & Ross, M. G. (2007). The timing of nutrient restriction during rat pregnancy/lactation alters metabolic syndrome phenotype. American Journal of Obstetrics and Gynecology, 196(6), 555.e1-7. https://doi.org/10.1016/j.ajog.2006.11.036
- Desai, M., Gayle, D., Han, G., & Ross, M. G. (2007). Programmed hyperphagia due to reduced anorexigenic mechanisms in intrauterine growth-restricted offspring. Reproductive Sciences (Thousand Oaks, Calif.), 14(4), 329–337. https://doi.org/10.1177/1933719107303983
- Doornweerd, S., IJzerman, R. G., Weijs, P. J. M., Diamant, M., de Geus, E. J., & Boomsma, D. I. (2017). Lower birth weight is associated with alterations in dietary intake in adolescents independent of genetic factors: A twin study. Clinical Nutrition (Edinburgh, Scotland), 36(1), 179–185. https://doi.org/10.1016/j.clnu.2015.10.012
- Durinck, S., Spellman, P. T., Birney, E., & Huber, W. (2009). Mapping identifiers for the integration of genomic datasets with the R/Bioconductor package biomaRt. Nature Protocols, 4(8), 1184–1191. https://doi.org/10.1038/nprot.2009.97
- Eloranta, A.-M., Jääskeläinen, J., Venäläinen, T., Jalkanen, H., Kiiskinen, S., Mäntyselkä, A., Schwab, U., Lindi, V., & Lakka, T. A. (2018). Birth weight is associated with dietary factors at the age of 6-8 years: the Physical Activity and Nutrition in Children (PANIC) study. Public Health Nutrition, 21(7), 1278–1285. https://doi.org/10.1017/S1368980017004013
- Emmerik, N. E., de Jong, F., & van Elburg, R. M. (2020). Dietary Intake of Sodium during Infancy and the Cardiovascular Consequences Later in Life: A Scoping Review. Annals of Nutrition & Metabolism, 76(2), 114–121. https://doi.org/10.1159/000507354
- Ervina, E., Berget, I., & Almli, V. L. (2020). Investigating the relationships between basic tastes sensitivities, fattiness sensitivity, and food liking in 11-year-old children. Foods (Basel, Switzerland), 9(9), 1315. https://doi.org/10.3390/foods9091315
- Ester, W. A., Jansen, P. W., Hoek, H. W., Verhulst, F. C., Jaddoe, V. W., Marques, A. H., Tiemeier, H., Susser, E. S., & Roza, S. J. (2019). Fetal size and eating behaviour in childhood: a prospective cohort study. International Journal of Epidemiology, 48(1), 124–133. https://doi.org/10.1093/ije/dyy256
- Formaker, B. K., & Hill, D. L. (1990). Alterations of salt taste perception in the developing rat. Behavioral Neuroscience, 104(2), 356–364. https://doi.org/10.1037//0735-7044.104.2.356
- Fortin, S. M., & Roitman, M. F. (2018). Challenges to body fluid homeostasis differentially recruit phasic dopamine signaling in a taste-selective manner. The Journal of Neuroscience: The Official Journal of the Society for Neuroscience, 38(31), 6841–6853. https://doi.org/10.1523/JNEUROSCI.0399-18.2018
- Franchini, L. F., Rubinstein, M., & Vivas, L. (2003). Reduced sodium appetite and increased oxytocin gene expression in mutant mice lacking β-endorphin. Neuroscience, 121(4), 875–881. https://doi.org/10.1016/s0306-4522(03)00485-8
- Fry Vennerød, F. F., Nicklaus, S., Lien, N., & Almli, V. L. (2018). The development of basic taste sensitivity and preferences in children. Appetite, 127, 130–137. https://doi.org/10.1016/j.appet.2018.04.027
- Georges, F., Normand, E., Bloch, B., & Le Moine, C. (1998). Opioid receptor gene expression in the rat brain during ontogeny, with special reference to the mesostriatal system: an in situ hybridization study. Developmental Brain Research, 109(2), 187–199. https://doi.org/10.1016/s0165-3806(98)00082-0
- Grill, H. J., & Bernstein, I. L. (1988). Strain differences in taste reactivity to NaCl. The American Journal of Physiology, 255(3 Pt 2), R424–R430.
- Gugusheff, J. R., Ong, Z. Y., & Muhlhausler, B. S. (2015). The early origins of food preferences: targeting the critical windows of development. FASEB Journal: official Publication of the Federation of American Societies for Experimental Biology, 29(2), 365–373. https://doi.org/10.1096/fj.14-255976
- Haycock, G. B. (1993). The influence of sodium on growth in infancy. Pediatric Nephrology (Berlin, Germany), 7(6), 871–875. https://doi.org/10.1007/BF01213376
- Hvelplund, C., Hansen, B. M., Koch, S. V., Andersson, M., & Skovgaard, A. M. (2016). Perinatal Risk Factors for Feeding and Eating Disorders in Children Aged 0 to 3 Years. Pediatrics, 137(2), e20152575. https://doi.org/10.1542/peds.2015-2575
- Jelks, A., Belkacemi, L., Han, G., Chong, W. L., Ross, M. G., & Desai, M. (2009). Paradoxical increase in maternal plasma leptin levels in food-restricted gestation: contribution by placental and adipose tissue. Reproductive Sciences (Thousand Oaks, Calif.), 16(7), 665–675. https://doi.org/10.1177/1933719109334257
- Johnson, S., Matthews, R., Draper, E. S., Field, D. J., Manktelow, B. N., Marlow, N., Smith, L. K., & Boyle, E. M. (2016). Eating difficulties in children born late and moderately preterm at 2 y of age: a prospective population-based cohort study. The American Journal of Clinical Nutrition, 103(2), 406–414. https://doi.org/10.3945/ajcn.115.121061
- Kampmann, F. B., Grunnet, L. G., Halldorsson, T. I., Bjerregaard, A. A., Granstrøm, C., Pires, S. M., Strøm, M., Vaag, A. A., Tetens, I., & Olsen, S. F. (2019). Being born small-for-gestational-age is associated with an unfavourable dietary intake in Danish adolescent girls: findings from the Danish National Birth Cohort. Journal of Developmental Origins of Health and Disease, 10(4), 488–496. https://doi.org/10.1017/S2040174418000910
- Kaseva, N., Wehkalampi, K., Hemiö, K., Hovi, P., Järvenpää, A.-L., Andersson, S., Eriksson, J. G., Lindström, J., & Kajantie, E. (2013). Diet and nutrient intake in young adults born preterm at very low birth weight. The Journal of Pediatrics, 163(1), 43–48. https://doi.org/10.1016/j.jpeds.2012.12.076
- Khorram, O., Keen-Rinehart, E., Chuang, T., Der, Ross, M. G., & Desai, M. (2015). Maternal undernutrition induces premature reproductive senescence in adult female rat offspring. Fertility and Sterility, 103(1), 291–298.e2. https://doi.org/10.1016/j.fertnstert.2014.09.026
- Khorram, O., Khorram, N., Momeni, M., Han, G., Halem, J., Desai, M., & Ross, M. G. (2007). Maternal undernutrition inhibits angiogenesis in the offspring: a potential mechanism of programmed hypertension. American Journal of Physiology. Regulatory, Integrative and Comparative Physiology, 293(2), R745–R753. https://doi.org/10.1152/ajpregu.00131.2007
- Kramer, M. S. (2000). Invited commentary: association between restricted fetal growth and adult chronic disease: is it causal? is it important? American Journal of Epidemiology, 152(7), 605–608. https://doi.org/10.1093/aje/152.7.605
- Kramer, M. S., Platt, R. W., Wen, S. W., Joseph, K. S., Allen, A., Abrahamowicz, M., Blondel, B., & Bréart, G, Fetal/Infant Health Study Group of the Canadian Perinatal Surveillance System. (2001). A new and improved population-based Canadian reference for birth weight for gestational age. Pediatrics, 108(2), E35. https://doi.org/10.1542/peds.108.2.e35
- Kramer, M. S., Platt, R., Yang, H., McNamara, H., & Usher, R. H. (1999). Are all growth-restricted newborns created equal(ly)? Pediatrics, 103(3), 599–602. https://doi.org/10.1542/peds.103.3.599
- Krause, E. G., & Sakai, R. R. (2007). Richter and sodium appetite: from adrenalectomy to molecular biology. Appetite, 49(2), 353–367. https://doi.org/10.1016/j.appet.2007.01.015
- Lakshmy, R. (2013). Metabolic syndrome: role of maternal undernutrition and fetal programming. Reviews in Endocrine & Metabolic Disorders, 14(3), 229–240. https://doi.org/10.1007/s11154-013-9266-4
- Laureano, D. P., Alves, M. B., Miguel, P. M., Machado, T. D., Reis, A. R., Mucellini, A. B., Cunha, F. S., Lampert, C., Salvador, A. P. A., Dalle Molle, R., Mosca, P. R., Pokhvisneva, I., Desai, M., Ross, M. G., & Silveira, P. P. (2019). Intrauterine growth restriction modifies the accumbal dopaminergic response to palatable food intake. Neuroscience, 400, 184–195. https://doi.org/10.1016/j.neuroscience.2018.12.036
- Laureano, D. P., Dalle Molle, R., Alves, M. B., Luft, C., Desai, M., Ross, M. G., & Silveira, P. P. (2016). Intrauterine growth restriction modifies the hedonic response to sweet taste in newborn pups - Role of the accumbal mu-opioid receptors. Neuroscience, 322, 500–508. https://doi.org/10.1016/j.neuroscience.2016.02.033
- Laureano, D. P., Dalle Molle, R., Portella, A. K., & Silveira, P. P. (2016). Facial expressions in small for gestational age newborns. Journal of Child Neurology, 31(3), 398–399. https://doi.org/10.1177/0883073815592225
- Lawn, J. E., Ohuma, E. O., Bradley, E., Idueta, L. S., Hazel, E., Okwaraji, Y. B., Erchick, D. J., Yargawa, J., Katz, J., Lee, A. C. C., Diaz, M., Salasibew, M., Requejo, J., Hayashi, C., Moller, A.-B., Borghi, E., Black, R. E., & Blencowe, H, Subnational Vulnerable Newborn Measurement Group. (2023). Small babies, big risks: global estimates of prevalence and mortality for vulnerable newborns to accelerate change and improve counting. Lancet (London, England), 401(10389), 1707–1719. https://doi.org/10.1016/S0140-6736(23)00522-6
- Leshem, M. (1999). The ontogeny of salt hunger in the rat. Neuroscience and Biobehavioral Reviews, 23(5), 649–659. https://doi.org/10.1016/s0149-7634(98)00059-1
- Levitan, R. D., Rivera, J., Silveira, P. P., Steiner, M., Gaudreau, H., Hamilton, J., Kennedy, J. L., Davis, C., Dube, L., Fellows, L., Wazana, A., Matthews, S., & Meaney, M. J, MAVAN Study Team. (2015). Gender differences in the association between stop-signal reaction times, body mass indices and/or spontaneous food intake in pre-school children: an early model of compromised inhibitory control and obesity. International Journal of Obesity (2005), 39(4), 614–619. https://doi.org/10.1038/ijo.2014.207
- Liem, D. (2017). Infants’ and Children’s Salt Taste Perception and Liking: A Review. Nutrients, 9(9), 1011. https://doi.org/10.3390/nu9091011
- Lucas, L. R., Grillo, C. A., & McEwen, B. S. (2003). Involvement of mesolimbic structures in short-term sodium depletion: in situ hybridization and ligand-binding analyses. Neuroendocrinology, 77(6), 406–415. https://doi.org/10.1159/000071312
- Lucas, L. R., Grillo, C. A., & McEwen, B. S. (2007). Salt appetite in sodium-depleted or sodium-replete conditions: possible role of opioid receptors. Neuroendocrinology, 85(3), 139–147. https://doi.org/10.1159/000102536
- Lussana, F., Painter, R. C., Ocke, M. C., Buller, H. R., Bossuyt, P. M., & Roseboom, T. J. (2008). Prenatal exposure to the Dutch famine is associated with a preference for fatty foods and a more atherogenic lipid profile. The American Journal of Clinical Nutrition, 88(6), 1648–1652. https://doi.org/10.3945/ajcn.2008.26140
- McCarthy, S., Das, S., Kretzschmar, W., Delaneau, O., Wood, A. R., Teumer, A., Kang, H. M., Fuchsberger, C., Danecek, P., Sharp, K., Luo, Y., Sidore, C., Kwong, A., Timpson, N., Koskinen, S., Vrieze, S., Scott, L. J., Zhang, H., Mahajan, A., … Durbin, R, Haplotype Reference Consortium. (2016). A reference panel of 64,976 haplotypes for genotype imputation. Nature Genetics, 48(10), 1279–1283.
- Mennella, J. A., Finkbeiner, S., Lipchock, S. V., Hwang, L.-D., & Reed, D. R. (2014). Preferences for salty and sweet tastes are elevated and related to each other during childhood. PloS One, 9(3), e92201. https://doi.org/10.1371/journal.pone.0092201
- Migraine, A., Nicklaus, S., Parnet, P., Lange, C., Monnery-Patris, S., Des Robert, C., Darmaun, D., Flamant, C., Amarger, V., & Rozé, J.-C. (2013). Effect of preterm birth and birth weight on eating behavior at 2 y of age. The American Journal of Clinical Nutrition, 97(6), 1270–1277. https://doi.org/10.3945/ajcn.112.051151
- Na, E. S., Morris, M. J., & Johnson, A. K. (2012). Opioid mechanisms that mediate the palatability of and appetite for salt in sodium replete and deficient states. Physiology & Behavior, 106(2), 164–170. May https://doi.org/10.1016/j.physbeh.2012.01.019
- O’Donnell, K. A., Gaudreau, H., Colalillo, S., Steiner, M., Atkinson, L., Moss, E., Goldberg, S., Karama, S., Matthews, S. G., Lydon, J. E., Silveira, P. P., Wazana, A. D., Levitan, R. D., Sokolowski, M. B., Kennedy, J. L., Fleming, A., & Meaney, M. J, MAVAN Research Team. (2014). The maternal adversity, vulnerability and neurodevelopment project: theory and methodology. Canadian Journal of Psychiatry. Revue Canadienne de Psychiatrie, 59(9), 497–508. https://doi.org/10.1177/070674371405900906
- Patterson, N., Price, A. L., & Reich, D. (2006). Population Structure and Eigenanalysis. PLoS Genetics, 2(12), e190. https://doi.org/10.1371/journal.pgen.0020190
- Perälä, M.-M., Männistö, S., Kaartinen, N. E., Kajantie, E., Osmond, C., Barker, D. J. P., Valsta, L. M., & Eriksson, J. G. (2012). Body size at birth is associated with food and nutrient intake in adulthood. PloS One, 7(9), e46139. https://doi.org/10.1371/journal.pone.0046139
- Pilgaard, K., Hammershaimb Mosbech, T., Grunnet, L., Eiberg, H., Van Hall, G., Fallentin, E., Larsen, T., Larsen, R., Poulsen, P., & Vaag, A. (2011). Differential nongenetic impact of birth weight versus third-trimester growth velocity on glucose metabolism and magnetic resonance imaging abdominal obesity in young healthy twins. The Journal of Clinical Endocrinology and Metabolism, 96(9), 2835–2843. https://doi.org/10.1210/jc.2011-0577
- Portella, A. K., Paquet, C., Bischoff, A. R., Molle, R. D., Faber, A., Moore, S., Arora, N., Levitan, R., Silveira, P. P., & Dube, L. (2019). Multi-behavioral obesogenic phenotypes among school-aged boys and girls along the birth weight continuum. PloS One, 14(2), e0212290. https://doi.org/10.1371/journal.pone.0212290
- Price, A. L., Patterson, N. J., Plenge, R. M., Weinblatt, M. E., Shadick, N. A., & Reich, D. (2006). Principal components analysis corrects for stratification in genome-wide association studies. Nature Genetics, 38(8), 904–909. https://doi.org/10.1038/ng1847
- R Core Team. (2015). R: A Language and Environment for Statistical Computing. R Foundation for Statistical Computing. https://www.r-project.org/
- Reis, R. S., Dalle Molle, R., Machado, T. D., Mucellini, A. B., Rodrigues, D. M., Bortoluzzi, A., Bigonha, S. M., Toazza, R., Salum, G. A., Minuzzi, L., Buchweitz, A., Franco, A. R., Pelúzio, M. C. G., Manfro, G. G., & Silveira, P. P. (2016). Impulsivity-based thrifty eating phenotype and the protective role of n-3 PUFAs intake in adolescents. Translational Psychiatry, 6(3), e755. https://doi.org/10.1038/tp.2016.16
- Rubio-Navarro, L., Torrero, C., Regalado, M., & Salas, M. (2014). Analysis of the Sensory and Hedonic Impacts of Sweet and Bitter Tastes in Perinatally Underfed Rats. Journal of Behavioral and Brain Science, 04(09), 423–431. https://doi.org/10.4236/jbbs.2014.49041
- Schwartz, C., Issanchou, S., & Nicklaus, S. (2009). Developmental changes in the acceptance of the five basic tastes in the first year of life. The British Journal of Nutrition, 102(9), 1375–1385. https://doi.org/10.1017/S0007114509990286
- Serirukchutarungsee, S., Watari, I., Narukawa, M., Podyma-Inoue, K. A., Sangsuriyothai, P., & Ono, T. (2023). Two-generation exposure to a high-fat diet induces the change of salty taste preference in rats. Scientific Reports, 13(1), 5742. https://doi.org/10.1038/s41598-023-31662-0
- Sharafi, M., Duffy, V. B., Miller, R. J., Winchester, S. B., Huedo-Medina, T. B., & Sullivan, M. C. (2016). Dietary behaviors of adults born prematurely may explain future risk for cardiovascular disease. Appetite, 99, 157–167. https://doi.org/10.1016/j.appet.2016.01.007
- Shirazki, A., Weintraub, Z., Reich, D., Gershon, E., & Leshem, M. (2007). Lowest neonatal serum sodium predicts sodium intake in low birth weight children. American Journal of Physiology. Regulatory, Integrative and Comparative Physiology, 292(4), R1683–9. https://doi.org/10.1152/ajpregu.00453.2006
- Silveira, P. P., & Meaney, M. J. (2023). Examining the biological mechanisms of human mental disorders resulting from gene-environment interdependence using novel functional genomic approaches. Neurobiology of Disease, 178, 106008. https://doi.org/10.1016/j.nbd.2023.106008
- Silveira, P. P., Agranonik, M., Faras, H., Portella, A. K., Meaney, M. J., & Levitan, R. D, Maternal Adversity, Vulnerability and Neurodevelopment Study Team. (2012). Preliminary evidence for an impulsivity-based thrifty eating phenotype. Pediatric Research, 71(3), 293–298. https://doi.org/10.1038/pr.2011.39
- Silveira, P. P., Pokhvisneva, I., Gaudreau, H., Atkinson, L., Fleming, A. S., Sokolowski, M. B., Steiner, M., Kennedy, J. L., Dubé, L., Levitan, R. D., & Meaney, M. J, MAVAN research team. (2018). Fetal growth interacts with multilocus genetic score reflecting dopamine signaling capacity to predict spontaneous sugar intake in children. Appetite, 120, 596–601. https://doi.org/10.1016/j.appet.2017.10.021
- Silveira, P. P., Pokhvisneva, I., Parent, C., Cai, S., Rema, A. S. S., Broekman, B. F. P., Rifkin-Graboi, A., Pluess, M., O’Donnell, K. J., & Meaney, M. J. (2017). Cumulative prenatal exposure to adversity reveals associations with a broad range of neurodevelopmental outcomes that are moderated by a novel, biologically informed polygenetic score based on the serotonin transporter solute carrier family C6, member 4. Development and Psychopathology, 29(5), 1601–1617. https://doi.org/10.1017/S0954579417001262
- Silveira, P. P., Portella, A. K., Kennedy, J. L., Gaudreau, H., Davis, C., Steiner, M., Soares, C. N., Matthews, S. G., Sokolowski, M. B., Dubé, L., Loucks, E. B., Hamilton, J., Meaney, M. J., & Levitan, R. D, MAVAN Study Team. (2014). Association between the seven-repeat allele of the dopamine-4 receptor gene (DRD4) and spontaneous food intake in pre-school children. Appetite, 73, 15–22. https://doi.org/10.1016/j.appet.2013.10.004
- Sorge, R. E., Fudge, M. A., & Parker, L. A. (2002). Effect of sodium deprivation on morphine-and lithium-induced conditioned salt avoidance and taste reactivity. Psychopharmacology, 160(1), 84–91. https://doi.org/10.1007/s00213-001-0956-3
- Stein, L. J., Cowart, B. J., & Beauchamp, G. K. (2006). Salty taste acceptance by infants and young children is related to birth weight: longitudinal analysis of infants within the normal birth weight range. European Journal of Clinical Nutrition, 60(2), 272–279. https://doi.org/10.1038/sj.ejcn.1602312
- Tandon, S., Simon, S. A., & Nicolelis, M. A. (2012). Appetitive changes during salt deprivation are paralleled by widespread neuronal adaptations in nucleus accumbens, lateral hypothalamus, and central amygdala. Journal of Neurophysiology, 108(4), 1089–1105. https://doi.org/10.1152/jn.00236.2012
- Wassner, S. J. (1989). Altered Growth and Protein Turnover in Rats Fed Sodium-Deficient Diets. Pediatric Research, 26(6), 608–613. Dec https://doi.org/10.1203/00006450-198912000-00019
- Wassner, S. J. (1991). The effect of sodium repletion on growth and protein turnover in sodium-depleted rats. Pediatric Nephrology (Berlin, Germany), 5(4), 501–504. Jul https://doi.org/10.1007/BF01453690
- Weber, S. C., Beck-Schimmer, B., Kajdi, M.-E., Müller, D., Tobler, P. N., & Quednow, B. B. (2016). Dopamine D2/3- and μ-opioid receptor antagonists reduce cue-induced responding and reward impulsivity in humans. Translational Psychiatry, 6(7), e850. https://doi.org/10.1038/tp.2016.113
- Wu, Q., Burley, G., Li, L., Lin, S., & Shi, Y. (2023). The role of dietary salt in metabolism and energy balance: Insights beyond cardiovascular disease. Diabetes, Obesity & Metabolism, 25(5), 1147–1161. https://doi.org/10.1111/dom.14980
- Wyvell, C. L., & Berridge, K. C. (2000). Intra-Accumbens Amphetamine Increases the Conditioned Incentive Salience of Sucrose Reward: Enhancement of Reward “Wanting” without Enhanced “Liking” or Response Reinforcement. The Journal of Neuroscience: The Official Journal of the Society for Neuroscience, 20(21), 8122–8130. https://doi.org/10.1523/JNEUROSCI.20-21-08122.2000
- Yee, J. K., Lee, W. N. P., Han, G., Ross, M. G., & Desai, M. (2011). Organ-specific alterations in fatty acid de novo synthesis and desaturation in a rat model of programmed obesity. Lipids in Health and Disease, 10, 72. https://doi.org/10.1186/1476-511X-10-72