
Abstract
Acute stress has been demonstrated to affect a diverse array of attentional processes, one of which is selective attention. Selective attention refers to the cognitive process of deliberately allocating attentional resources to a specific stimulus, while ignoring other, distracting stimuli. While catecholamines have been shown to narrow attention, investigations on the influence of the stress hormone cortisol have yielded ambiguous results. We conducted two separate studies utilizing different laboratory stress induction paradigms to examine if cortisol influences the ability to selectively attend to local or global elements of a visual stimulus. In Study 1, 72 healthy young men took part either in the stressful Socially Evaluated Cold Pressor Test (SECPT) or a non-stressful (warm water) control, before being exposed to a composite letter task (CLT). Study 2 comprised a sample of 72 healthy young men and women and made use of a modified version of the Trier Social Stress Test (TSST) as well as a non-stressful control version, the friendly-TSST (f-TSST). Via endocrine, physiological, and subjective markers, we confirmed a successful stress induction. As verified with Bayesian statistics, stress did not affect selective attention in neither of the two studies. Furthermore, we were able to replicate the previously demonstrated absence of global precedence for composite figures composed of letters. Our results offer novel insights into the temporal dynamics of the effects of acute stress on attentional processes. Future studies should manipulate the timing of stress induction and investigate the effects of stress on letter vs. non-letter composite figures to shed further light on the underlying mechanisms.
Introduction
In our everyday lives, we are constantly exposed to vast amounts of visual stimuli. Due to limited cognitive resources, our brains are not able to process all aspects of the environment, necessitating the selective filtering and organization of visual input. One way in which the brain organizes visual input is global-local perception, or the tendency to preferentially process either local or global aspects of a visual stimulus (Rezvani et al., Citation2020). While deliberately attending to local or global elements of visual input is relevant for various everyday tasks, like reading or driving a car, impairments in this central cognitive skill are observed in certain clinical subgroups, for instance people suffering from cortical degenerative disorders (Pelak, Citation2009) or autism (Baisa et al., Citation2019). It is therefore relevant to investigate the cognitive processes involved in global-local perception. One underlying process is supposed to be selective attention, the ability to voluntarily attend to a predetermined stimulus or task, while keeping interference from unrelated and distracting stimuli at minimum (Driver, Citation2001). Selective attention is influenced by various factors, one of which is an acute stress response (Shields et al., Citation2016).
Following exposure to a stressor the sympathetic-adrenal-medullary (SAM) axis becomes active, triggering the release of dopamine (DA) and noradrenaline (NA) in various regions of the brain, including hippocampus, amygdala, and prefrontal cortex (PFC; de Quervain et al., Citation2007). Activation of the SAM axis results in heightened vigilance and attention narrowing (Allen et al., Citation2014; Arnsten, Citation2009). Approximately 15-30 minutes after stress onset, the glucocorticoid cortisol is released into the bloodstream via the hypothalamic-pituitary-adrenal (HPA) axis (Allen et al., Citation2014). By crossing the blood–brain barrier and binding to receptors located in the aforementioned brain areas, cortisol modulates neural activation. Both rapid non-genomic and slow genomic cortisol effects occur, thereby either facilitating (Roozendaal et al., Citation2006) or downregulating (de Kloet et al., Citation2005) the effects of catecholamines like DA and NA. How cortisol modulates attentional processes, including selective attention, thus depends on the timing of acute stress induction. One commonly utilized task to investigate selective attention, specifically global-local perception, is the composite letter task (CLT), also known as Navon hierarchical figures task.
In the CLT, participants are exposed to a large single letter composed of multiple smaller letters (Navon, Citation1977). The large letter represents the holistic (global) visual level, while the small letter embodies a narrow (local) perceptual focus. By having participants focus either on the small or large letter, the process of selective attention can be investigated. The tendency to pay attention toward the local or global level of a stimulus depends on a multitude of factors, including size and number of elements (Primativo & Arduino, Citation2023), exposure time (Blanca et al., Citation1994) as well as mood (Gasper & Clore, Citation2002). The influence of acute stress, i.e., stress experienced in response to an immediate physiological or psychological challenge, on executive functions, including selective attention, has been investigated in previous studies (for a review: Shields et al., Citation2016). The role of cortisol, specifically its non-genomic effects on global-local perception is, however, in need of further investigation.
In this study, we investigated how selective processing of global and local elements of a visual stimulus is affected by acute stress, specifically increased levels of the stress hormone cortisol. Data have been collected in two separate experiments. The first experiment made use of a primarily physiological laboratory stressor, the Socially Evaluated Cold Pressor Test (SECPT; Schwabe et al., Citation2008), while the second utilized a psychosocial stressor, a modified version of the Trier Social Stress Test (TSST; Kirschbaum et al., Citation1993). Catecholamine activity, rather than glucocorticoid-induced changes in brain activity, has been shown to modulate attentional processes (Brennan & Arnsten, Citation2008). Effects of glucocorticoids, on the contrary, might counteract the attention-narrowing catecholaminergic activity by shifting the brain from a stimulus-driven to a more restrained activity level (Henckens et al., Citation2012), thereby helping the brain return to a state of homeostasis after being disrupted by acute stress (de Kloet et al., Citation2005). As participants engaged in the CLT during the respective cortisol but not catecholamine peak, we hypothesized that cortisol increases would not relate to changes in selective attention in neither of the two studies. To be able to test our hypothesis, the CLT took place 28 (Study 1) and 23 (Study 2) minutes after initiation of the respective stressor, when stress-induced cortisol increases were expected to reach their peak (Dickerson & Kemeny, Citation2004; Schwabe et al., Citation2022). Next to analyzing salivary cortisol levels as a marker for HPA axis activity, we measured blood pressure (Study 1) and salivary alpha-amylase (sAA; Study 2) as markers for SAM axis activity.
Study 1
Materials and methods
Participants
Conducting an a priori power analysis using G*Power version 3.1.9.4 (Faul et al., Citation2009) for an analysis of variance (ANOVA) for fixed effects, special effects, main effects, and interactions (2 groups; 1 degree of freedom), with a power of 1 − β ≥ 0.85, at α ≤ 0.05, aiming for a medium to large effect size of f = 0.38, a target sample size of 65 participants was calculated. We based our effect size estimate by averaging the effect sizes attained by two studies investigating the interaction between stress and comparable attentional processes (Alomari et al., Citation2015; Sänger et al., Citation2014). In anticipation of a more conservative effect size, a total of 76 men took part in the study. All participants were students at the Ruhr University Bochum, pursuing different fields of study. Only participants between the ages of 18 and 35 years were tested. We excluded those with a body mass index (BMI) below 18 or above 30 kg/m2, those who were on medication, had chronic illnesses, used drugs, or smoked. Furthermore, participants who experienced exceptional stress in recent times, worked shifts leading up to the testing session, donated blood recently, or consumed more than 15 alcoholic drinks per week were excluded from participation. Four participants had to be excluded, either because their baseline cortisol levels were three times higher than the mean, or their BMI was below 18 kg/m2. This left us with a final sample of 72 participants. Participants’ age ranged between 18 and 32 (M = 23.64; SD = 2.60) years, their BMI ranged from 18.62 to 29.22 (M = 23.58; SD = 2.23) kg/m2. As compensation for taking part in the experiment, participants received 10€. The study was approved by the local ethics committee of the Faculty of Psychology and conducted according to the Declaration of Helsinki.
Stress induction
Participants assigned to the stress condition were subjected to the SECPT, a commonly used method for inducing acute stress in laboratory settings (Schwabe et al., Citation2008). The SECPT, which combines physiological stress with socio-evaluative elements, i.e., social feedback by a reserved observer, has been shown to increase perceived stress levels, autonomic arousal as well as cortisol levels (Schwabe & Schächinger, Citation2018). Participants were instructed to immerse their dominant hand in ice-cold water (0–3 °C) for three minutes and keep it submerged until instructed to remove it. They were required to maintain a neutral facial expression while looking directly into a camera. Participants were explicitly instructed not to make any movements, speak, or produce any other sounds. Additionally, they were observed by a person standing behind the camera that maintained a neutral and reserved facial expression and demeanor. Participants who removed their hand from the water too early were informed that most other participants had lasted longer and were instructed to place their hand just above the water, while continuing to fixate the camera. The socio-evaluative situation therefore lasted a total of three minutes for all participants.
Participants in the control group underwent a standardized control manipulation consisting of hand immersion in lukewarm water (35–37 °C) that contained no socio-evaluative elements. They were explicitly told that they had been assigned to the control condition, as described by Schwabe and Schächinger (Citation2018).
Stress assessment
Via the use of Salivettes® (Sarstedt, Nümbrecht, Germany) salivary samples were taken from participants at baseline as well as 20 and 35 min after stress induction. As a marker for HPA axis activity they were analyzed for salivary cortisol levels at the shared biochemical laboratory of the Departments of Cognitive Psychology and Genetic Psychology (Ruhr University Bochum, Bochum, Germany), after being stored at −20 °C. Analyses were carried out using a Synergy2 plate reader (Biotek, Shoreline, WA) and commercial enzyme-linked immunosorbent assays (ELISAs) for free cortisol in saliva (Demeditec, Kiel, Germany), following the manufacturer’s instructions. The intra-assay coefficients of variation were below 5%, the inter-assay coefficients of variation were below 11%. Due to issues of calibration of the assay caused by incompatibility between the ELISA technique and the Salivettes®, cortisol values turned out higher than would be expected from comparable study designs and stress manipulations. Still, the relative increases in cortisol were suitable for assessing stress reactivity of our participants and evaluating successfulness of our stress manipulation. To monitor autonomic arousal, systolic and diastolic blood pressure was assessed at baseline, during the SECPT or warm water control procedure as well as three, 20, and 35 min after either procedure. To ensure accurate measurements, two successive measurements at each time point were conducted, with the second measurement starting around 30 s after completion of the first. Later, the average of the two measurements was calculated. Blood pressure increases have been shown to be a reliable marker for SAM axis activity (Weber et al., Citation2022). Affect was assessed by having participants answer four questions on their subjective experience of the procedure immediately after its termination. On a scale from 0 (“not at all”) to 100 (“very much”) they stated how stressful, painful, unpleasant, and difficult they had perceived the task (Schwabe et al., Citation2008).
Paradigm
Our paradigm consisted of a modified version of the CLT (Navon, Citation1977). Letters were presented in white color on a black background. There were four possible letter combinations: a large H consisting of small H’s (congruent), a large H consisting of small L’s (incongruent), a large L consisting of small L’s (congruent), and a large L consisting of small H’s (incongruent). Letters were presented in two blocks, focusing either on a global or local level of processing. In the global condition participants were asked to decide for the globally presented (large) letter as fast as possible, while in the local condition their task was to select the locally presented (small) letter by pressing either of two keys on a keyboard in front of them. The order of blocks was counterbalanced across participants to control for any potential order effects. Thus, half of participants engaged in the global condition first while the other half started with the local condition. Each block consisted of 48 letter presentations. Because there were four possible letter combinations, each combination appeared twelve times per block and 24 times in total. The order of letter presentations was randomized for each of the two blocks. The paradigm was used for both Study 1 and Study 2.
Design and procedure
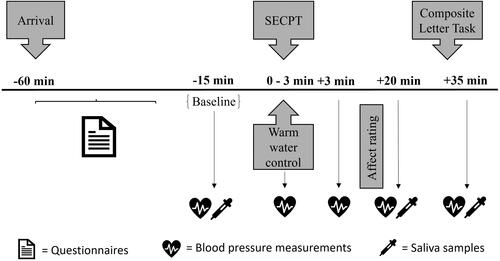
Participants were randomly assigned to either a stressful or non-stressful control condition. Testing sessions took place between 12:00 and 18:00 to control for natural cortisol fluctuations (Russell & Lightman, Citation2019). After their arrival at the laboratory, participants were provided with detailed information about the study and gave written informed consent. The first salivary sample (baseline) was taken, after which a baseline blood pressure measurement was carried out. Next, participants were subjected to either the stressful SECPT or a non-stressful warm water control condition, during which their blood pressure was monitored for the second time. The third blood pressure measurement was conducted three minutes after termination of either procedure (+3). Following the stress induction or control procedure, participants rested for 20 min. After the resting period, they provided a second salivary sample, and their blood pressure was measured for the fourth time (+20). Subsequently, participants engaged in the CLT. Finally, they provided the last salivary sample, and their blood pressure was measured once more (+35). Afterwards, participants were thanked, debriefed, and financially compensated for their participation ().
Figure 1. Experimental procedure of Study 1. SECPT: Socially Evaluated Cold Pressor Test. Times are relative to start/termination of the SECPT/Warm water control.
Statistical analysis
Data analysis was conducted using IBM SPSS Statistics for Windows version 21.0 (IBM Corp., Armonk, NY, Citation2012) and JASP version 0.17.1.0 (JASP Team, Citation2023). The significance level was set to α = 0.05 and all post hoc tests were Bonferroni-corrected. Greenhouse–Geisser corrected values were reported when the assumption of sphericity was not met. Shapiro–Wilk’s test was used to check for violations of normality, in which case data were log-transformed. The between-subjects factor stress (stress vs. control) was included in all ANOVA. Potential group differences regarding the basic sample characteristics age and BMI were checked via two separate ANOVA. To confirm a significant increase in the endocrine stress marker a repeated measures ANOVA was conducted which, next to the factor stress, additionally included the repeated measures factor time (baseline, +20, and +35). For analysis of the autonomic stress response the factor time had five levels (baseline, during, +3, +20, and +35). For analysis of affect a multivariate ANOVA was conducted, including the between-subjects factor stress and, as within-subjects factors, the four different categories of participants’ subjective assessment of the procedure (stressfulness, painfulness, unpleasantness, and difficulty). To test our hypothesis regarding participants’ ability to selectively attend to specific elements of a visual stimulus, average reaction times for each letter combination category (global + congruent, global + incongruent, local + congruent, and local + incongruent) were calculated. Because accuracy rates on the CLT are typically high and ceiling effects therefore likely, calculations were based solely on reaction times for correct answers, as we considered these a more reliable measure of selective attention. Then, a three-way mixed ANOVA was conducted with the between-subjects factor stress and the within-subjects factors globality (global vs. local) and congruence (congruent vs. incongruent). In case of a non-significant influence of the variable stress, an equivalent Bayesian approach was applied to strengthen the evidence base for the null hypothesis that stress does not influence reaction times. Lastly, delta cortisol was calculated by subtracting the baseline cortisol value from the cortisol peak at +20 (Study 1; +10 for Study 2). Subsequently, correlation coefficients between reaction times and delta cortisol were calculated. This calculation was done for the whole sample as well as exclusively for the group of cortisol responders, which were classified as such according to the cortisol response criterium of 1.5 nmol/L baseline to peak increase proposed by Miller et al. (Citation2013).
Results
Sample characteristics
Participants in the stress and control group did not significantly differ in age or BMI (both F < 3.40; both p > 0.069).
Salivary cortisol
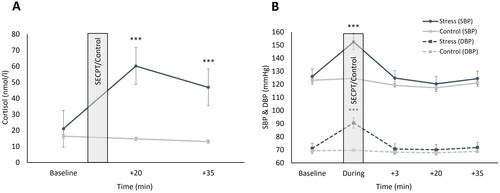
Due to non-normal distribution of data, a log-transformation was applied. Higher cortisol concentrations occurred in stressed compared to non-stressed participants (main effect stress: F[1,71] = 68.39, p < 0.001, ηp2 = 0.48) with generally increasing cortisol concentrations over time (main effect time: F[1.36,100.59] = 43.82, p < 0.001, ηp2 = 0.37). Importantly, salivary cortisol concentrations increased significantly more in stressed compared to non-stressed participants after the stressful or non-stressful condition, respectively (interaction stress x time: F[1.36,100.59] = 77.29, p < 0.001, ηp2 = 0.51). Subsequent post hoc analyses demonstrated that stressed participants had significantly higher cortisol levels at +20 (pBonf. < 0.001) and +35 (pBonf. < 0.001) than non-stressed participants. At baseline, there were no significant differences between groups (p = 0.084; ).
Figure 2. Mean cortisol concentrations (in nanomole per liter; A) and systolic/diastolic blood pressure levels (in millimeters of mercury; B) over the course of the testing session. SECPT: Socially Evaluated Cold Pressor Test; SBP: Systolic blood pressure; DBP: Diastolic Blood Pressure. Error bars represent standard errors of the mean. ***pBonf < 0.001 compared to non-stressed participants. Times are relative to termination of SECPT/Warm water control. Note: due to issues regarding calibration of the assay, cortisol values turned out unusually high.
Blood pressure
As blood pressure data were not normally distributed, log-transformations were applied prior to analyses. Stressed participants had higher blood pressure values than non-stressed participants (main effect stress systolic: F[1,71] = 8.72, p = 0.004, ηp2 = 0.11; main effect stress diastolic: F[1,71] = 11.38, p = 0.001, ηp2 = 0.13). Furthermore, blood pressure increased in both stressed as well as non-stressed participants over time (main effect time systolic: F[3.18,235.25] = 94.65, p < 0.001, ηp2 = 0.56; main effect time diastolic: F[3.6,266.31] = 75.74, p < 0.001, ηp2 = 0.51). Importantly, over time, blood pressure increased more in participants taking part in the SECPT compared to those being exposed to the non-stressful control version (interaction stress x time systolic: F[3.18,235.25] = 48.06, p < 0.001, ηp2 = 0.39; interaction stress x time diastolic: F[3.6,266.31] = 58.78, p < 0.001, ηp2 = 0.44). Post-hoc analyses revealed that stressed participants had higher systolic (pBonf < 0.001) as well as diastolic (pBonf < 0.001) blood pressure during the SECPT than non-stressed participants during the warm water control only, but not at the other timepoints (all p > 0.087; ).
Affective stress response
Stressed participants perceived the procedure to be more stressful (main effect stress: F[1,71] = 154.03, p < 0.001, ηp2 = 0.68), painful (main effect stress: F[1,71] = 441.28, p < 0.001, ηp2 = 0.86), unpleasant (main effect stress: F[1,71] = 232.87, p < 0.001, ηp2 = 0.76), and difficult (main effect stress: F[1,71] = 184.64, p < 0.001, ηp2 = 0.71) than non-stressed participants.
Overall, we successfully induced stress in our participants, as demonstrated by significantly increased salivary cortisol levels, systolic and diastolic blood pressure as well as negative affect (NA). In particular, cortisol concentrations were elevated at the time of the CLT in the stress, but not the control group.
Reaction time
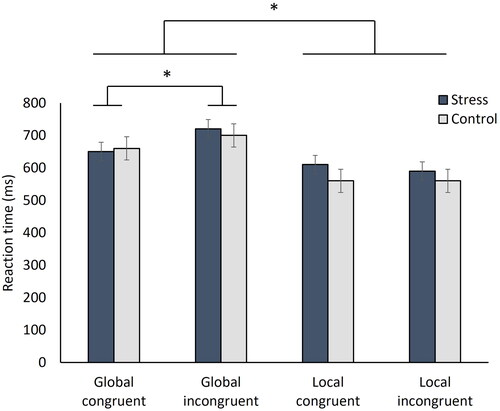
Participants made faster decisions when they were asked to detect the locally presented letter (main effect globality: F[1,71] = 20.86, p < 0.001, ηp2 = 0.23). Moreover, faster reaction times for congruent than incongruent letter pairs were observed, if the task was to detect the globally presented letter (interaction globality × congruence: F[1,71] = 4.10, p = 0.047, ηp2 = 0.05; post hoc: pBonf = 0.009). All other effects were not significant (all F < 2.41; all p > 0.125; ). Participants’ reaction times thus depended on whether they had to select the globally or locally presented letter or whether letter combinations were displayed congruently or incongruently, but not by the factor stress.
Figure 3. Mean reaction times (in milliseconds) per letter combination category and condition. *p < 0.05.
As no significant influence of stress on reaction time could be demonstrated applying a conventional statistical approach, we additionally conducted the Bayesian equivalent. We found anecdotal evidence in favor of the null hypothesis (BF10 = 0.35), suggesting no effect of stress on reaction time.
Correlations
First, correlation coefficients between delta cortisol and reaction time were calculated for the overall reaction times of each participant, irrespective of globality and congruence, as well as for each letter combination category (global + congruent, global + incongruent, local + congruent, and local + incongruent) separately. In each case, delta cortisol was not associated with participants’ reaction times (all p > 0.191; −0.1 > all R2 < 0.15).
Next, correlation coefficients between delta cortisol and reaction times were calculated for the group of cortisol responders only (n = 41; 56.94%). Neither for overall reaction times nor for reaction times in the separate letter combination categories did delta cortisol correlate with performance (all p > 0.273; −0.17 < all R2 < 0.13).
Study 2
In light of the null results regarding the effects of stress on selective attention obtained in Study 1, we decided to conduct a second experiment utilizing a different laboratory stressor and testing both men and women to extend the data base. After utilizing a primarily physiological stress induction paradigm in Study 1, with the TSST we went for a purely psychosocial stressor in Study 2, as we reasoned that the nature of stress induction might influence stress effects on selective attention. Moreover, as the TSST is considered a more potent stressor than the SECPT (Schwabe & Schächinger, Citation2018), we hoped for higher cortisol increases compared to Study 1, which might in turn affect selective attention processes more likely.
Materials and methods
Participants
When calculating the target sample size, we applied the same approach as described for Study 1. We recruited a total of 77 healthy individuals (39 men and 38 women) from Ruhr University Bochum using various recruitment methods, such as posters, handouts, social media, and online advertisements. Before coming to the laboratory, participants underwent a screening process via email or telephone. Inclusion and exclusion criteria were the same as in Study 1. As sex hormones can affect stress reactivity (Kirschbaum et al., Citation1999; Kudielka et al., Citation2009) and its effect on memory (Jentsch et al., Citation2022; Merz & Wolf, Citation2017), we included only women who were not using hormonal contraceptives and tested them preferably during the luteal phase, as indicated by the screening procedure. Out of the 35 women, three were in the follicular phase (8.57%), the remaining 32 (91.43%) in the luteal phase. We statistically confirmed that there were no significant differences in cycle phase distribution between the groups (see results section for details). We had to exclude five participants because their baseline cortisol levels were three times higher than the mean, leaving us with a final sample of 72 participants (37 men and 35 women). Participants’ age ranged between 18 and 33 (M = 23.87; SD = 3.67) years. BMI ranged from 18.69 to 30.03 (M = 23.13; SD = 2.80) kg/m2. Participants were compensated with either 30€ or three study credits. The study was approved by the local ethics committee of the Faculty of Psychology and conducted according to the Declaration of Helsinki. Data of this study have been collected in the context of a separate, already published experiment (Rüttgens & Wolf, Citation2023).
Stress induction
Because data of this study were collected in context of a second, independent investigation, instead of the regular version of the TSST (Kirschbaum et al., Citation1993), a modified version was utilized as a means of stress induction (Rüttgens & Wolf, Citation2023). After a 5-min-long preparation phase, participants were asked to talk for eight minutes about their personal strengths and characteristics in front of a reserved committee consisting of a man and a woman. There was no mental arithmetic part in this version of the TSST. Participants were told that they were being videotaped and that their voice was being recorded via a microphone. During the whole interview, they could observe themselves on a large TV screen located next to the committee members. Committee members did not provide any social feedback, which made the situation uncontrollable and unpredictable for the participants, factors which have been shown to reliably activate the HPA axis (Dickerson & Kemeny, Citation2004).
Participants in the control condition took part in the friendly-TSST (f-TSST; Wiemers et al., Citation2013). Instead of discussing personal strengths and applying for a job, participants were asked to talk about their CV, hobbies, and interests. Committee members in this version were supportive, positive as well as approachable and no video or voice recording was taking place. The rationale behind these changes was to reduce the elements of uncontrollability, unpredictability, and social evaluation that can influence HPA axis activity and lead to higher cortisol levels (Dickerson & Kemeny, Citation2004).
Stress assessment
Saliva samples were taken from participants at baseline, one minute prior to the start of the TSST, as well as one, 10, and 25 min after termination of the stressor to assess salivary cortisol increase as a marker of HPA axis activity, using Salivettes® (Sarstedt, Nümbrecht, Germany). Samples were stored at −20 °C and analyzed using a time-resolved fluorescence immunoassay from IBL, Hamburg, Germany. All intra- and inter-assay coefficients of variation were below 10.16%. Moreover, as a biomarker of sympathetic response, sAA levels were measured from saliva using a colorimetric test with the substrate reagent CNP-G3. The coefficients of variation for both intra- and inter-assays were below 8%. The German version of the Positive and Negative Affect Schedule (PANAS; Krohne et al., Citation1996) was used to assess participants’ current affect, with a total of 20 items on a five-point scale that could be divided into positive affect (PA) and NA values.
Design and procedure
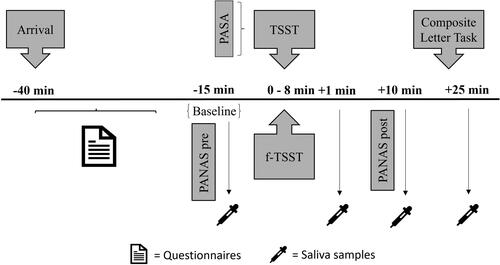
Participants were divided into two groups (stressed and non-stressed participants) using a random assignment process. To control for natural cortisol fluctuations, participants were tested between 12:00 and 18:00 (Russell & Lightman, Citation2019). Upon arriving at the laboratory, participants did not know which group they had been assigned to. They provided informed consent and were informed about the possibility of having to hold a free speech in front of a committee while being videotaped. They also completed a demographic questionnaire and the State-Trait Anxiety Inventory – Trait Version (STAI-T; Laux et al., Citation1981) to assess their tendency to feelings of anxiety. They then completed the PANAS to rate their current mood and provided their first saliva sample (baseline). Shortly before the start of either the stressful or non-stressful procedure, participants were informed of their group assignment. Participants in the stress group completed the Primary Appraisal Secondary Appraisal questionnaire (PASA; Gaab, Citation2009) to assess anticipatory stress. Then, they underwent the stressful or non-stressful interview situation. Immediately after the interview, participants provided their second saliva sample (+1), and completed a second PANAS questionnaire. Ten minutes later, they provided a third saliva sample (+10), after which they engaged in the CLT. Finally, they provided the fourth and last saliva sample (+25), were thanked, debriefed, and paid ().
Figure 4. Experimental procedure of Study 2. (f-)TSST: (friendly-)Trier Social Stress Test; PANAS: Positive and Negative Affect Schedule; PASA: Primary Appraisal Secondary Appraisal. Times are relative to start/termination of the (f-)TSST.
Statistical analysis
Data analysis was almost identical to that of Study 1. In the following, we will thus exclusively list the differences between the two studies.
Because both men and women took part in Study 2, the additional between-subjects factor sex (men vs. women) was included in all ANOVA. For the repeated measures ANOVA regarding the endocrine stress manipulation the within-subjects factor time had five (baseline, −1, +1, +10, and +25), for analysis of affect two (before vs. after) levels. Symptoms of anxiety were added as an additional sample characteristic and, like age and BMI, analyzed via an ANOVA.
Results
Sample characteristics
Stressed and non-stressed participants did not significantly differ in age, BMI, or symptoms of anxiety as measured with the STAI-T (all F < 2.23; all p > 0.14). Furthermore, there was no significant difference in the distribution of cycle phases in women between groups (χ2 [1] = 0.37, p = 0.543).
Salivary cortisol
As cortisol data were non-normally distributed, a log-transformation was applied. We observed higher cortisol reactions in stressed compared to non-stressed participants (main effect stress: F[1.81,122.72] = 19.15, p < 0.001, ηp2 = 0.22). Specifically, salivary cortisol levels increased significantly more in stressed than non-stressed participants over the course of the testing session (interaction stress x time: F[1.81,122.72] = 18.24, p < 0.001, ηp2 = 0.21). Stressed participants’ cortisol levels were significantly higher at + 1 (pBonf = 0.004), + 10 (pBonf < 0.001), and + 25 (pBonf < 0.001) than those of non-stressed participants, as indicated by subsequently conducted post hoc analyses. All other effects were not significant (all F < 1.63; all p > 0.203). Cortisol levels did not significantly differ between groups at baseline (p = 0.142; ).
Figure 5. Mean cortisol concentrations (in nanomole per liter; A) and salivary alpha-amylase (sAA) levels (in units per milliliter; B) over the course of the testing session. (f-)TSST: (friendly-)Trier Social Stress Test. Error bars represent standard errors of the mean. ***p < 0.001/**p < 0.01/*p < 0.05 compared to non-stressed participants. Times are relative to termination of (f-)TSST.
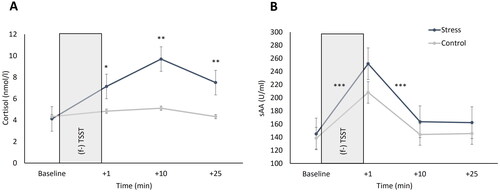
sAA
As sAA data were not normally distributed, analyses were conducted with log-transformed data. There was an increase in sAA levels in both stressed as well as non-stressed participants (main effect time: F[2.14,145.58] = 50.13, p < 0.001, ηp2 = 0.42). Concretely, participants’ sAA levels significantly increased from baseline to + 1 (pBonf < 0.001), and significantly decreased from + 1 to + 10 (pBonf < 0.001). All other effects remained non-significant (all F < 2.05; all p > 0.108). Stressed and non-stressed participants did not differ in sAA levels at any point of measurement (all p > 0.092; ).
Affective stress response
Compared to women in the stress group (M = 3.02; SD = 0.74) non-stressed women (M = 3.53; SD = 0.78) experienced significantly higher PA after the f-TSST (main effect time: F[1,71] = 6.48, p < 0.001, ηp2 = 0.19; interaction time x stress: F[1,71] = 4.25, p = 0.043, ηp2 = 0.06; interaction time × stress × sex: F[1,71] = 4.03, p = 0.049, ηp2 = 0.06; post hoc: pBonf = 0.04). For men, no significant differences were found (all p > 0.691). All other effects were not significant (all F < 0.03; all p > 0.863).
Stressed participants (M = 1.57; SD = 0.61) experienced significantly higher NA after the TSST than non-stressed participants (M = 1.19; SD = 0.23; main effect time: F[1,71] = 5.48, p = 0.022, ηp2 = 0.08; interaction time × stress: F[1,71] = 26.09, p < 0.001, ηp2 = 0.27; post hoc: pBonf = 0.001). All other effects were non-significant (all F < 0.21; all p > 0.646).
Reaction time
Participants reacted faster to incongruent than to congruent letter pairs, if the task was to detect the locally presented letter (interaction globality × congruence: F[1,71] = 4.10, p = 0.047, ηp2 = 0.05). When conducting post hoc tests and correcting for multiple comparisons, we were not able to locate the specific effect (all pBonf > 0.08). No other effect was significant (all F < 0.88; all p > 0.352; ). Reaction time therefore was, like in Study 1, not influenced by the factor stress. Although it seemed to matter whether participants had to select the globally or locally displayed letter or whether letter combinations were presented congruently or incongruently, no conclusions regarding the specifics of these effects can be drawn. To make results more comparable to Study 1, which tested men only, we repeated the analysis including exclusively data of men (n = 36). This approach did not lead to any significant effects (all F < 3.56; all p > 0.068).
Figure 6. Mean reaction times (in milliseconds) per letter combination category and condition.
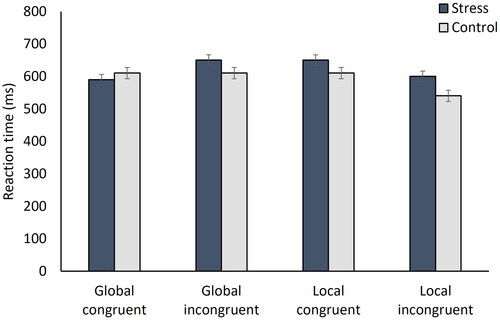
Bayesian analyses for the complete sample (BF10 < 0.38) as well as a sample consisting of men only (BF10 = 0.40) demonstrated anecdotal evidence in favor of the null hypothesis and thus no indication of an influence of stress on reaction times in both cases.
Correlations
Following the procedure of Study 1, correlation coefficients between delta cortisol and reaction time were calculated for the overall reaction times of each participant as well as for each letter combination category separately. Delta cortisol was not related to participants’ reaction times (all p > 0.435; −0.04 > all R2 < 0.09).
Finally, we included only the group of cortisol responders in our analyses (n = 37; 51.39%). Again, there was no association between delta cortisol and participants’ overall reaction times nor their reaction times in the separate letter combination categories (all p > 0.122; −0.12 < all R2 < 0.26).
Combined results
Although Study 1 and 2 were conducted independent from each other and absolute cortisol values are not comparable, we nonetheless decided to combine the two datasets and repeat the respective analyses regarding reaction times and the correlations between reaction times and delta cortisol. With this approach we expected to gain additional insight into the relationship between stress and selective attention with a larger sample size and a resulting increase in statistical power. The sample size for the following analyses thus consisted of a total of 144 participants.
Reaction time
Participants were faster when selecting the locally presented letter (main effect globality: F[1,143] = 15.74, p < 0.001, ηp2 = 0.1). Furthermore, participants reacted faster to congruent than to incongruent letter pairs in the global, but not the local condition (interaction globality × congruence: F[1,143] = 9.32, p = 0.003, ηp2 = 0.06; post hoc: pBonf = 0.004). Participants’ reaction times were thus affected by the factors globality and congruence, rather than participants’ stress levels. All other effects were not significant (all F < 1.32; all p > 0.253). We repeated analyses of the combined data sets including only data of men (n = 108). Again, participants selected the local letter faster than the global letter (main effect globality: F[1,107] = 17.58, p < 0.001, ηp2 = 0.14). In the global condition, faster reaction times for congruent than incongruent letter pairs were obtained (interaction globality × congruence: F[1,107] = 9.06, p = 0.003, ηp2 = 0.08; post hoc: pBonf = 0.002). All other effects were not significant (all F < 0.81; all p > 0.371).
We once more conducted Bayesian analyses for the complete sample (BF10 < 0.32) as well as a sample consisting of exclusively men (BF10 = 0.31) and found anecdotal evidence in favor of the null hypothesis in both cases, suggesting no influence of stress on participants’ reaction times.
Exploratively, we added study allocation (Study 1 vs. Study 2) as a separate predictor to investigate potential interactions with the variable stress. Again, participants’ reaction times were faster when asked to select the locally presented letter (main effect globality: F[1,143] = 16.72, p < 0.001, ηp2 = 0.1). Also, participants made faster decisions for local than global letters in Study 1, but not Study 2 (interaction study × globality: F[1,143] = 10.21, p = 0.002, ηp2 = 0.07; post hoc: pBonf < 0.001). Furthermore, participants had lower reaction times for congruent compared to incongruent letter combinations in the global condition (interaction globality x congruence: F[1,143] = 9.17, p = 0.003, ηp2 = 0.06; post hoc: pBonf = 0.005). All other effects were non-significant (all F < 2.37; all p > 0.13). There was thus no interaction between study allocation and stress.
Correlations
When calculating correlation coefficients between delta cortisol and reaction times (overall and per letter combination category), again, no significant correlation could be demonstrated (all p > 0.356; all R2 < 0.08).
Lastly, we once more looked at cortisol responders only. Of the 144 participants 79 (54.86%) could be classified as responders. Neither overall reaction times nor reaction times for the separate letter combination categories were associated with delta cortisol (all p > 0.36; −0.04 < all R2 < 0.1).
General discussion
We aimed at investigating how increased levels of the stress hormone cortisol influence the selective perception of visual stimuli with a narrow or holistic focus. In two separate studies that utilized different laboratory stressors, stress levels did not change CLT performance, no matter which analysis strategy we pursued. We attempt to explain these findings by shedding light on the mechanisms at play and provide recommendations for future research.
Stress effects on global-local perception
In accordance with our hypothesis, neither in Study 1 or Study 2, nor in the combined data sets of both studies stress levels influenced participants’ ability to focus on the small or large letter displayed on the screen. The nature of these results might be rooted in the timing of stress induction relative to participants’ engagement in the CLT. In Study 1, the task took place 25 min after stressor offset (28 min post onset). In Study 2, participants were exposed to the CLT 15 min after stressor offset (23 min post onset). While SAM axis activity and the resulting release of catecholamines peaked shortly after beginning of either SECPT or TSST, the CLT in both studies took place in close temporal proximity to the respective cortisol peak (de Kloet et al., Citation2005). Catecholamine activity has been shown to play a decisive role in attention modulation by modulating PFC activation (Brennan & Arnsten, Citation2008). The PFC is highly sensitive to its neurochemical environment, specifically to heightened levels of the catecholamines DA and NA. Research conducted on animals using electrophysiological methods indicates that NA enhances neural signaling by activating postsynaptic α2A-adrenoceptors in the PFC. Conversely, DA reduces background neural activity by mildly stimulating D1-receptors, thereby effectively reducing noise (Arnsten, Citation2011).
Differential effects of catecholamines and glucocorticoids
While catecholamine activity is generally thought to improve focus and narrow attention, the role of glucocorticoids, like cortisol, is more ambivalent and depends, inter alia, on the timing of stress induction. By acting on mineralocorticoid receptors, cortisol induces fast-acting non-genomic effects, thereby facilitating the effects of catecholamines like DA and NA. Slower genomic cortisol effects acting on glucocorticoid receptors, on the other hand, have been shown to downregulate catecholaminergic activity (Schwabe et al., Citation2022). In both studies, participants engaged in the CLT when solely the non-genomic effects of cortisol unfolded, as its genomic effects only take effect approximately 1 h post-stressor onset (Schwabe et al., Citation2022). While this, in theory, should have facilitated catecholamine-induced attention narrowing and a shift in participants’ tendency to focus on the small letters, cortisol levels did not modulate reaction times in neither of the two studies. We suspect that for non-genomic cortisol mechanisms to influence catecholaminergic effects on cognitive processes, catecholamine levels must be increased in the first place. Because in both Study 1 and Study 2 markers for SAM axis activity and thus, indirectly, for the release of DA and NA (Thoma et al., Citation2012), had already returned to baseline levels when the CLT took place, this prerequisite was not met. Notably, in Study 2 stressed and non-stressed participants exhibited similar elevations in sAA levels, suggesting activation of the vegetative nervous system in both groups. Previous research has demonstrated that catecholamine release can be triggered by moderate physical activities, such as standing upright and engaging in conversation (Het et al., Citation2009; Nater & Rohleder, Citation2009). In this study, elevated HPA axis activity, however, was only demonstrated in stressed participants. Future studies should implement designs in which participants engage in a version of the CLT during or immediately after stress induction, when catecholamine levels, specifically DA and NA, are still heightened to prove our reasoning.
Globality and congruence
In Study 1, the factors globality and congruence did affect participants’ ability to selectively focus either on the small or large letter during the CLT. Research indicates a general precedence for global over local stimuli, which is referred to as the global precedence effect (GPE; Lachmann et al., Citation2014). The GPE consists of two parts, a global advantage effect, suggesting faster global vs. local response times, and an interference effect, referring to an interference of global distractors when identifying local targets (Poirel et al., Citation2008). Composite figures composed of both letters and non-letters can be analyzed either with a broad or narrow focus (Piepers & Robbins, Citation2012). Holistic processing is thought to be slower and more effortful for non-letter figures, whereas for stimuli composed of letters is assumed to be less cognitively demanding than narrow processing (Lachmann & van Leeuwen, Citation2008a, Citation2008b). Following this logic, for our version of the CLT we would have expected improved reaction times in the global condition. Contrary to this expectation, participants in Study 1 made faster decisions in the local condition. While global advantage is thought to be evidence of holistic processing, research has shown that non-letter composite figures might be processed with a tendency toward an analytical processing style, leading to the absence of the GPE and improved reaction times when focusing on the small letter (Lachmann et al., Citation2014; Schmitt et al., Citation2017). For this effect to occur, presentation of the composite figures must closely resemble reading-like conditions, including focusing on a central (foveal) point for local stimuli, where the small letters are roughly sized for comfortable reading of single letters. Additionally, the size of the large letter must be kept within a range comparable to the effective visual area used for reading whole words (Schmitt et al., Citation2017). As these prerequisites were met in the version of the CLT we utilized, they offer a plausible explanation for the absence of the GPE in both studies as well as the advantage for local stimuli in Study 1. Beyond that, certain stimulus characteristics have been shown to cause absence of the GPE. For instance, by increasing the size and reducing the number of local stimuli in a composite figure, a shift from global to local processing has been observed (Kimchi & Palmer, Citation1982). Moreover, individual differences in processing tendency exist, with some people having a natural bias toward local visual elements (Dale & Arnell, Citation2010). Because in our version of the CLT local letters were relatively small and numerous, and because sample sizes of both studies were large enough to make up for individual differences, we suspect that the resemblance of reading-like conditions is the most plausible explanation for absence of the GPE in our data. By using non-letter composite figures, for instance figures consisting of symbols, potential letter-specific effects as well as their interaction with factors like globality and congruence could be further clarified by future studies.
Limitations
While offering novel insights into the relationship between stress level and selective attention, this study has several limitations. First, due to the significant differences in absolute cortisol output and increase between the two studies, comparability is limited. Nevertheless, we were able to demonstrate that stress manipulations on the endocrine level were successful in both studies. While in Study 1 cortisol increased by a factor of 2.85 from baseline to peak, for Study 2 we calculated a relative increase by a factor of 2.35. Thus, although relative cortisol increases, independent of absolute values, were not equal between the two studies, they were at least comparable. In addition, because stress levels did not modulate participants’ reaction times in neither of the two studies in the first place, potential consequences of this limitation might be negligible. Importantly, because in Study 1 cortisol levels were assessed only three times over the course of the testing session, calculation of the baseline to peak increase and subsequent analyses might have been limited in informative value. Choosing the TSST as a stressor for Study 2 was in part rationalized by the assumption that it might induce stronger stress reactions compared to the SECPT (Schwabe & Schächinger, Citation2018; for a comparison of Cold Pressor Test with the TSST: Skoluda et al., Citation2015). Due to the above-discussed issues regarding the comparability of absolute cortisol increases between the two studies, we were not able to determine whether stress reactions were indeed stronger in Study 2. Second, while we tested both men and women in Study 2, only men participated in Study 1. Because sex has been shown to affect stress reactivity (Kirschbaum et al., Citation1999; Kudielka et al., Citation2009) as well as performance on tasks involving attention (Merritt et al., Citation2007), differences in the distribution of men and women between the two studies might impact generalizability of our results. Sex, however, influenced neither stress reactivity nor CLT performance in Study 2. Moreover, results did not change when we included exclusively men in the analyses of Study 2 as well as the combined data sets of Study 1 and 2. We speculate that sex did not modulate stress reactivity in Study 2 because women were tested primarily during the luteal phase of their menstrual cycle. During this phase, stress reactivity of men and women is assumed to be comparable (Kudielka et al., Citation2009). Literature on sex effects on attention, on the other hand, is inconclusive, particularly when the CLT is used to study selective attention. While Lee et al. (Citation2012) demonstrated overall faster reaction times in men than women, Kimchi et al. (Citation2009) found no overall sex differences. The fact that global-local perception was modulated by the factor globality in Study 1 only might thus be based on potential differences between men and women in how they perceive and process composite figures. While sex did not significantly influence attention in Study 2, sex differences in processes related to selective attention might still have shifted the overall pattern of results. Clearly, more research regarding sex effects on selective attention is needed. Third, as in both studies participants engaged in the CLT when SAM axis activity had already returned to baseline, we are not able to make assumptions about the effects of catecholaminergic activity on selective attention. Lastly, although the CLT and its diverse variants have been used in scientific studies for decades, to this day there is no consensus regarding the specific mental processes that are required to engage in this task (Navon, Citation2003). This is further illustrated by Dale and Arnell (Citation2013), who examined test–retest reliability of individual performances on a task utilizing classical composite letters. While reliability for composite figures consisting of hierarchical shapes and faces was high, performance regarding composite letters was shown to be less reliable. Furthermore, they found measures of global–local perception tendencies for letters, hierarchical shapes, and faces not to be related to one another. This speaks for the fact that different categories of visual stimuli tap into different aspects of global-local processing, and selective attention in general. Thus, although global-local interference effects have been shown to be generally more pronounced for compound letters than for compound shapes (Gerlach & Krumborg, Citation2014), results of the current investigation might still be limited by reliability of the CLT. Besides, the cognitive process involved is still in dispute.
Conclusion
This article reported data of two separate experiments investigating the influence of stress on global-local perception. Increased cortisol levels did not affect participants’ ability to deliberately attend to either the local or global elements of a visual stimulus. In one of the two studies, participants made faster decisions when having to select the small letter, speaking against global precedence. Because the skill of reading seems to be unique when investigating selective visual processing, the GPE might not be universally applicable to all variants of composite figures. As the cognitive process underlying global–local perception remains unclear, and reliability of the CLT might be limited, results should be interpreted with caution. By changing the timing of stress induction and utilizing different variants of letter and non-letter composite figures, future studies could shed further light on the underlying mechanism of attention management.
Author Contributions
Tobias Rüttgens: Conceptualization, Formal analysis, Writing - Original Draft, Visualization; Boris Suchan: Supervision, Writing - Review & Editing; Oliver T. Wolf: Funding acquisition, Conceptualization, Supervision; Christian J. Merz: Supervision, Writing - Review & Editing
Acknowledgments
We thank Stefanie Schultheis, Aryanne Raymundo, and Nicolas Morawietz for their help with participant recruitment and data acquisition.
Disclosure statement
The authors report no conflict of interest.
Additional information
Funding
Notes on contributors
Tobias Rüttgens
Tobias Rüttgens (M.Sc. Psychology, Maastricht University, 2019) is a PhD student at the Department of Cognitive Psychology at Ruhr University Bochum. His work focuses on the effects of stress on cognition, specifically memory formation.
Boris Suchan
Boris Suchan (diploma in Psychology, Heinrich Heine University Düsseldorf, 1994; PhD, Heinrich Heine University Düsseldorf, 1999; habilitation, Ruhr University Bochum, 2006) is the head of the Clinical Neuropsychology unit and the Neuropsychological Therapy Centre at Ruhr University in Bochum. He is primarily interested in long-term memory and face/body processing.
Oliver T. Wolf
Oliver T. Wolf (diploma in Psychology, Trier University, 1995; PhD, Trier University, 1997; habilitation, Heinrich Heine University Düsseldorf, 2001) is a full professor of Cognitive Psychology at Ruhr University Bochum. He investigates the influence of stress and stress hormones on cognition and emotion.
Christian J. Merz
Christian J. Merz (diploma in Psychology, Justus Liebig University Giessen, 2007; PhD, Ruhr University Bochum, 2011; habilitation, Ruhr University Bochum, 2017) is an associate professor of Cognitive Psychology at Ruhr University Bochum. His research program focuses on the influence of stress and sex hormones on (emotional) learning and memory processes.
References
- Allen, A. P., Kennedy, P. J., Cryan, J. F., Dinan, T. G., & Clarke, G. (2014). Biological and psychological markers of stress in humans: focus on the Trier Social Stress Test. Neuroscience and Biobehavioral Reviews, 38, 1–14. https://doi.org/10.1016/j.neubiorev.2013.11.005
- Alomari, R. A., Fernandez, M., Banks, J. B., Acosta, J., & Tartar, J. L. (2015). Acute stress dysregulates the LPP ERP response to emotional pictures and impairs sustained attention: Time-sensitive effects. Brain Sciences, 5(2), 201–219. https://doi.org/10.3390/brainsci5020201
- Arnsten, A. F. (2009). Stress signalling pathways that impair prefrontal cortex structure and function. Nature Reviews. Neuroscience, 10(6), 410–422. https://doi.org/10.1038/nrn2648
- Arnsten, A. F. (2011). Catecholamine influences on dorsolateral prefrontal cortical networks. Biological Psychiatry, 69(12), e89–e99. https://doi.org/10.1016/j.biopsych.2011.01.027
- Baisa, A., Mevorach, C., & Shalev, L. (2019). Can performance in Navon letters among people with autism be affected by saliency? Reexamination of the literature. Review Journal of Autism and Developmental Disorders, 6(1), 1–12. https://doi.org/10.1007/s40489-018-0150-8
- Blanca, M. J., Zalabardo, C., García-Criado, F., & Siles, R. (1994). Hemispheric differences in global and local processing dependent on exposure duration. Neuropsychologia, 32(11), 1343–1351. https://doi.org/10.1016/0028-3932(94)00067-0
- Brennan, A. R., & Arnsten, A. F. (2008). Neuronal mechanisms underlying attention deficit hyperactivity disorder: The influence of arousal on prefrontal cortical function. Annals of the New York Academy of Sciences, 1129(1), 236–245. https://doi.org/10.1196/annals.1417.007
- Dale, G., & Arnell, K. M. (2010). Individual differences in dispositional focus of attention predict attentional blink magnitude. Attention, Perception & Psychophysics, 72(3), 602–606. https://doi.org/10.3758/APP.72.3.602
- Dale, G., & Arnell, K. M. (2013). Investigating the stability of and relationships among global/local processing measures. Attention, Perception & Psychophysics, 75(3), 394–406. https://doi.org/10.3758/s13414-012-0416-7
- de Kloet, E. R., Joëls, M., & Holsboer, F. (2005). Stress and the brain: From adaptation to disease. Nature Reviews. Neuroscience, 6(6), 463–475. https://doi.org/10.1038/nrn1683
- de Kloet, E. R., Sibug, R. M., Helmerhorst, F. M., & Schmidt, M. V. (2005). Stress, genes and the mechanism of programming the brain for later life. Neuroscience and Biobehavioral Reviews, 29(2), 271–281. https://doi.org/10.1016/j.neubiorev.2004.10.008
- de Quervain, D. J., Aerni, A., & Roozendaal, B. (2007). Preventive effect of beta-adrenoceptor blockade on glucocorticoid-induced memory retrieval deficits. The American Journal of Psychiatry, 164(6), 967–969. https://doi.org/10.1176/ajp.2007.164.6.967
- Dickerson, S. S., & Kemeny, M. E. (2004). Acute stressors and cortisol responses: A theoretical integration and synthesis of laboratory research. Psychological Bulletin, 130(3), 355–391. https://doi.org/10.1037/0033-2909.130.3.355
- Driver, J. (2001). A selective review of selective attention research from the past century. British Journal of Psychology, 92(1), 53–78. https://doi.org/10.1348/000712601162103
- Faul, F., Erdfelder, E., Buchner, A., & Lang, A. G. (2009). Statistical power analyses using G*Power 3.1: Tests for correlation and regression analyses. Behavior Research Methods, 41(4), 1149–1160. https://doi.org/10.3758/BRM.41.4.1149
- Gaab, J. (2009). PASA-primary appraisal secondary appraisal. A questionnaire for the assessment of cognitive appraisals of situations. Verhaltenstherapie, 19(2), 114–115. https://doi.org/10.1159/000223610
- Gasper, K., & Clore, G. L. (2002). Attending to the big picture: Mood and global versus local processing of visual information. Psychological Science, 13(1), 34–40. https://doi.org/10.1111/1467-9280.00406
- Gerlach, C., & Krumborg, J. R. (2014). Same, same—but different: on the use of Navon derived measures of global/local processing in studies of face processing. Acta Psychologica, 153, 28–38. https://doi.org/10.1016/j.actpsy.2014.09.004
- Henckens, M. J., van Wingen, G. A., Joëls, M., & Fernández, G. (2012). Time-dependent effects of cortisol on selective attention and emotional interference: A functional MRI study. Frontiers in Integrative Neuroscience, 6, 66. https://doi.org/10.3389/fnint.2012.00066
- Het, S., Rohleder, N., Schoofs, D., Kirschbaum, C., & Wolf, O. T. (2009). Neuroendocrine and psychometric evaluation of a placebo version of the ‘Trier Social Stress Test. Psychoneuroendocrinology, 34(7), 1075–1086. https://doi.org/10.1016/j.psyneuen.2009.02.008
- IBM Corp. (2012). IBM SPSS Statistics for Windows (Version 21.0) [Computer software]. IBM Corp.
- JASP Team (2023). JASP (version 0.17.1.0) [Computer software].
- Jentsch, V. L., Pötzl, L., Wolf, O. T., & Merz, C. J. (2022). Hormonal contraceptive usage influences stress hormone effects on cognition and emotion. Frontiers in Neuroendocrinology, 67, 101012. https://doi.org/10.1016/j.yfrne.2022.101012
- Kimchi, R., & Palmer, S. E. (1982). Form and texture in hierarchically constructed patterns. Journal of Experimental Psychology. Human Perception and Performance, 8(4), 521–535. https://doi.org/10.1037//0096-1523.8.4.521
- Kimchi, R., Amishav, R., & Sulitzeanu-Kenan, A. (2009). Gender differences in global-local perception? Evidence from orientation and shape judgments. Acta Psychologica, 130(1), 64–71. https://doi.org/10.1016/j.actpsy.2008.10.002
- Kirschbaum, C., Pirke, K. M., & Hellhammer, D. H. (1993). The ‘trier social stress test’–a tool for investigating psychobiological stress responses in a laboratory setting. Neuropsychobiology, 28(1–2), 76–81. https://doi.org/10.1159/000119004
- Kirschbaum, C., Kudielka, B. M., Gaab, J., Schommer, N. C., & Hellhammer, D. H. (1999). Impact of gender, menstrual cycle phase, and oral contraceptives on the activity of the hypothalamus-pituitary-adrenal axis. Psychosomatic Medicine, 61(2), 154–162. https://doi.org/10.1097/00006842-199903000-00006
- Krohne, H. W., Egloff, B., Kohlmann, C. W., & Tausch, A. (1996). Untersuchungen mit einer deutschen version der “Positive and Negative Affect Schedule” (PANAS). Diagnostica, 42, 139–156. https://doi.org/10.1016/j.psyneuen.2020.104607
- Kudielka, B. M., Hellhammer, D. H., & Wüst, S. (2009). Why do we respond so differently? Reviewing determinants of human salivary cortisol responses to challenge. Psychoneuroendocrinology, 34(1), 2–18. https://doi.org/10.1016/j.psyneuen.2008.10.004
- Lachmann, T., & van Leeuwen, C. (2008a). Differentiation of holistic processing in the time course of letter recognition. Acta Psychologica, 129(1), 121–129. https://doi.org/10.1016/j.actpsy.2008.05.003
- Lachmann, T., & van Leeuwen, C. (2008b). Different letter-processing strategies in diagnostic subgroups of developmental dyslexia. Cognitive Neuropsychology, 25(5), 730–744. https://doi.org/10.1080/02643290802309514
- Lachmann, T., Schmitt, A., Braet, W., & van Leeuwen, C. (2014). Letters in the forest: Global precedence effect disappears for letters but not for non-letters under readinglike conditions. Frontiers in Psychology, 5, 705. https://doi.org/10.3389/fpsyg.2014.00705
- Laux, L., Glanzmann, P., Schaffner, P., & Spielberger, C. D. (1981). State-trait anxiety inventory – manual of the German version. Weinheim, Germany: Beltz.
- Lee, J., Chung, D., Chang, S., Kim, S., Kim, S. W., Park, H., Ryu, S., & Jeong, J. (2012). Gender differences revealed in the right posterior temporal areas during Navon letter identification tasks. Brain Imaging and Behavior, 6(3), 387–396. https://doi.org/10.1007/s11682-012-9153-8
- Merritt, P., Hirshman, E., Wharton, W., Stangl, B., Devlin, J., & Lenz, A. (2007). Evidence for gender differences in visual selective attention. Personality and Individual Differences, 43(3), 597–609. https://doi.org/10.1016/j.paid.2007.01.016
- Merz, C. J., & Wolf, O. T. (2017). Sex differences in stress effects on emotional learning. Journal of Neuroscience Research, 95(1–2), 93–105. https://doi.org/10.1002/jnr.23811
- Miller, R., Plessow, F., Kirschbaum, C., & Stalder, T. (2013). Classification criteria for distinguishing cortisol responders from nonresponders to psychosocial stress: Evaluation of salivary cortisol pulse detection in panel designs. Psychosomatic Medicine, 75(9), 832–840. https://doi.org/10.1097/PSY.0000000000000002
- Nater, U. M., & Rohleder, N. (2009). Salivary alpha-amylase as a non-invasive biomarker for the sympathetic nervous system: Current state of research. Psychoneuroendocrinology, 34(4), 486–496. https://doi.org/10.1016/j.psyneuen.2009.01.014
- Navon, D. (1977). Forest before trees: The precedence of global features in visual perception. Cognitive Psychology, 9(3), 353–383. https://doi.org/10.1016/0010-0285(77)90012-3
- Navon, D. (2003). What does a compound letter tell the psychologist’s mind? Acta Psychologica, 114(3), 273–309. https://doi.org/10.1016/j.actpsy.2003.06.002
- Pelak, V. S. (2009). Visual disturbances in cortical degenerative disorders. Expert Review of Ophthalmology, 4(3), 283–297. https://doi.org/10.1586/eop.09.18
- Piepers, D. W., & Robbins, R. A. (2012). A review and clarification of the terms "holistic“, "configural," and "relational" in the face perception literature. Frontiers in Psychology, 3, 559. https://doi.org/10.3389/fpsyg.2012.00559
- Poirel, N., Pineau, A., & Mellet, E. (2008). What does the nature of the stimuli tell us about the global precedence effect? Acta Psychologica, 127(1), 1–11. https://doi.org/10.1016/j.actpsy.2006.12.001
- Primativo, S., & Arduino, L. S. (2023). Global and local processing of letters and faces: The role of visual focal attention. Brain Sciences, 13(3), 491. https://doi.org/10.3390/brainsci13030491
- Rezvani, Z., Katanforoush, A., & Pouretemad, H. (2020). Global precedence changes by environment: A systematic review and meta-analysis on effect of perceptual field variables on global-local visual processing. Attention, Perception & Psychophysics, 82(5), 2348–2359. https://doi.org/10.3758/s13414-020-01997-1
- Roozendaal, B., Okuda, S., de Quervain, D. J., & McGaugh, J. L. (2006). Glucocorticoids interact with emotion-induced noradrenergic activation in influencing different memory functions. Neuroscience, 138(3), 901–910. https://doi.org/10.1016/j.neuroscience.2005.07.049
- Russell, G., & Lightman, S. (2019). The human stress response. Nature Reviews. Endocrinology, 15(9), 525–534. https://doi.org/10.1038/s41574-019-0228-0
- Rüttgens, T., & Wolf, O. T. (2023). Enhanced memory for central visual and auditory elements experienced during a stressful episode. Behavioural Brain Research, 452, 114546. https://doi.org/10.1016/j.bbr.2023.114546
- Sänger, J., Bechtold, L., Schoofs, D., Blaszkewicz, M., & Wascher, E. (2014). The influence of acute stress on attention mechanisms and its electrophysiological correlates. Frontiers in Behavioral Neuroscience, 8, 353. https://doi.org/10.3389/fnbeh.2014.00353
- Shields, G. S., Sazma, M. A., & Yonelinas, A. P. (2016). The effects of acute stress on core executive functions: A meta-analysis and comparison with cortisol. Neuroscience and Biobehavioral Reviews, 68, 651–668. https://doi.org/10.1016/j.neubiorev.2016.06.038
- Schmitt, A., van Leeuwen, C., & Lachmann, T. (2017). Connections are not enough for membership: Letter/non-letter distinction persists through phonological association learning. Acta Psychologica, 176, 85–91. https://doi.org/10.1016/j.actpsy.2017.03.015
- Schwabe, L., Haddad, L., & Schachinger, H. (2008). HPA axis activation by a socially evaluated cold-pressor test. Psychoneuroendocrinology, 33(6), 890–895. https://doi.org/10.1016/j.psyneuen.2008.03.001
- Schwabe, L., & Schächinger, H. (2018). Ten years of research with the socially evaluated cold pressor test: Data from the past and guidelines for the future. Psychoneuroendocrinology, 92, 155–161. https://doi.org/10.1016/j.psyneuen.2018.03.010
- Schwabe, L., Hermans, E. J., Joëls, M., & Roozendaal, B. (2022). Mechanisms of memory under stress. Neuron, 110(9), 1450–1467. https://doi.org/10.1016/j.neuron.2022.02.020
- Skoluda, N., Strahler, J., Schlotz, W., Niederberger, L., Marques, S., Fischer, S., Thoma, M. V., Spoerri, C., Ehlert, U., & Nater, U. M. (2015). Intra-individual psychological and physiological responses to acute laboratory stressors of different intensity. Psychoneuroendocrinology, 51, 227–236. https://doi.org/10.1016/j.psyneuen.2014.10.002
- Thoma, M. V., Kirschbaum, C., Wolf, J. M., & Rohleder, N. (2012). Acute stress responses in salivary alpha-amylase predict increases of plasma norepinephrine. Biological Psychology, 91(3), 342–348. https://doi.org/10.1016/j.biopsycho.2012.07.008
- Weber, J., Angerer, P., & Apolinário-Hagen, J. (2022). Physiological reactions to acute stressors and subjective stress during daily life: A systematic review on ecological momentary assessment (EMA) studies. PLoS One, 17(7), e0271996. https://doi.org/10.1371/journal.pone.0271996
- Wiemers, U. S., Schoofs, D., & Wolf, O. T. (2013). A friendly version of the trier social stress test does not activate the HPA axis in healthy men and women. Stress (Amsterdam, Netherlands), 16(2), 254–260. https://doi.org/10.3109/10253890.2012.714427