 ?Mathematical formulae have been encoded as MathML and are displayed in this HTML version using MathJax in order to improve their display. Uncheck the box to turn MathJax off. This feature requires Javascript. Click on a formula to zoom.
1. Introduction
The heart is a specialized muscle acting as the body’s circulatory pump. The effectiveness of the pumping action is commonly assessed through different measurements; among the most important are the Pressure-Volume (PV) relationships, the elastance, and the contractility (Burkhoff et al. Citation2005). Here, we investigate the relationships between pressure, volume and contraction for both the Left Ventricle (LV) and the Left Atrium (LA), considered as a coupled system, by using a toy model to describe the geometry of the two chambers and the functioning of muscles. Our long–term goal is to upscale the mechanical model here proposed to a full, detailed 3D model capable of describing the heart function. The muscle modeling presented here is based on the notion of active contractions, that is, we put emphasis on kinematics – i.e. the generation of motion – rather than on dynamics – i.e. the production of forces (Nardinocchi & Teresi Citation2007). The same model used to reproduce the PV loop for a LV (Nardinocchi et al. Citation2011) is here extended to the pair LV-LA. We face the problem by looking at the pair LV-LA as an in-series mechanical system which is open along the part of the cardiac cycle in between the opening and the closure of the mitral valve, and closed otherwise.
2. Methods
The model in (Nardinocchi et al. Citation2011) represents a 0-D model, simple enough to enlighten the important features of the pumping function. We approximate the geometry of both LV and LA with spherical chambers; each chamber is characterized by an actual radius r and a slack radius , defined as the chamber radius at zero pressure; the effects of muscle contraction is accounted for by considering a varying slack radius, so as we can control independently from each other both the volume v and the pressure p of the chamber. By using the Laplace law we can relate the pressure p and the mean tension σ of the chamber walls. Eventually, one ends up with the following relation:
where represents the wall stiffness and
the active contraction, that is the cubic root of the ratio between the contracted volume and the slack volume of the chamber. For a fixed
, the above equation can be viewed as a function f relating pressure, volume and contraction:
Solving this equation with respect to ɛc gives the amount of contraction corresponding to the pair (p, v), where the wall stiffness acts as a parameter:
(1)
(1)
3. Results and discussion
By using the relation (1) it is possible to identify the contraction (ɛc)i associated to each chamber state identified by the pair (pi, vi) in the loop.
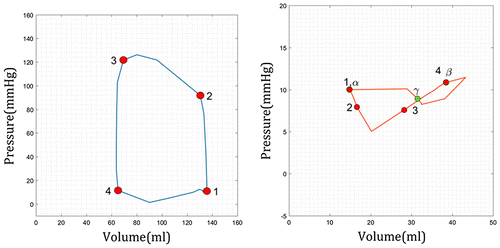
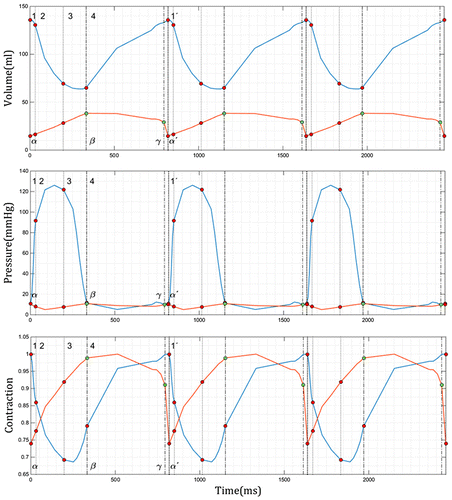
Fig. shows typical PV loops of LV and LA generated by experimentally measured PV pairs. The hemodynamic events occurring in the left heart during the cardiac cycle are shown in Fig. : the time course of pressure and volume, corresponding to the PV loops of Fig. , and the time course of muscle contraction as obtained by relation (1). The different phases of the cardiac cycle are highlighted by vertical lines. For the LV we have: (1) Mitral valve (MV) closes; (1–2) isovolumetric contraction; (2) Aortic valve (AV) opens; (2–3) ejection; (3) AV closes; (3–4) isovolumetric relaxation; (4) MV opens; (4–1) filling. For the LA we have: (α – β) reservoir; (β – γ) conduit; (γ – α) contraction.
Figure 1. Representative pressure-volume loop of human LV (blue, left) and LA (orange, right) in a healthy subject. The key points for LV are 1–4; for LA are , β, and
.

Figure 2. LV (blue) and LA (orange) time course of pressure (top), volume (middle), and contraction (bottom) for three cardiac cycles. Red and green points (LV and LA, respectively) and dotted lines refer to the main phases of the cardiac cycles. Labels were added only in the first cycle.

The most important function of LV is pumping, and the contractions of the thick muscle of the LV accomplishes the major part of the mechanical work of the system.
Meanwhile, LA has three different roles during the cardiac cycle which influence the whole cardiovascular performance: reservoir, conduit and contraction.
It is worth noting that active contraction of LA modulates both LV filling and LV stroke volume. This latter can be increased by ~15-30% in healthy individuals and even more in the presence of abnormal relaxation (Pagel et al. Citation2003, Shah & Lam Citation2015).
The LV is not contracted at end-diastole, when it is completely filled with blood at low pressure, point (1) of Fig. . The LV contraction starts after MV closes; LV keeps on contracting also after the opening of the AV, and reaches the maximum contraction
at the end of the ejection phase. The LA has its maximum contraction
at point (1); then it relaxes during the reservoir phase, until a no-contraction state at the beginning of the conduit phase
which occurs shortly after the MV opens. During the whole conduit phase, the LA contracts moderately, until a sudden, strong contraction just before the closure of the MV.
4. Conclusions
The pressure-volume analysis has been well established as a robust way to characterize the cardiac function, as it allows detailed, quantitative understanding of ventricular-atrial coupling and its response to complex load alterations. Nevertheless, the utility of these approaches in basic and clinical research is limited in explaining fundamental aspects of contraction.
The model can describe the time course of the muscle contraction in both LV and LA, thus quantifying the relation between the pressure, volume and contractile state of the chambers, providing important information beyond the common pressure and volume measurements. This approach can be used to describe the dynamic changes of the chambers in response to load alterations.
Acknowledgements
We thank Paolo Piras (La Sapienza University of Rome, Rome) for providing us with the PV data. L.T. acknowledges Italian Group of Mathematical Physics (GNFM-INdAM) for support.
References
- Burkhoff D, Mirsky I, Suga H. 2005. Assessment of systolic and diastolic ventricular properties via pressure–volume analysis: a guide for clinical, translational, and basic researchers. Am J Physiol Heart Circ Physiol. 289:H501–H512.
- Nardinocchi P, Teresi L. 2007. On the Active Response of Soft Living Tissues. J Elasticity. 88:27–39.
- Nardinocchi P, Teresi L, Varano V. 2011. A simplified mechanical modeling for myocardial contractions and the ventricular pressure volume relationships. Mech Res Commun. 38:532–535.
- Pagel PS, Kehl F, Gare M, Hettrick DA, Kersten JR, Warltier DC. 2003. Mechanical function of the left atrium: new insights based on analysis of echocardiography. Anesthesiology. 98(4):975–994.
- Shah AM, Lam CS. 2015. Function over form? Assessing the left atrium in heart failure. Eur Heart J. 36(12):711–714.
