
 ?Mathematical formulae have been encoded as MathML and are displayed in this HTML version using MathJax in order to improve their display. Uncheck the box to turn MathJax off. This feature requires Javascript. Click on a formula to zoom.
Abstract
Oral cancer surgery has a negative influence on the quality of life (QOL). As a result of the complex physiology involved in oral functions, estimation of surgical effects on functionality remains difficult. We present a user-friendly biomechanical simulation of tongue surgery, including closure with suturing and scar formation, followed by an automated adaptation of a finite element (FE) model to the shape of the tongue. Different configurations of our FE model were evaluated and compared to a well-established FE model. We showed that the post-operative impairment as predicted by our model was qualitatively comparable to a patient case for five different tongue maneuvers.
Introduction
Head and neck cancer is the sixth most common cancer in the world (Warnakulasuriya Citation2009) and the worldwide incidence of lip and oral-cavity cancers is estimated at 2.1% (Gupta et al. Citation2016). In Western countries, oral cancers most frequently occur at the lateral border of the tongue, accounting for 40-50% of all the oral cancers (Moore et al. Citation2000; Warnakulasuriya Citation2009). Dependent on the local extension of the tongue cancer, surgery might interfere with vital functions such as swallowing, mastication and speech having a negative influence on the Quality of Life (QoL) (Costa Bandeira et al. Citation2008; Van Der Molen et al. Citation2009). When the lesion is accessible trans-orally, curative surgery is often the preferred treatment, provided that the post-operative functional loss is acceptable. If not, organ-sparing treatment options such as radiotherapy or combined chemotherapy and radiotherapy can be considered (Sessions et al. Citation2002; Shah and Gil Citation2009). In considering these options, shared decision making and evidence-based patient counseling are important. This requires objective and accurate pre-operative information regarding the oncologic and functional outcome, and information provision in an understandable and preferably visual way (Yudkin et al. Citation2016; Braillon Citation2017). However, due to the complex structures and systems involved in oral functions, it is often not possible for a treating physician to predict the functional consequences of any particular treatment by experience and reasoning alone (Kreeft et al. Citation2009). Simulations using physiological computer models can help the treating physician to understand the effects of interventions in the tongue and to provide the patient with visual information to understand the functional consequences. In the past decade, progresses have been made in biomechanical modeling of the tongue: In 2006, Gérard et al. (Citation2006) created a Finite Element (FE) model based on (1) MRI data from a specific human subject; (2) accurate information about muscle anatomy from the Visible Human Project (NIH 2007), and (3) the work of Wilhelms-Tricarico (Citation2000) for speech production modeling. Vogt et al. (Citation2006) and Buchaillard et al. (Citation2007; Citation2009) elaborated on this model to show the opportunities for the simulation of speech production, and also the simulation of surgery and reconstruction using a free flap approach. Hermant et al. (Citation2017) adapted and improved this model through the work of Rohan et al. (Citation2017) in creating a tongue model based on a manual segmentation of MRI and CT images. Fujita et al. (Citation2007) created a personalized tongue model specifically for the simulation of a partial glossectomy. Van Alphen et al. (Citation2013) created an FE model to show the effects of impairments on the movement of the tongue. These previous studies yielded promising results for use of FE models to predict the functional loss. In several of those studies, surgery was simulated by altering the stiffness of particular elements. However, this approach is not sufficient to simulate primary closure using sutures, which is the most commonly applied technique in stage T1-T2 tumors (Kreeft et al. Citation2009).
Our aim was to develop a user-friendly tool to simulate the effects of a partial resection of the tongue using an FE model. In this study we address five questions: (a) Can we create an interactive and editable model while still performing comparably to other models? (b) Can we simulate and define a resection in the FE model? (c) Can we simulate primary closure of a resection by suturing? (d) Can we simulate scar tissue by a fibrotic volume? and (e) Can we simulate a patient case using this model?
Methods and materials
Materials
The shape and muscle structure of our tongue model were based on the FE model developed by Buchaillard et al. (Citation2009), which originates from the models of Gérard et al. (Citation2003 - 2006). Their model was converted by Stavness et al. (Citation2012) to work in ArtiSynth, an open-source Java-based platform for combined multibody and FE model simulation (Lloyd et al. Citation2012). This software also includes an inverse simulation controller as described in Stavness et al. (Citation2012). Our surgery tool was also created within the ArtiSynth environment while MeshLab was used for manually editing a mesh (Cignoni et al. Citation2008).
To demonstrate the abilities of the tool, the position of the apex of the tongue of a patient with a T1 (i.e. diameter < 2 cm) tongue cancer has been recorded both pre- and post-operatively using three Aviator A1000-100gc (Basler) video cameras.
The model
The biomechanics of a tongue were simulated using a 3 D FE model. Using a least square subdivision surface algorithm from Boyé et al. (Citation2010), a smoothed version of the surface mesh from the FE model of Buchaillard et al. (Citation2009) was created in MeshLab (Cignoni et al. Citation2008). An FE mesh consisting solely of cubic elements was generated to match the shape of the surface mesh so that the centroids of the elements were located within the surface mesh (). For visualization of the modeled dynamics, the high-resolution surface mesh was embedded into the cubic FE mesh (). Attachments to the jaw and hyoid bone were simulated by making the FE nodes in these areas non-dynamic.
Figure 1. (a) The surface mesh of the model. (b) The cubic-shaped FE model. The white dots are the non-dynamic nodes representing the attachment to the jaw.
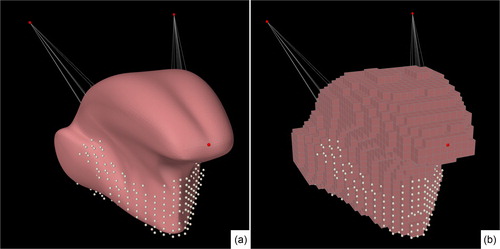
This simplified representation enables quick generation of a new FE mesh when changes to the surface mesh are made. Quick generation is essential for surgical simulation (see section “Virtual surgery”), which is done at least two times during the procedure. Moreover, this technique enables us to easily generate new FE meshes for other (personalized) surface meshes in the future.
A small element size leads to a better representation of the model and the surgical incision, at the cost of longer computation time. The smallest element size with acceptable computation time was 16 mm3. This size was used in all the simulations. We also investigated the effect on mobility when increasing the element size to 39 mm3 and 141 mm3.
Mechanical properties
In order to compare our new editable model to the model of Buchaillard et al. (Citation2009) and Stavness et al. (Citation2012), we used the same mechanical properties. In these studies, the complex viscoelastic nature of tongue tissue was approached by a hyperelastic material. Element-based incompressibility ensures that the volume in each element stays the same throughout the simulation (Lloyd Citation2014). The material consisted of a 5-parameter Moony Rivlin material with c10 and c20 equal to 1037 and 486, respectively, and with c01, c11, and c02 all being zero. A Rayleigh damping coefficients of α = 40 s−1 and β = 0.03 and a density of 1040 kg/m3 were used. These parameters are based on ex-vivo research conducted by Gerard et al. (Citation2005) and were later fine-tuned by Buchaillard et al. (Citation2009). An overview of other constitutive models to estimate the mechanical properties of the tongue can be found in Hermant et al. (Citation2017).
Muscle properties and implementation
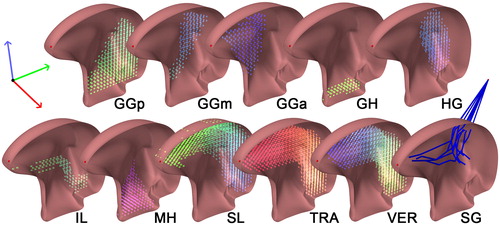
The musculature was modeled using ArtiSynth’s "muscle material" which effect is applied in addition to the regular material for an element. When excitation is applied to a muscle material, it generates an externally applied stress in the direction associated with the muscle (Lloyd et al. Citation2012). For the simulation of the muscle stress-strain function, we used ArtiSynth’s implementation of the method described by Blemker et al. (Citation2005). In this method, stress and strain are influenced by muscle activation based on the direction of the particular muscle. In order to compare our model to the Buchaillard et al. (Citation2009) model, muscle divisions and muscle directions were converted and incorporated in our model. Using the Inverse Distance Weighted (IDW) interpolation, the string-based muscles of Buchaillard et al. (Citation2009) were converted into dense vector fields defining muscle directions and locations. The vector closest to the centroid of a particular element will determine the direction of its contraction upon activation. A typical distribution of element-muscles in an unedited model is demonstrated in . This muscle representation also enables us to easily use other muscle configurations for future (personalized) models. Because of the long and compact trajectory of the styloglossus muscle towards the styloid process, we were unable to create a stable (automatically generated) element-based muscle for it. The styloglossus was, therefore, the only muscle simulated using string-based muscles.
Figure 2. Muscle bundles and directions. Every color-coded cylinder, located at the centroid of an element, represents the direction of contraction of that element. From left to right: genioglossus, -posterior (GGp), -middle (GGm), -anterior (GGa), geniohyoid muscle (GH), hyoglossus (HG), inferior longitudinal muscle (IL), mylohyoid muscle (MH), superior longitudinal muscle (SL), transverse muscle (TRA), vertical muscle (VER). The styloglossus (SG) is modeled as a fiber.
Virtual surgery
In the next paragraphs, a method is described to interactively create a post-surgical model. This method consists of three main steps:
Interactively defining a resection volume: The volume to be resected was delineated on the surface mesh of a tongue and subsequently subtracted from that mesh.
Virtual suturing: The remaining surface mesh and muscle vector fields were embedded in a cubic FE mesh that was generated to match the shape of the surface mesh. During the suturing procedure, the FE mesh facilitated the deformation of the surface mesh and the embedded muscle vector fields.
Post-operative model: The hole in the deformed surface mesh was closed and the new FE mesh was generated. The muscle vector fields were converted to element-muscles.
Interactively defining a resection volume
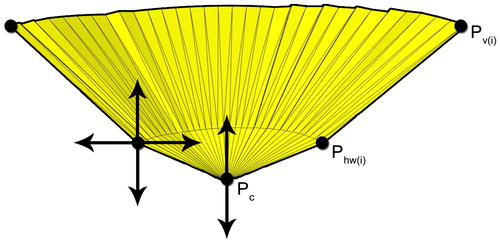
The location of the surgical resection was delineated interactively by selecting a set of 3 D points ( on the surface mesh. Using the chain of 3 D points, two polygonal cones covering the area above and below these points were defined to form a closed 3 D structure (). Subsequently, all the faces enclosed by this structure were marked as “selected area”. This method performed well for selecting the area’s convex and concave surfaces, which are present on the tongue surface mesh.
Figure 3. A structure created to enclose a three-dimensional selected area. and
together with the upper centroid (
) and the lower centroid (
not visible) form a structure that will cover all the faces from the surface mesh (yellow) within this structure.
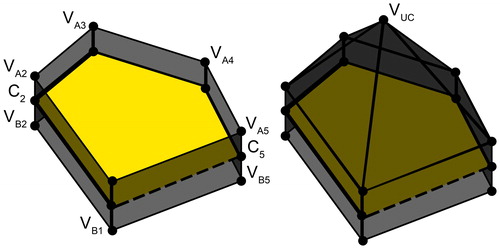
Next, the final shape of the resection volume was derived from the selected area. This was achieved by creating a new cone-like shape, the base of which was formed by connecting the vertices at the border of the selected area (). The apex
was located below, in the center, and orthogonal to the mean of all the faces of the selected area (). To enable more complex resection shapes, the connecting edge between the area vertices
and the apex
was separated into two parts by inserting halfway vertices
The resulting mesh could be adjusted interactively to the desired incision shape by (a) changing the depth of the apex in a direction orthogonal to the selected area; (b) scaling the halfway vertices in a direction parallel to the selected area, and (c) changing the depth of this plane. By applying this method, both elongated and round resection volumes could be created.
Figure 4. A visual representation of the selected resection volume. The yellow volume is the volume that is about to be removed. The red line indicates over which line the future resection will be closed.
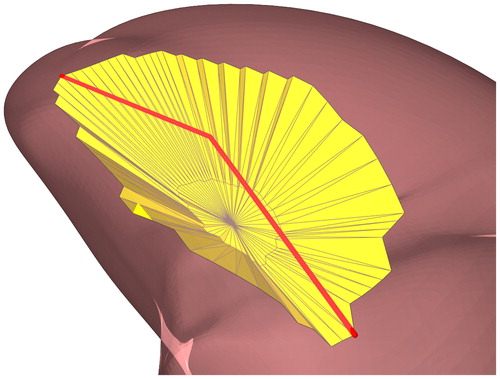
Figure 5. A schematic cross-section of the resection volume. can be moved in the direction of, and perpendicular to the normal of all the selected faces.
can only be moved in the direction of the normal.
Virtual suturing
After subtracting the created resection volume from the surface mesh, the cubic FE model was generated according to this new surface mesh shape, as described in the Materials section under the heading ‘The model’. Vector fields containing muscle locations and directions were added to the FE model, but not in the resected area. These vector fields were only converted to element-muscles until after the suturing procedure.
Next, the resection was closed. This was divided into two stages. In the first stage, suturing was simulated in a similar way to clinical intraoperative conditions. This was accomplished by pulling the longest edges of the resection volume towards each other using point forces located at the vertices on the edge ( and halfway between the edge and bottom
of the resection (marked by green and red arrows respectively in ).
Figure 6. A visual representation of the suturing procedure using the surgical tool. (a–b): The red and green point forces (arrows) will move to their targets points (bullets) on an invisible plane located on the longest axial direction of the resection. (c): The pairs of points on the edges that were closest to each other were bounded by a virtual knot. (d): Post-operative mesh using a new generated FE mesh. The lighter area is marked as fibrosis in this particular case.
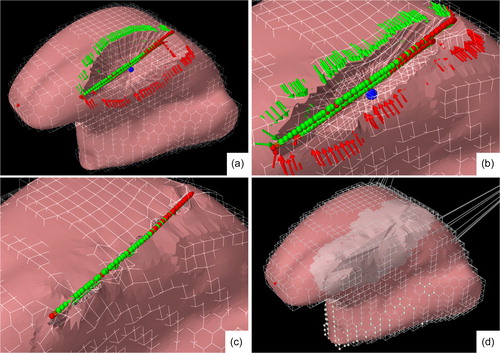
To create balanced forces on the opposite sides of the longest edge, a virtual plane was created at the longest axial direction of the resection. For each point force, a target was created that was the projection of the point force on the plane (marked by green and red dots in ). This target was then corrected for the length of the resection’s wall and the location of the nearest target points from the opposite side of the resection, to ensure a smooth post-operative surface. Subsequently, a simulation was run wherein the point forces move towards their targets while applying a manually adjustable force. In addition, these forces were lowered exponentially with each iteration as they reached their target to prevent the point forces from overshooting their target. During the approach of both sides of the embedded surface mesh, the FE mesh does not self-collide, as only the surface mesh can collide ().
To ensure that the edges on both sides of the resection were fully aligned, the pairs of points on the edges that were closest to each other were bounded by a virtual knot. By running a simulation for a couple of seconds without any forces other than gravity, the tongue tissue moved to an equilibrium state (). Using MeshLab (Cignoni et al. Citation2008), the remaining hole in the mesh was closed. At this point, the FE mesh was discarded.
Post-operative model
The suturing procedure altered the shape of the surface mesh and muscle vector field. Based on this surface mesh, a new FE model was generated. Muscle-elements were created from the altered vector fields, and using the information about the location of the resection, fibrosis (scar tissue) was added to the model (). Not much is known about the extent of fibrosis and the associated changes of the tissue properties. We will evaluate the effects of a small and large fibrotic area of 7 and 14 mm, respectively, from the location of the resection. In Buchaillard et al. (Citation2007) a stiffened free flap reconstruction was simulated by using 6 times the original stiffness. We compared the effects of 6, 12 and 24 times the initial stiffness on tongue motions.
Evaluation
Comparison with the original model
In order to compare our model to the model of Buchaillard et al. (Citation2009), we estimated the activity of each muscle from their model by means of an inverse simulation technique. Every single (bilateral) muscle of the Buchaillard et al. (Citation2009) model was activated to 50% of its maximum force or just before the model became unstable. Via the inverse simulation, the tongue tip of our model aimed to reach the same point as the tongue tip of the Buchaillard et al. (Citation2009) model, using the same muscle. As the vertical and transverse muscles mainly control the width of the tongue (in the coronal plane), the inverse simulation for those muscles will be done with 2 points on both sides of the tongue instead of the tongue tip.
Evaluation of various element sizes
The number of the cubic elements that can be used for the FE model is limited by computational power and time. The smaller the elements, the better the representation of the surface. However, the more elements, then the longer computation time. We will compare models with element sizes 16 mm3, 39 mm3, and 141 mm3 by activating every muscle bilaterally. Element sizes larger than 141 mm3 are too large to follow the shape of the tongue and element sizes smaller than 16 mm3 will take longer than 50 seconds for 1 second of simulation on an Intel Xeon V5 @ 3.50 GHz. Therefore, an element size of 16mm3 is, the smallest size we will use.
Patient case
To demonstrate the capability of our model to mimic the effects of surgery on tongue mobility, videos of a patient with a T1 tongue carcinoma scheduled for glossectomy were captured both pre- and post-operatively, performing the following characteristic protruding tongue movements:
forward.
Up and downward.
Lateralisation (left and rightward).
To determine the muscle activation signals, the measured pre-operative extreme positions were used for the inverse simulation. The tongue tip of the pre-operative model was targeted to set a path towards these positions, resulting in the corresponding muscle activations. This muscle activation pattern was used in the post-operative forward simulation using various levels of stiffness and fibrosis volumes.
The maximum distance of the tongue tip of the model was measured in the pre-determined directions. Because no post-operative MRI data of the patient was available, no comparison between pre-and post-operative shapes was possible. Therefore, the resulting shapes are only assessed qualitatively by comparing them to stills of the pre- and post-operative video of the patient. The frames were scaled by calibrating the width of the nostrils of the pre- and post-operative image.
Results
Comparison with the original model
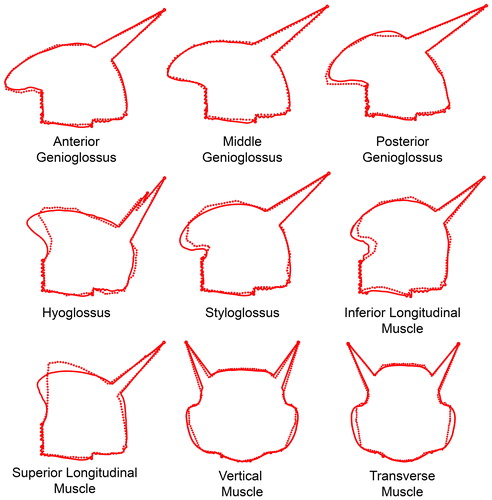
shows the deformation of the Buchaillard et al. (Citation2009) model after activation of a single muscle and the results of inverse simulations using our model targeting at the tip or the sides of the Buchaillard et al. (Citation2009) model. Activation of the mylohyoid or geniohyoid muscle did not change the shape of the tongue in a noticeable way and was therefore left out of this comparison. Most of the deformations of the two models were almost indistinguishable from one another, except for the hyoglossus and the superior longitudinal muscle that could not move the tongue apex of our model to the same position of Buchaillard’s model (Buchaillard et al. Citation2009).
Figure 7. Sagittal or coronal delineated view of the Buchaillard (Citation2009) model (dotted lines) for each activated muscle and our model (solid line) reaching the same point with the tip (sagittal view) or the sides (coronal view) using inverse modeling.
Evaluation of various element sizes
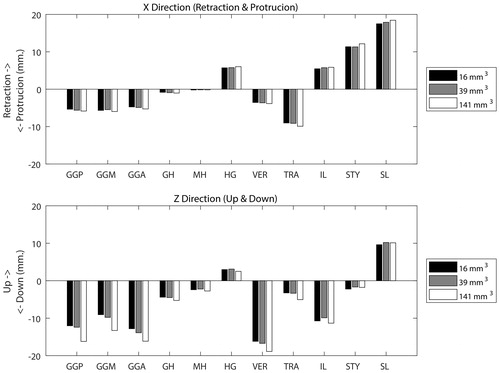
shows the movement of the apex in two directions after activation of the muscle. The maximum difference between 16 mm3 and 39 mm3 elements was maximally 1 mm, however, the model with larger elements showed movements up to 4 mm. This movement was mainly in the direction of gravity (downwards).
Figure 8. Upper graph: The positive and negative X-axis represents a displacement of the tip of the tongue in a forward protruding and retracting movement of the tongue, respectively, using elements of 16, 39 and 141 mm3. Lower graph: The positive and negative Z-axis represents a displacement in respectively the up and down direction.
Patient case
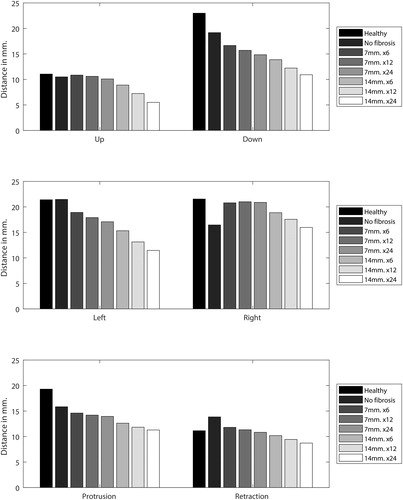
shows the drawing of the plan made by a surgeon, the selection made using the surgery tool, and the resulting post-operative model. The grey area represents the extension of fibrosis. The numerical results of the forward simulations are given in . The most prevalent effect was the decline in motion in all directions when the stiffness and diameter of the fibrotic area of the post-operative tongue were increased. However, the non-fibrotic version of the model showed a different behavior as the ability to retract increased after surgery. Another interesting phenomenon can be seen in the left and rightward protrusion. Without fibrosis, the post-operative tongue could not move as far to the right as it did to the left, as muscles in this patient were removed from the right side of the tongue. However, when fibrosis was added, the opposite occurred. Further stiffening of the resection volume only affected the motion to the left, but when the size of the fibrotic area was increased both sides became affected. The right and upward protrusion were hardly affected by fibrosis of 7 mm while that of 14 mm did have a significant effect. The largest decrease in motion, compared to the healthy tongue, was visible in the left and downward protrusion.
Figure 9. From top to bottom: preoperative drawing of the surgical area, selected resection volume on the preoperative model and the post-operative model. The grey area on the post-operative model is the visual representation of scar tissue.
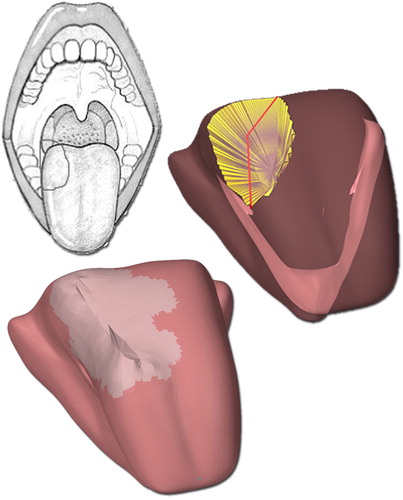
Figure 10. The traveled distance in millimeter of different versions of the model while performing six different movements. The first part of the graph labels indicates the extension of fibrosis (7 or 14 mm.) and the second part indicated a multiplication factor for the amount of stiffness compared to the “healthy tongue” (6,12 and 24 times the normal stiffness).
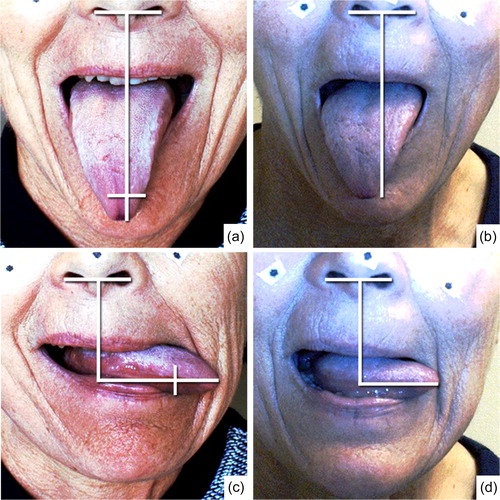
In , the pre- and post-operative differences of the patient are shown while protruding the tongue to the left or down. The post-operative tongue tip positions, projected on the pre-operative image, are indicated by the two small perpendicular lines. Both maneuvers are impaired and showed a significant decrease in motion of about 30%. No noticeable differences were found in up, right or forward protrusion and therefore not shown in the Figure. Both the biomechanical model and the patient revealed that the effect of surgery was most distinct in the left (contralateral) and downward protrusion.
Figure 11. Left: preoperative video stills from down and leftward protrusion of the tongue. The horizontal white line represents the magnitude of motion of the tongue in a certain direction seen from the nostrils. An extra vertical line on top of the horizontal line projects the post-operative magnitude of motion on the preoperative video stills. Right: Post-operative video stills. The video stills are printed with written permission of the patient.
Discussion and conclusion
In this study, a method to perform virtual surgery on a biomechanical tongue is presented. A user-friendly tool was created to delineate and shape a resection volume. The virtual resection, suturing of the resection, and formation of scar tissue was accomplished through biomechanical modeling. The evaluation showed that the movements of the model were comparable with the model of Buchaillard et al. (Citation2009) and that those movements were not significantly altered within a reasonable range when a different element size was chosen. Application of the tool to a single patient case, in which post-surgical movement of the patient’s tongue could be simulated, gave a proof of concept, demonstrating the potential of the tool.
The model
The surface mesh of the model is a smoothed version of the Buchaillard et al. (Citation2009) model, which neither uses an unedited segmented tongue nor uses personalized muscle locations of the tongue (Gérard et al. Citation2003). As demonstrated in this paper, this was sufficient to predict the overall effect of surgery at a certain location. However, for quantifying motion impairment and effective validation, a truly personalized model is required. The tongue mesh and muscle bundles must be shaped to the patient’s tongue by using, for instance, MRI data. Techniques such as Diffusion Tensor Imaging (DTI) can be used to image and subsequently personalize the neural and muscular structures (Gilbert et al. Citation2006; Gaige et al. Citation2007).
In literature, there is still a debate on how to simulate the functional muscular subdivision. Some FE models described in literature divide the genioglossus in the anterior, middle and posterior part (Harandi et al. Citation2014; Wu et al. Citation2014; Dabbaghchian et al. Citation2016; Hermant et al. Citation2017), while other literature shows that there are also arguments to separate the genioglossus into a horizontal and oblique subdivision (Mu and Sanders Citation2010; Honda et al. Citation2013; Sanders and Mu Citation2013). There are also arguments to subdivide the intrinsic muscles into multiple functional regions. For validating our new way of generating an FE model, to enable virtual surgery, it was necessary to use the same muscle divisions as in Buchaillard et al. (Citation2009). In addition, Van Alphen et al. (Citation2017) showed that the tongue muscle innervation patterns can differ greatly among subjects, which makes it difficult to ascertain that specific muscles are denervated by surgical procedures. However, from our longstanding clinical experience and other clinical research, we can conclude that gross tongue movements after a partial glossectomy are usually affected by fibrosis rather than by denervation (Speksnijder et al. Citation2011). Moreover, denervation at a local site seems effectively compensated at a central cerebral level (Mosier et al. Citation2005).
This report describes a first use of a separate surface mesh and FE model to simulate surgical excision and closure of soft tissue. The separation made it possible to easily edit detailed parts of the tongue and actually remove a part from the model. This, in turn, enabled us to create virtual sutures to close the resection, which would be impossible using the low-resolution handmade models. (Buchaillard et al. Citation2007; Fujita et al. Citation2007; Van Alphen et al. Citation2013). shows that the post-operative tongue contour accurately mimicked the in-vivo post-operative situation after primary suturing of the tongue.
However, the described modeling technique has its flaws. The FE mesh is solely made of cubic shaped hexahedral elements () because tetrahedral elements are more prone to “volumetric locking”. An FE model with cubically shaped elements will not deform in the same way as an FE model with a smoother surface. For example, large deformations close to the jaw and hyoid bone attachments can result in a corrugated surface mesh. Also, sharp edges at the corners of a resection are not always well defined. It is arduous to automatically generate a hexahedral model that follows the surface with non-cubic elements, and therefore some have suggested a mixed-mesh approach. In Rohan et al. (Citation2017) this mixed mesh approach gave promising results as the use of tetrahedral elements located only on the surface of the FE did not alter the deformation of a tongue model in a serious way. Although not yet suited for our editable FE mesh approach, industrial solutions like “Bolt” (Csimsoft Citation2018) could be used to create more detailed hexahedral models as was done in Hermant et al. (Citation2017).
The hyperelastic material properties used in our simulations are a rough approximation from reality. Recent research is focused on creating constitutive laws to describe the viscoelastic behavior of (tongue) tissue (Yousefi et al. Citation2018). These new insights, provided they don’t significantly increase computational time, could improve the simulated tissue response in the model in the future.
Evaluation
The comparison of our model to the model of Buchaillard et al. (Citation2009) showed that, despite the coarse and substantially different FE Mesh, both models deformed in an almost identical way (). However, the upward movement when activating the hyoglossus and superior longitudinal muscle was reduced in comparison to the Buchaillard et al. (Citation2009) model. One explanation was that, because of the cubic shaped elements, some FE nodes at the surface were only connected to one element. The movement induced in those elements did not entirely contribute to the movement of the tongue. Another explanation was that not all the jaw attachments were located at the same positions as a result of the coarse FE mesh.
The comparison between the model with 16 mm3 and 39 mm3 elements showed hardly any difference in movement between the two (). With the elements larger than 141 mm3 it becomes harder to create a shape resembling the surface mesh, but even with this size the simulation still showed comparable movements upon muscle activation. Therefore, we can conclude that the size of the elements, within reasonable limits, does not affect the simulations at this stage of development, but that a small element size is always preferred since they result in more detailed shapes.
The patient case demonstrated that the surgery tool is a good starting point in creating a usable post-operative model to predict surgical impairment. It also showed the importance of choosing the right location and the right amount of stiffness. The extension of fibrosis to 14 mm caused the stiffened area to expand across the midline of the tongue and resulted in more impaired movement when protruding in the up and rightward direction (). In the non-realistic case without fibrosis, the left-right difference is caused solely by the deformed model and removed muscle parts. By increasing the stiffness of fibrosis the left-right difference is reversed. This contralateral motion impairment was clearly simulated in our model and was comparable to our patient and patients of a study performed by van Dijk et al. (Citation2016). This underlines the importance of better in-vivo research on tissue properties, fibrosis, and muscle morphology.
The qualitative comparison showed promising results regarding this technique and therefore a quantitative validation is desired. Therefore, we started developing a new protocol, comparable to the one of van Dijk et al. (Citation2016), to track the patient’s tongue motion pre- and post-operatively. When the model has proven to be a good predictor of post-treatment functionality also other applications than patient counseling could be considered. In the field of speech and swallowing rehabilitation, for example, the personalized post-operative model can be used to point out alternative muscle sets to compensate for the loss of other muscles via inverse modeling. The speech therapist can use the model to determine which muscles to train in order to maximize the effect of training. Also, once we have achieved an acceptable implementation of fibrosis in the model, various ways of wound closure and their influences on the post-operative motion can be analyzed in the process of clinical decision making. We believe that these simulations will eventually provide a strong support for the patient and the treating physicians in both shared decision-making and rehabilitation of the patient.
Geolocation information
52,3493887, 4,8263059
Online media
Disclosure statement
No potential conflict of interest is reported by the authors.
Additional information
Funding
References
- Van Alphen MJA, Kreeft AM, Van Der Heijden F, Smeele LE, Balm A. 2013. Towards virtual surgery in oral cancer to predict postoperative oral functions preoperatively. Br J Oral Maxillofac. Surg. 51(8):747–751.
- Blemker SS, Pinsky PM, Delp SL. 2005. A 3D model of muscle reveals the causes of nonuniform strains in the biceps brachii. J Biomech. 38(4):657–665.
- Boyé S, Guennebaud G, Schlick C. 2010. Least squares subdivision surfaces. Comput Graph Forum. 29(7):2011–2290.
- Braillon A. 2017. Independence is critical for shared decision making. BMJ. 358: j3286.
- Buchaillard S, Brix M, Perrier P, Payan Y. 2007. Simulations of the consequences of tongue surgery on tongue mobility: Implications for speech production in post-surgery conditions. Int J Med Robotics Comput Assist Surg. 3(3):252–261.
- Buchaillard S, Perrier P, Payan Y. 2009. A biomechanical model of cardinal vowel production: muscle activations and the impact of gravity on tongue positioning. J Acoust Soc Am. 126(4):2033–2051.
- Cignoni P, Cignoni P, Callieri M, Callieri M, Corsini M, Corsini M, Dellepiane M, Dellepiane M, Ganovelli F, Ganovelli F, et al. 2008. MeshLab: An open-source mesh processing tool. Sixth Eurographics Ital. Chapter Conf. 129–136.
- Costa Bandeira AK, Azevedo EHM, Vartanian JG, Nishimoto IN, Kowalski LP, Carrara-De Angelis E. 2008. Quality of life related to swallowing after tongue cancer treatment. Dysphagia. 23(2):183–192.
- Csimsoft [accessed 2018 Jul 3]. http://www.csimsoft.com/boltoverview
- Dabbaghchian S, Arnela M, Engwall O, Guasch O, Stavness I, Badin P, Grup GTM, Mèdia T, Salle L, Llull UR, et al. 2016. Using a biomechanical model and articulatory data for the numerical production of vowels. DiVA. 3569–3573.
- van Dijk S, van Alphen MJA, Jacobi I, Smeele LE, van der Heijden F, Balm A. 2016. A new accurate 3d measurement tool to assess the range of motion of the tongue in oral cancer patients: A standardized model. Dysphagia. 31(1):97–103.
- Fujita S, Dang J, Suzuki N, Honda K. 2007. A Computational tongue model and its clinical application. Oral Sci. Int. 4(2):97–109.
- Gaige, Terry A., Thomas Benner, Ruopeng Wang, Van J. Wedeen, and Richard J. Gilbert. 2007. “Three Dimensional Myoarchitecture of the Human Tongue Determined in Vivo by Diffusion Tensor Imaging with Tractography.” Journal of Magnetic Resonance Imaging 26(3):654–61.
- Gérard J-M, Perrier P, Payan Y. 2006. 3D biomechanical tongue modeling to study speech production. Speech Prod. Model. Phonetic Process. Tech. 85–102.
- Gérard J-M, Wilhelms-Tricarico R, Perrier P, Payan Y. 2003. A 3D dynamical biomechanical tongue model to study speech motor control. Res Dev Biomech. 1:49–64.
- Gerard JM, Ohayon J, Luboz V, Perrier P, Payan Y. 2005. Non-linear elastic properties of the lingual and facial tissues assessed by indentation technique. Application to the biomechanics of speech production. Med Eng Phys. 27(10):884–892.
- Gilbert, Richard J. et al. 2006. “Three-Dimensional Myoarchitecture of the Bovine Tongue Demonstrated by Diffusion Spectrum Magnetic Resonance Imaging with Tractography.” Anatomical Record - Part A Discoveries in Molecular, Cellular, and Evolutionary Biology 288(11):1173–82.
- Gupta N, Gupta R, Acharya AK, Patthi B, Goud V, Reddy S, Garg A, Singla A. 2016. Changing Trends in oral cancer - a global scenario. Nepal J Epidemiol. 6(4):613–619.
- Harandi NM, Woo J, Stone M, Abugharbieh R, Fels S. 2014. Subject-specific biomechanical modelling of the tongue: Analysis of muscle activations during speech. Proc Int Semin Speech Prod. 174–177.
- Hermant N, Perrier P, Payan Y. 2017. Human tongue biomechanical modeling. In Payan Y, Ohayon JBT-B of LO, editors. Biomechanics of living organs series. Oxford: Academic Press; 395–411.
- Honda K, Murano EZE, Takano S, Masaki S, Dang J. 2013. Anatomical considerations on the extrinsic tongue muscles for articulatory modeling. Proc Meet Acoust. 19:60270.
- Kreeft AM, van der Molen L, Hilgers FJ, Balm AJ. 2009. Speech and swallowing after surgical treatment of advanced oral and oropharyngeal carcinoma: A systematic review of the literature. Eur Arch Otorhinolaryngol. 266(11):1687–1698.
- Kreeft AM, Tan IB, Van Den Brekel MWM, Hilgers FJ, Balm A. J. 2009. The surgical dilemma of “functional inoperability” in oral and oropharyngeal cancer: Current consensus on operability with regard to functional results. Clin. Otolaryngol. 34(2):140–146.
- Lloyd JE. 2014. ArtiSynth Reference Manual. [accessed 2018 Jun 5]. https://www.artisynth.org/Documentation/ArtisynthRefManual
- Lloyd JE, Stavness I, Fels S. 2012. ArtiSynth: A fast interactive biomechanical modeling toolkit combining multibody and finite element simulation. In Payan Y. editor. Soft tissue biomechanical modeling for computer assisted surgery. Springer; 355–394.
- Van Der Molen L, Van Rossum MA, Burkhead LM, Smeele LE, Hilgers F. 2009. Functional outcomes and rehabilitation strategies in patients treated with chemoradiotherapy for advanced head and neck cancer: A systematic review. Eur Arch Otorhinolaryngol. 266(6):889–900.
- Moore SR, Johnson NW, Pierce A. M, Wilson DF. 2000. The epidemiology of mouth cancer: a review of global incidence. Oral Dis. 6(2):65–74.
- Mosier K, Liu WC, Behin B, Lee C, Baredes S. 2005. Cortical adaptation following partial glossectomy with primary closure: Implications for reconstruction of the oral tongue. Ann Otol Rhinol Laryngol. 114(9):681–687.
- Mu L, Sanders I. 2010. Human tongue neuroanatomy: Nerve supply and motor endplates. Clin Anat. 23(7):777–791.
- NIH 2007. NLM’s Current Bibliographies in Medicine, Visible Human Project®. [accessed 2018 Jul 3]. http://www.nlm.nih.gov/archive/20120907/pubs/cbm/visible_human_2007.html
- Rohan P-Y, Lobos C, Nazari M. A, Perrier P, Payan Y. 2017. Finite element models of the human tongue: A mixed-element mesh approach. Comput Methods Biomech Biomed Eng Imaging Vis. 5(6): 390–400.
- Sanders I, Mu L. 2013. A three-dimensional atlas of human tongue muscles. Anat Rec (Hoboken). 296(7):1102–1114.
- Sessions DG, Spector GJ, Lenox J, Haughey B, Chao C, Marks J. 2002. Analysis of treatment results for oral tongue cancer. The Laryngoscope. 112(4): 616–625.
- Shah J, Gil Z. 2009. Current concepts in management of oral cancer-surgery. Oral Oncol. 45(4–5):394–401.
- Speksnijder CM, Van Der Bilt A, Van Der Glas HW, Koole R, Merkx M. 2011. Tongue function in patients treated for malignancies in tongue and/or floor of mouth; A one year prospective study. Int J Oral Maxillofac Surg. 40(12):1388–1394.
- Stavness I, Lloyd JE, Fels S. 2012. Automatic prediction of tongue muscle activations using a finite element model. J Biomech. 45(16):2841–2848.
- Van Alphen, M. J. A., M. Eskes, L. E. Smeele, A. J. M. Balm, and F. van der Heijden. 2017. “In Vivo Intraoperative Hypoglossal Nerve Stimulation for Quantitative Tongue Motion Analysis.” Computer Methods in Biomechanics and Biomedical Engineering: Imaging & Visualization 5(6):409–15.
- Vogt F, Lloyd J, Buchaillard S, Perrier P, Chabanas M, Payan Y, Fels S. 2006. Efficient 3D finite element modeling of a muscle-activated tongue. Lecture Notes in Computer Science. 19–28.
- Warnakulasuriya S. 2009. Global epidemiology of oral and oropharyngeal cancer. Oral Oncol. 45(4-5):309–316.
- Wilhelms-Tricarico R. 2000. Development of a tongue and mouth floor model for normalization and biomechanical modelling,” in Proceedings of the Fifth Speech Production Seminar and CREST Workshop on Models of Speech Production. Kloster Seeon, Bavaria.
- Wu X, Dang J, Stavness I. 2014. Iterative method to estimate muscle activation with a physiological articulatory model. Acoust Sci Technol. 35: 201–212.
- Yousefi AAK, Nazari MA, Perrier P, Panahi MS, Payan Y. 2018. A visco-hyperelastic constitutive model and its application in bovine tongue tissue. J Biomech. 71: 190–198.
- Yudkin JS, Kavanagh J, McCormack JP. 2016. Guidelines for treating risk factors should include tools for shared decision making. BMJ. 353: i3147.