
Abstract
The biomechanical parameters of the hip joint articular surface were analysed in 141 adult hips after Legg-Calve Perthes Disease, and 114 contralateral unaffected hips (controls), by using HIPSTRESS mathematical models. Geometrical parameters, assessed from anteroposterior and axial radiograms, were used as input to models for resultant hip force and contact hip stress. Results confirm previous indications that head enlargement after the Legg-Calve-Perthes Disease compensates the values of hip stress. Furthermore, it was found that an increased risk for coxarthritis development after the disease is secondary to concomitant hip dysplasia, with considerable and statistically significantly lower centre-edge angle and unfavourable distribution of stress.
Introduction
Legg-Calve-Perthes Disease (LCPD) affects the development of the hip through the disruption of the vascularity of the femoral epiphysis by a yet undefined mechanism (Kim Citation2012). The resulting osteonecrosis weakens the immature femoral head mechanically (Koob et al. Citation2007) leading to known sequels of LCPD, whose extent was shown to correlate with the higher prevalence of both, coxarthritis (Mose Citation1980; Stulberg et al. Citation1981) and Total Hip Arthroplasty (THA) later in life (Froberg et al. Citation2011). The mechanisms of the coxarthritis development are not yet entirely understood; however, the connection of these mechanisms with femoral head shape and size changes after LCPD have been sought by defining the degree of conformation between the head outline and templates of concentric circles on radiograms (Mose Citation1980), with the same principles later applied on the acetabular side (Stulberg et al. Citation1981). Application of engineering principles of measuring femoral head deviation from sphericity or roundness error have also been shown in LCPD (Shah et al. Citation2013). Quantification of the femoral head enlargement in LCPD by using Magnetic Resonance Imaging with custom-made image processing software showed significant volume increase for the pathological hips compared to healthy ones (Sales de Gauzy et al. Citation2009). It was indicated that the local enlargement of the radius of the femoral head could compensate the magnitude of contact hip stress in affected hips, however, at the cost of unfavourable distribution of load expressed by the stress gradient at the lateral acetabular rim (Kocjancic et al. Citation2014).
Using simple mathematical models for determination of biomechanical parameters from standard anteroposterior radiographs enables analysis of a large population of patients. The models used within the HIPSTRESS method, i.e. the model for resultant hip force in the one-legged stance R (Iglič et al. Citation1993) and the model for contact stress distribution (Ipavec et al. Citation1999), (reviewed in Kralj-Iglic et al. (Citation2012)) have already proved their usefulness in clinical evaluation of different diseases (Recnik et al. Citation2007; Mavčič et al. Citation2008). Mechanisms leading to cox-arthritis were connected to long-lasting elevated values of peak contact stress pmax and/or positive value of hip stress gradient index (Gp), that expresses rapid changes in contact hip stress at the lateral acetabular rim (Pompe et al. Citation2003).
Recently, HIPSTRESS models were used to determine biomechanical parameters in a group of 135 adult hips that were, in childhood, subjected to LCPD, and contralateral unaffected hips (Kocjancic et al. Citation2014). Results showed less favourable hip stress gradient index in the affected hips (Kocjancic et al. Citation2014). In that study, the model for stress was upgraded to encounter the deviation of the articular surface from spherical. However, in the analysis of the roentgenograms, the contours in the frontal and in the sagittal planes were taken to be circles with different radii. Here, we improved the analysis by considering the articular surface as an ellipsoid – like body with circular contour in the frontal plane. Considering that the contour of the articular surface in the frontal plane could be significantly different from the contour in the axial plane, we analysed the connection of this difference and the biomechanical parameters. Moreover, we distinguished between hips that, after the disease, developed into deformed hips, and hips with normal geometrical parameters, with possible indication of an increased risk for coxarthritis development.
Biomechanical evaluation
Biomechanical parameters were determined using three-dimensional mathematical models of the adult human hip within the HIPSTRESS method as described previously (Iglič et al. 1993; Ipavec et al. Citation1999).
The description of the model for calculation of the contact stress distribution constructed by upgrading the original models (Iglič et al. 1993; Ipavec et al. Citation1999) for the purpose of including the deformation of the articular surface (Kocjancic et al. Citation2014) is available with the online version of this article as a data supplement at tandfonline.com.
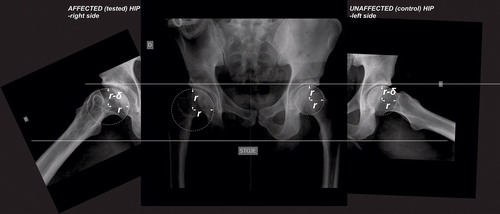
Radiographic magnification for each patient was calibrated by the image of a 32-mm ball placed between the legs in standard AP radiograms. The articular surface was fitted by a shell with spherical contour in the frontal plane through the centre of the femoral head, and elliptical contour in the sagittal plane through the centre of the femoral head. The vertical semiaxis of the ellipse in the sagittal plane was taken to be equal to the radius of the contour in the frontal plane (). For convenience, in assessment of the contours, the axial radiograms were rotated to the extent that the vertical semiaxis of the ellipse in the sagittal plane (r, r−δ) was parallel to the horizontal semiaxis of the circle in the frontal plane ().
Figure 1. Anteroposterior and axial radiograms of the patient after right-sided LCPD with obvious flattening of the articular surface in the anteroposterior direction; r represents the radius of the contour of the articular surface in the frontal plane, and r−δ represents the semiaxis of the elliptical contour in the sagittal plane. The axial radiograms were rotated to the extent that the vertical semiaxis of the ellipse in the sagittal plane (r, r−δ) was parallel to the horizontal semiaxis of the circle in the frontal plane.
The magnitude and direction of the resultant hip force (R and ϑR, respectively) were calculated by using a three-dimensional model HIPSTRESS (Iglič et al. 1993) with the input data the interhip distance, the height and the width of the pelvis, and the position of the characteristic point on the greater trochanter. The contact hip stress distribution, represented by the peak stress on the load bearing area (pmax), position of the stress pole (Θ), index of the stress gradient at the lateral acetabular rim (Gp), functional angle of the load bearing ϑf and the load bearing area Af, were calculated by using a three-dimensional model for the hip stress (Ipavec et al. Citation1999), adapted by taking into account the deformation of the articular surface (Kocjancic et al. Citation2014). The input data were the magnitude and direction of the resultant hip force, the lateral coverage of the femoral head by the acetabulum given by the centre-edge angle of Wiberg (ϑCE), the radius of the femoral head articular surface contour in the frontal plane, and the horizontal semiaxis of the fitted elliptical contour of the femoral head articular surface in the sagittal plane through the femoral head (r and r −δ, respectively). The models are described briefly in the supplement.
The parameters R, pmax and Gp are proportional to body weight WB, therefore, it was also of interest to study the normalised parameters (R/WB, pmax/WB, Gp/WB), which reveal the impact of the hip and pelvis geometry.
The input and calculated data were compared between test and control groups with differences being calculated as: Diff (%) = 2(valuetest − valuecontrol)/(valuetest + valuecontrol). We also calculated correlation between parameters that are not connected functionally within the model.
Statistical methods
Methods of descriptive statistics were used to determine differences between the test and control hip populations and correlations between the clinical, radiographic, biomechanical and geometrical parameters. We used the paired t-test and the Pearson correlation coefficient (ρ), with the respective probabilities (p) expressing the statistical significance. Average values and Standard Deviations of the parameters, probabilities of the t-test and Pearson coefficients were calculated with Microsoft Excel software (Microsoft® Office Excel® 2007 SP3). The probabilities of correlations were calculated with p-value Calculator for Correlation Coefficients (Soper 2019). Statistical power was calculated with the Power & Sample Size Calculator (HyLown Consulting 2018).
Results
Measurement of the deformation of the articular surface showed that some hips (in the test and in the control groups) are flattened, and others are extended in the anteroposterior direction, however, on average, they are mostly flattened (i.e. δ was positive on average). As expected, affected hips (test hips) were considerably (by 83%) and statistically significantly more flattened, with larger articular surface radius in the frontal plane (), later being favourable as regards hip stress. However, all other biomechanical parameters that exhibited statistically significant differences (centre-edge angle, functional angle of load bearing area, position of the pole, index of hip stress gradient and its normalised value), were less favourable in the test population (). No statistically significant differences in peak stress, its normalised value and size of the load bearing area were found between the test and the control groups ().
Table 1. Comparison of hips diagnosed with Legg Calve Perthes Disease in childhood and contralateral hips with respect to biomechanical and geometrical parameters.
We compared a group of hips that developed frontal radius of the articular sphere r larger than a chosen threshold value with a group of hips with r smaller than this threshold value (). Among hips with r > 2.65 cm, 72 pertained to the group of affected hips and 18 to the control group. Hips with r > 2.65 cm were considerably and statistically significantly more flattened (by 125%), had smaller centre-edge angle and functional angle of the weight bearing area, and had a positive hip stress gradient index (i.e. were dysplastic according to the HIPSTRESS criterion (Pompe et al. Citation2003)). The radius of the articular sphere overcompensated the weight bearing area, which was larger in hips with r > 2.65 cm. In effect, the peak contact stress and the normalised contact hip stress showed no statistically significant difference between hips with r > 2.65 cm and hips with r < 2.65 cm (). The threshold value 2.65 cm was chosen following previous analysis of cohorts without the record of disease (Kocjancic et al. Citation2014). However, we have performed analysis also with the threshold values 3.5 cm and 2.4 cm. In our previous studies (Kersnic et al. Citation1997, Mavcic et al. Citation2002) we have reported the average value of normal hips 2.3 cm with standard deviation 0.1 cm, so the lower bound of the threshold could be taken the average plus standard deviation (2.4 cm). The upper threshold bound 3.5 cm gives only 18 hips in the group of large hips. The choice of the threshold value within this range (thresholds 2.4, 2.65 and 3.5 cm) did not affect the qualitative outcome of all but one parameter (the average body weight of the respective groups). There were no statistically significant differences in maximal stress and normalized maximal stress between the respective groups while the other parameters showed statistically significant differences. All the differences had p smaller than 0.001 in all three cases of thresholds.
Table 2. Comparison of hips with frontal radius of the articular sphere larger than 2.65 cm, and hips with frontal radius smaller than 2.65 cm with respect to biomechanical and geometrical parameters.
We have also focused on the population of hips which later developed radii smaller than the threshold value (69 affected hips and 96 contralateral hips with threshold value 2.65 cm). The affected hips were considerably (by 55%) and statistically significantly more deformed than the contralateral normal sized hips with small (2%), but statistically significant, difference in the radius (). There were no statistically significant differences in peak stress (absolute and normalised) and the size of the weight bearing area, but considerable and statistically significant differences in the centre-edge angle, position of the stress pole, the functional angle of the weight bearing surface and hip stress gradient index (absolute and normalised) (). The results were qualitatively the same with the threshold value 2.4 cm. These results indicate that normal sized, yet affected hips, differed significantly in stress distribution from normal sized unaffected hips due to differences in geometrical parameters, most importantly in the centre-edge angle.
Table 3. Comparison of hips subjected to Legg Calve Perthes Disease with frontal radius of the articular sphere smaller than 2.65 cm and contralateral normal hips with frontal radius smaller than 2.65 cm, with respect to biomechanical and geometrical parameters.
It can be seen in that the average deformation δ and the average radius r showed moderate differences (p = 0.037 and 0.016, respectively). The power analysis yielded statistical power smaller than 0.8, therefore these differences cannot be claimed. However, this is favorable as regards relevance of the comparison between the groups. Namely, in we wished to compare two groups of hips with apparently normal femoral heads. We were aiming at a criterium to define the groups that would not differ in the radius of the articular surface at the first place. Additionally, it is favourable to see that also the heads of the hips subjected to Perthes disease were not deformed more than the contralateral heads.
We have previously proposed a classification of dysplastic hips according to the HIPSTRESS method by the sign of the hip stress gradient index Gp (Pompe et al. Citation2003) with the sign being positive/negative if the stress pole lies outside the weight bearing area or inside it. We have grouped hips according to this criterion () and with respect to the acknowledged criterion regarding the centre-edge angle (). We found in our population 66 dysplastic (and 189 normal) hips according to the HIPSTRESS classification and 43 dysplastic (and 212 normal) hips according to the ϑCE classification.
Table 4. Comparison of dysplastic (Gp positive) and nondysplastic (Gp negative) hips according to the HIPSTRESS classification, with respect to biomechanical and geometrical parameters.
Table 5. Comparison of hips with ϑCE smaller than 20 degrees and normal hips with ϑCE larger than 20 degrees, with respect to biomechanical and geometrical parameters.
Out of 66 dysplastic hips according to the HIPSTRESS classification, 56 (22% of all hips) were affected by LCPD, and 10 (4% of all hips) were contralateral, while, out of 43 dysplastic hips according to the centre-edge criterion, 40 (16% of all hips) were affected by LCPD and 3 (1% of all hips) were contralateral. and show that all biomechanical parameters were considerably and statistically significantly more favourable in nondysplastic hips according to both classifications. Dysplastic hips also had considerably and statistically significantly larger radius of the articular sphere in the frontal plane, smaller centre-edge angle and more deformed articular surface than normal hips.
It can be seen, that the difference in load bearing area A is more pronounced in than in : p is smaller (0.005/0.02) and statistical power is greater (0.80/0.64) (not shown in the tables). As the group of dysplastic hips according to Gp criterion (66 hips) is larger than the group of dysplastic hips according to the centre edge angle (42 hips), it could be expected that also the difference in A pertaining to the centre edge criterion would yield sufficient power if the number of hips with centre-edge angle smaller than 20 degrees were larger.
Correlations between parameters that are not connected functionally within the model () showed statistically significant correlations. Smaller functional angle of the weight bearing area and more laterally located stress pole are interconnected (see Appendix (24)), yet this unfavourable effect is compensated by larger radius of the articular surface in the frontal plane ().
Table 6. Correlation coefficients and corresponding probabilities between parameters. All hips (255) were considered.
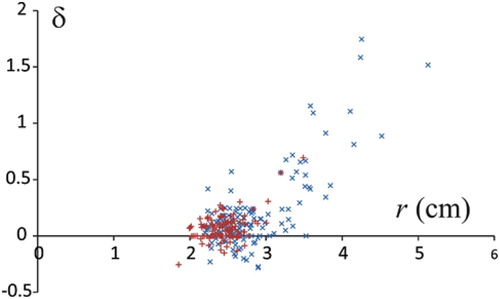
It can be seen () that the strong and positive correlation between the radius of the articular surface in the frontal plane and the deformation of the head is due mostly to the contribution of the affected hips (blue crosses), while singular unaffected hips which developed large articular surfaces (red crosses in the region of large radii (larger than 3 cm)) fit well into the correlation pattern. Also, most of the femoral heads are flattened in the anteroposterior direction (δ is positive). Amidst the hips that were extended in the anteroposterior direction, the hips affected by the Perthes Disease in childhood are, on average, more deformed.
Figure 2. Correlation between deformation of the articular surface and radius of the femoral head in the frontal plane. Blue crosses pertain to hips subjected to Perthes Disease in childhood and red crosses pertain to control (contralateral) hips.
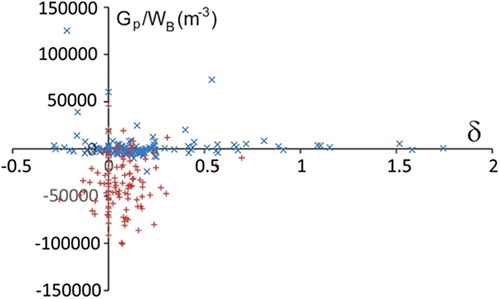
Most of the unaffected hips lie well below the threshold Gp = 0 (Pompe et al. Citation2003) for hip dysplasia (red crosses in ) while, regardless of the deformation parameter δ, the affected hips are close to the borderline or over the borderline. These results indicate the development of hip dysplasia secondary to Perthes Disease. Although the deformation of the femoral head (and, consequently, of the articular surface), is more pronounced in affected hips; the dysplasia and, consequently, less favourable stress distribution, is not due directly to deformation of the head, but due mainly to the decreased centre-edge angle.
Figure 3. Correlation between index of stress gradient normalised with respect to body weight Gp/WBand deformation of the articular sphere δ. Blue crosses pertain to hips subjected to Perthes Disease in childhood and red crosses pertain to control (contralateral) hips.
Discussion
We have analysed the biomechanical parameters of 141 hips that were subjected to LCPD in childhood, and distinguished between them and 114 contralateral hips without record of disease and taken as controls (). About half of the affected hips developed normal sized and shaped articular surfaces. Furthermore, these hips did not considerably nor statistically significantly differ from nonaffected hips in the deformation parameter δ (8.4% in affected and 4.8% in nonaffected hips). However, these hips had higher risk for coxarthritis development, as they differed considerably and statistically significantly in contact stress distribution (hip stress gradient index and the position of the stress pole). The centre-edge angle was, on average, considerably and statistically significantly smaller in the affected hips which developed a normal femoral head than in the nonaffected hips (28.6 degrees and 33.6 degrees, respectively).
Also, we have grouped hips according to the developed frontal radius of the articular sphere above the threshold value and those below, regardless of whether the hip was affected or not (), and found hips with larger radii considerably more deformed than hips with smaller radii (for the threshold value 2.65 cm, δ was 27% and 6%, respectively). Also, the hips with larger radii had, on average, ϑCE smaller than the average position of the pole Θ (meaning that they were dysplastic on average) with respect to normal sized hips in which the pole lay within the weight bearing area. Furthermore, we found statistically significant positive correlations between the deformation of the articular surface and radius of the articular surface in the frontal plane, and negative correlations of these quantities with the centre-edge angle, indicating that the configuration of the hip derives from the same adoptive developmental mechanism for optimization of stress distribution. In our pool of 255 hips, we have found 66 (26%) dysplastic hips according to the HIPSTRESS criterion and 43 (17%) according to centre-edge angle criterion, which is considerably higher than in the normal population (up to about 5% (Bialik et al., Citation1999; Kokavec and Bialik Citation2007)).
The above results indicate that the increased risk for coxarthritis is rather a consequence of hip dysplasia due to unfavourable stress distribution generated mostly by a small centre-edge angle and laterally located stress pole, than a direct consequence of the deformation of the femoral head.
We described the shape of the articular surface as a rotationally symmetric body, similar to an ellipsoid. However, as the region of the femoral head which bears most of the weight in the one-legged stance is located laterally and superiorly, we considered that the shape of the contour of the articular surface in the frontal plane is circular with the radius of the circle fitted to the curvature of the femoral head and the acetabulum in the range of the load bearing. In the hips with deformed femoral heads, there is considerable flattening of the head and acetabulum in that region, therefore, the radius of the articular surface circle in the frontal plane is large, and does not fit the contour of the femoral head medially and inferiorly. To obtain the shape of the articular surface which fits the joint optimally, the contour in the sagittal plane was taken to be quasi-elliptical. The appearance of the femoral head, however, is quasi-elliptical in the frontal plane and spherical in the sagittal plane. It should be born in mind that the articular surface is an abstract feature that is subject to the weight bearing and, therefore, outlines a particular region of the femoral head and the acetabulum. However, the deformation of the articular surface corresponds to the deformed appearance of the femoral head, considered by some authors who previously analysed development of hips after LCPD (Rowe et al. Citation2005; Shah et al. Citation2013).
In our previous analysis of LCPD we estimated the deformation of the articular surface by two spherical contours (one fitting the curvature of the contour of the femoral head at the lateral region in the frontal plane, and the other fitting the contour of the femoral head in the sagittal plane. We reported that such estimation did not indicate that the deformation of the articular surface is likely to be the cause of unfavourable distribution of stress after LCPD (Kocjancic et al. Citation2014). In this work, we performed a rigorous analysis of quasi-elliptical deformation of the articular surface. Also, we have considered the possibility that we previously found no statistically significant effect on the peak stress since we compared the group of hips after LCPD and contralateral hips, while a considerable portion of hips in the test group developed into normal shaped hips (Kocjancic et al. Citation2014). In the present analysis, we outlined those hips that developed articular surfaces with large radii in the frontal plane. Our results confirmed previous estimations as regards the role of the deformation of the articular surface (i.e., this deformation is not the direct cause of the unfavourable stress distribution). But we found that the concomitant decreased centre-edge angle renders the unfavourable stress distribution with positive gradient index and small functional angle of weight bearing.
Our study showed 72 hips (51% of the affected group) with radii of the contour of the articular sphere in the frontal plane larger than 2.65 cm, and this correlates with the previous report of “coxa magna” being present in a group of 85 hips after LCPD in 53%, when measuring the widest diameter of the femoral head on AP radiograms at skeletal maturity and considering the 10% difference between affected and unaffected sides as a threshold value (Rowe et al. Citation2005).
Stulberg classification still represents the reference standard for predicting the long-term outcome of patients with LCPD at skeletal maturity. It is based on analysis of long-term outcomes (30–60 years) of 156 non-operatively treated patients (171 hips) with respect to deformities of the proximal femur and acetabulum, visible at skeletal maturity on anteroposterior and lateral radiographs (Stulberg et al. Citation1981). The size of a femoral head was expressed by the ratio between the lengths of horizontal lines connecting most medial and lateral parts of the head on both sides, with coxa magna representing a difference of more than 10%. The head shape was determined with the method of Mose (Mose Citation1980) by the best fitting method with circular templates. Patients with most severe residual deformity (class V – “aspherical incongruency” representing an aspherical head with usually spherical acetabulum) developed severe osteoarthritis before 50 years of age, patients with moderate residual deformity (class III/IV – “aspherical congruency”) developed mild to moderate osteoarthritis, and patients with less severe or no deformity (class I/II “spherical congruency”) had no osteoarthritis (Stulberg et al. Citation1981). A long-term (37–58 years) outcome analysis of 135 non-operatively treated patients (156 hips) after LCPD compared to 312 control hips, showed history of THA in 13% of patients versus none in the controls (P = 0.001) and hip osteoarthritis in 7% of patients versus 1% of the controls (P = 0.04) (Rowe et al. Citation2005). Furthermore, within the LCPD group, the Stulberg Class III/IV/V subgroup had higher prevalences of both THA and hip osteoarthritis compared to the Stulberg Class I/II subgroup (P = 0.04 and P = 0.03, respectively) (Froberg et al. Citation2011). Rowe et al. (Citation2005) showed that larger heads resulted in skeletal maturity with worse Stulberg class and larger possibility of having osteoarthritis later in life. These results agree with our findings that larger articular surfaces express more unfavourable stress distribution when compared to normal sized ones (), and with previous results (Kocjancic et al. Citation2014) showing statistically significant correlation between stress gradient index and radiological Stulberg score. However, our analysis did not include the Stulberg class V (‘aspherical incongruency’) as it is assumed in the HIPSTRESS model that the femoral head and the acetabulum are congruent. Including this effect would require upgrading of the model.
Also, the control group consisting of contralateral unaffected hips represents only an approximation to healthy hips, although, the average radius of the articular surface and the average centre-edge angle in the control group showed comparable values (24.6 ± 2.6 mm and 33.4 ± 7.3° respectively) to those found in normal hips (23 ± 1 mm and 31 ± 6° respectively) (Mavčič et al. 2002).
The threshold value of the radius (e.g. 2.65 cm) was mimicking a measure of the coxa magna. Some normal (contralateral) hips may have exceeded the limit because the larger size of the body or specific proportions of the person which would not address the problem of deformed head due to Perthes disease. These hips (18 of them) were omitted from comparison.
Data_Supplement.docx
Download MS Word (32.4 KB)Acknowledgements
The authors are indebted to the Slovenian Research Agency (Grants P3-0388).
Disclosure statement
The authors declare that they have no conflicts of interest regarding this work.
The two authors listed last contributed equally to the work.
Related Research Data
References
- Bialik, V, Bialik, G M, Blazer, S, Sujov, P, Wiener, F, Berant, M. 1999. Developmental dysplasia of the hip: a new approach to incidence. Pediatrics. 103(1):93–99. doi: 10.1542/peds.103.1.93
- Froberg L, Christensen F, Pedersen NW, Overgaard S. 2011. The need for total hip arthroplasty in Perthes disease: a long-term study. Clin Orthop Relat Res. 469(4):1134–1140.
- Iglic A, Antolic V, Srakar F. 1993. Biomechanical analysis of various operative hip joint rotation center shifts. Arch Orthop Trauma Surg. 112(3):124–126.
- Iglic A, Srakar F, Antolic V. 1993. The influence of the pelvic shape on the biomechanical status of the hip. Clin Biomech (Bristol, Avon). 8(4):223–224.
- HyLown Consulting. 2013-2018. Calculate sample size needed to compare 2013–2018. Atlanta: [accessed 2019 Jun 6]. http://powerandsamplesize.com/Calculators/Compare-2-Means/2-Sample-Equality.
- Ipavec M, Brand RA, Pedersen DR, Mavcic B, Kralj-Iglic V, Iglic A. 1999. Mathematical modelling of stress in the hip during gait. J Biomech. 32(11):1229–1235.
- Kim HK. 2012. Pathophysiology and new strategies for the treatment of Legg-Calvé-Perthes disease. J Bone Joint Surg Am. 94(7):659–669.
- Kersnič B, Iglič A, Kralj-Iglič V, Srakar F, Antolič V. 1997. Increased incidence of arthrosis in female population could be related to femoral and pelvic shape. Arch Orthop Trauma Surg. 116(6–7):345–347.
- Kocjancic B, Molicnik A, Antolic V, Mavčič B, Kralj-Iglič V, Vengust R. 2014. Unfavorable hip stress distribution after Legg-Calve-Perthes syndrome: a 25-year follow-up of 135 hips. J Orthop Res. 32:8–16.
- Kokavec M, Bialik V. 2007. Developmental dysplasia of the hip. Prevention and real incidence. Bratisl Lek Listy. 108(6):251–254.
- Koob TJ, Pringle D, Gedbaw E, Meredith J, Berrios R, Kim HKW. 2007. Biomechanical properties of bone and cartilage in growing femoral head following ischemic osteonecrosis. J Orthop Res. 25(6):750–757.
- Kralj-Iglic V, Dolinar D, Ivanovski M, List I, Daniel M. 2012. Role of biomechanical parameters in hip osteoarthritis and avascular necrosis of femoral head. In: Ganesh RN, editor. Applied biological engineering principles and practice. Rijeka: InTech; p. 347–364.
- Mavcic B, Pompe B, Antolic V, Daniel M, Iglic A, Kralj-Iglic V. 2002. Mathematical estimation of stress distribution in normal and dysplastic human hips. J Orthop Res. 20(5):1025–1030.
- Mavcic B, Iglic A, Kralj-Iglic V, Brand RA, Vengust R. 2008. Cumulative hip contact stress predicts osteoarthritis in DDH. Clin Orthop Relat Res. 466(4):884–891.
- Mose K. 1980. Methods of measuring in Legg-Calvé-Perthes disease with special regard to the prognosis. Clin Orthop Relat Res. (150):103–109.
- Pompe B, Daniel M, Sochor M, Vengust R, Kralj-Iglic V, Iglic A. 2003. Gradient of contact stress in normal and dysplastic human hips. Med Eng Phys. 25(5):379–385.
- Recnik G, Kralj-Iglic V, Iglic A, Antolic V, Kramberger S, Vengust R. 2007. Higher peak contact hip stress predetermines the side of hip involved in idiopathic osteoarthritis. Clin Biomech (Bristol, Avon). 22(10):1119–1124.
- Rowe SM, Moon ES, Song EK, Seol JY, Seon JK, Kim SS. 2005. The correlation between coxa magna and final outcome in Legg-Calve-Perthes disease. J Pediatr Orthop. 25(1):22–27.
- Sales de Gauzy J, Briot J, Swider P. 2009. Coxa magna quantification using MRI in Legg-Calve-Perthes disease. Clin Biomech (Bristol, Avon). 24(1):43–46.
- Shah H, Siddesh ND, Pai H, Tercier S, Joseph B. 2013. Quantitative measures for evaluating the radiographic outcome of Legg-Calvé-Perthes disease. J Bone Joint Surg Am. 95(4):354–361. Feb 20.
- Soper D. 2006-2019. Free statistics calculators.Fullerton: [accessed 2019 Jun 5]. https://www.danielsoper.com/statcalc/calculator.aspx?id=44.
- Stulberg SD, Cooperman DR, Wallensten R. 1981. The natural history of Legg-Calvé-Perthes disease. J Bone Joint Surg Am. 63(7):1095–1108.