
 ?Mathematical formulae have been encoded as MathML and are displayed in this HTML version using MathJax in order to improve their display. Uncheck the box to turn MathJax off. This feature requires Javascript. Click on a formula to zoom.
1. Introduction
The motivation to focus on coherent structure detection in cardiovascular systems is two-fold: 1) the ability to reliably detect abnormal inefficient flow patterns from a normal optimal state; and 2) the detection of flow conditions conducive to secondary pathological processes such as thrombosis – as the coherent structures are thought to perform an important role in avoiding stasis by ‘washing out’ the cardiac cavities (e.g. the atrial appendage or LV apex; Birdwell et al. Citation1978).
Detection of the coherent structures could be performed using a number of different vorticity criteria, such as: threshold of vorticity magnitude, Q-criterion and λ2-criterion. However, prior application and evaluation of these different criteria in the cardiovascular system by 3D + t phase contrast (PC) flow MRI is limited as most approaches have used λ2- or Q-criteria (Elbaz et al. Citation2014) without comparison with other approaches. There is therefore a need to more broadly assess the capacity of these criteria to detect and describe coherent structures. Initial work by Garcia et al. (Citation2013), reported the influence of noise and the spatial resolution of helicity. An alternative approach using data clustering has been reported by Wong et al. (Citation2010).
The primary aim of this work is to compare criteria for the assessment of coherent structures in the left ventricle by 3D + t PC flow MRI in healthy volunteers. To investigate the influence of diastolic function on the coherent structures in healthy volunteers detected by different criteria (vorticity, Q- or λ2-criteria) is the second aim of this work.
2. Methods
2.1. Population and MRI acquisition
9 healthy volunteers underwent an MRI exam including a SSFP cine short axis stack covering the left ventricle (including the mitral valve annulus) and a 3D + t PC flow acquisition with the following parameters: encoding velocity of 150 cm/s, temporal resolution ranged between 16–20 frames per cardiac cycle (TR 41 ms, TE 2.8 ms, GRAPPA factor: 3).
2.2. Segmentation and pre-processing
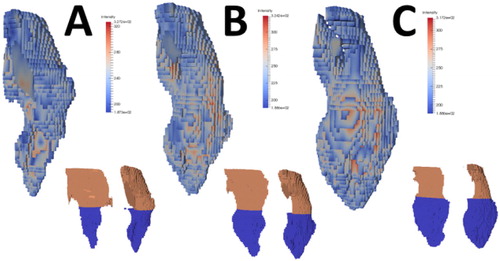
Reconstruction of the data in vtk and Paraview format was performed as previously described (Callaghan et al., Citation2016). Segmentation of the SAX images was performed on a K-means clustering of the intensity images and manually cleaned to select the mitral valve, left ventricle and LV outflow tract (). Orientation of the cine images on the 3D + t flow was performed using the maximum intensity projection of the squared sum of magnitude and intensity of the 3D + t flow images and using 3 point registration. Image segmentation was performed on the part of the cycle acquired by interpolating the segmentation derived from the SAX to the 3D + t dataset on 100 time steps. The E/A ratio was computed from MRI flow measurements in order to characterize diastolic function.
Figure 1. Anatomical segmentation example at different timing of the cycle.
2.3. Coherent structure detection
Vorticity criteria were computed as described below on the interpolated velocity fields. Velocity vectors were extracted at each point of space
with
as integer indices which could be mapped onto a specific coordinate system to specify
and
resolution. The decomposition of the Jacobian matrix is given as: J =
into symmetric and anti-symmetric parts:
and
resulted in a vorticity vector ω:
From this decomposition, the Q-criteria, is the spatial region where the strain rate is dominated by the Euclidian norm of the vorticity tensor (Haller Citation2005):
is the second highest eigenvalue of
which is symmetric and has 3 real eigenvalues under appropriate assumptions (Jeong and Hussain Citation1995). According to the authors, the vorticity magnitude threshold was said to be subjective. They advised the use of
as the criterion for vortex detection over the Q-criterion which was found to be inappropriate for conically symmetric vortex detection. Under appropriate assumptions,
determines spatial location of pressure minimum in a two-dimensional plane for Navier-Stokes flows. As conical symmetric vortices have not been observed in cardiovascular system, the hypothesis is that each criterion could be efficient for cardiovascular vortex detection.
3. Results and discussion
The subject characteristics and the diastolic function are described in . E/A ratio are found higher than expected.
Table 1. Subject characteristics and diastolic function.
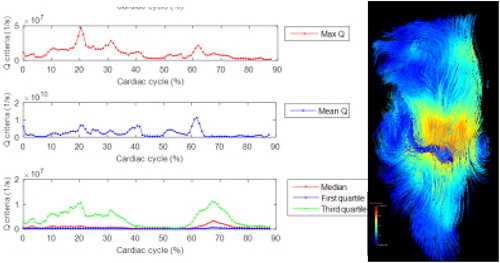
Q-criteria enables the vortex ring created around the mitral jet to be highlighted in almost all subjects, while another vortex ring is visible at the apex of the left ventricle in two subjects. Median and last quartile enable the detection of the vortex time. λ2- and -criteria could complete the description of the coherent structure in the left ventricle (). However, no threshold could be found to clearly determine the inside and outside of the vortex ring as such criteria are influence by mitral and aortic flows.
Figure 2. Anatomical segmentation examples at different times of the cycle.
While 3D + t flow MRI quantification of the flow pattern in left ventricle could be interested in the diagnostic of the diastolic function, post-processing necessary for such diagnostic remains intricate. Those preliminary results aim to show the feasibility of such post-processing and will require further improvement. The influence of patients hemodynamic (mitral valve inflow and aortic outflow), the influence of velocity interpolation as well as of the registration of both flow and anatomical data need to be furtherly assessed.
4. Conclusions
Comparison of three criteria provides insight into the coherent structures formed during the cardiac cycle in relation with the diastolic function.
The coherent structures in the left ventricle detected by 3D + t PC MRI needs further investigation in order to find an adequate criterion enabling the definition of a universal threshold describing the volume of the vortex ring.
References
- Birdwell CR, Gospodarowicz D, Nicolson GL. 1978. Identification, localisation and role of fibronectin in cultured bovine endothelial cells. Proc Natl Acad Sci. 75(7):3273–3277.
- Callaghan FM, Kozor R, Sherrah AG, Vallely M, Celermajer D, Figtree GA, Grieve SM. 2016. Use of multi-velocity encoding 4D flow MRI to improve quantification of flow patterns in the aorta. J Magn Reson Imaging. 43(2):352–363.
- Elbaz MSM, Calkoen EE, Westenberg JJM, Lelieveldt BPF, Roest AAW, Geest R. 2014. Vortex flow during early and late left ventricular filling in normal subjects: quantitative characterization using retrospectively-gated 4D flow cardiovascular magnetic resonance and three-dimensional vortex core analysis. J Cardiovasc Magn Reson. 16:78
- Garcia J, Larose E, Pibarot P, Kadem L. 2013. On the evaluation of vorticity using cardiovascular magnetic resonance velocity measurements. J Biomech Eng. 135(12):124501
- Haller G. 2005. An objective definition of a vortex. J Fluid Mech. 525:1–26.
- Jeong J, Hussain F. 1995. On the identification of a vortex. J Fluid Mech. 285(1):69–94.
- Wong KKL, Tu J, Kelso RM, Worthley SG, Sanders P, Mazumdar J, Abbott D. 2010. Cardiac flow component analysis. Med Eng Phys. 32:174–188.